
ABSTRACT
Subglacial meltwater of land-terminating glaciers in Greenland and Iceland are sources of methane (CH4) to the atmosphere, but sparse empirical data exist about the spatial distribution of subglacial CH4 production and emission from glaciers in other regions of the world. This study presents the first measurements of CH4 emissions from the subglacial meltwater of three outlet glaciers of the St. Elias Mountains in Yukon, Canada. Dissolved CH4 concentrations were highly elevated at 45, 135, and 250 times compared to the atmospheric equilibrium concentration in the meltwater of Dusty, Kluane, and Donjek glaciers, respectively. Dissolved CO2 concentrations were depleted relative to the atmospheric equilibrium. This points to the meltwater being a source of CH4 and a sink of CO2. Stable carbon (13C) and hydrogen (2H) isotopic signatures of the subglacial CH4 were depleted compared to atmospheric CH4 at all sites, indicating both biotic and abiotic sources and possible alteration from bacterial CH4 oxidation in the meltwater. No relation was found between CH4 concentrations in the meltwater and the meltwater chemistry or the size of the glaciers in this study. These findings suggest that CH4 emissions from subglacial environments under alpine glaciers may be a more common phenomenon than previously thought.
Introduction
Meltwaters from subglacial environments of land-terminating outlet glaciers from the Greenland Ice Sheet (Christiansen and Jørgensen Citation2018; Lamarche-Gagnon et al. Citation2019; Christiansen et al. Citation2021; Pain et al. Citation2021) and Iceland (Burns et al. Citation2018) and, with much lower concentrations, from alpine glaciers in Alaska (Konya et al. Citation2022) and China (Du et al. Citation2022) are newly discovered sources of direct methane (CH4) emissions to the atmosphere. Little empirical data exist about these direct CH4 emissions, their spatial occurrence and distribution in a wider variety of glaciated regions of the world, glacier types, and dynamic behaviors (e.g., surging glaciers). Similarly, little is known about its glacial and biogeochemical drivers. Considering that 11 percent of the Earth’s landmass is covered by ice masses (Boyd et al. Citation2010), this limits our understanding of its regional and global importance for atmospheric carbon budgets and its possible role in the climate system (Wadham et al. Citation2019).
Although direct emissions of CH4 have only been shown for five glacial outlets worldwide, it is widely acknowledged that the subglacial CH4 is most likely of biotic origin produced via methanogenesis (acetoclastic and hydrogenotrophic) by methanogenic archaea that exist at the base of glaciers (Skidmore, Foght, and Sharp Citation2000; Boyd et al. Citation2010; Stibal et al. Citation2012; Burns et al. Citation2018) and ice sheets (Christner, Montross, and Priscu Citation2012) where they convert organic carbon to CH4 under anoxic conditions (Burns et al. Citation2018; Lamarche-Gagnon et al. Citation2019; Wadham et al. Citation2019; Christiansen et al. Citation2021). Field evidence also points to the fact that bacterial oxidation of this CH4 to CO2 happens in the subglacial environment (Michaud et al. Citation2017; Pain et al. Citation2021), reducing net CH4 emissions. In addition, it has been suggested that subglacial CH4 can originate from other processes, such as the release of trapped crystalline abiotic CH4 (e.g., formed at high temperatures in the mantle) through mechanical grinding of rocks at the glacier bed (Gill-Olivas et al. Citation2023) or thermogenic CH4 (e.g., produced by thermal degradation of organic matter in the upper crust) released from destabilization of CH4 hydrates below ice sheets (Wadham et al. Citation2012, Citation2019; Portnov et al. Citation2016; Pain et al. Citation2021).
The subglacial organic carbon can originate from various relict proglacial in situ sources such as soil organic matter, vegetation, peat, and lacustrine and marine sediments, which can be overridden and covered by ice during a glacier advance (Wadham et al. Citation2008; Stibal et al. Citation2012; Burns et al. Citation2018). Glacier retreat and readvance may impact the amounts of organic carbon that can accumulate underneath a glacier and be turned into CH4. Though the published studies collectively indicate that microbial methanogenesis and oxidation can occur under various subglacial environments of glaciers and ice sheets, we know very little about the spatial occurrence of subglacial CH4 and CO2 processes and their rate-limiting drivers in different glacial settings.
The main aim of this study was to (1) investigate whether glaciers of the St. Elias Mountains had the potential for direct CH4 and CO2 emissions from subglacial meltwater and, if present, (2) determine the carbon source(s) of subglacial CH4 and (3) investigate how bedrock geology, glacier size, and surging history are linked to CH4 concentrations in the meltwater.
To fulfill these aims, we sampled subglacial meltwater at three land-terminating outlet glaciers of the St. Elias Mountains in the Kluane National Park and Reserve in Yukon, Canada. We measured dissolved CH4 and CO2 concentrations in meltwater and air directly in the field and the laboratory and analyzed the isotopic composition of dissolved CH4 and meltwater chemistry.
Study area
The St. Elias Mountains stretch along the border of Canada and the United States in southwestern Yukon and southeastern Alaska () and are covered by various glacier types, such as valley glaciers, piedmont glaciers, plateau glaciers, and ice fields with outlet glaciers (Clarke and Holdsworth Citation2002). The elevation range from sea level to almost 6,000 m.a.s.l. results in a temperature and precipitation gradient and the full spectrum of glacial thermal regimes from cold-based to polythermal and temperate (Clarke and Holdsworth Citation2002).
Figure 1. (a) Overview map of the study area. Source: Open Street Map, Mosaic of Sentinel-2 satellite images acquired between 23 July and 31 August 2021 at 50-m resolution, coordinate system WGS 84/UTM zone 8 N, glacier outlines as of 2010 (GLIMS Consortium Citation2005), and bedrock geology (Yukon Geological Survey Citation2022). (b) Location of study area on the border of Yukon and Alaska. Source: Google Maps. Close-up of sampling areas at (c) Donjek glacier, (d) Kluane glacier, and (e) Dusty glacier at scale 1:50,000. Source: Sentinel-2 satellite images from August 2021 at 10-m resolution, glacier outline as of 2010 (GLIMS Consortium Citation2005).
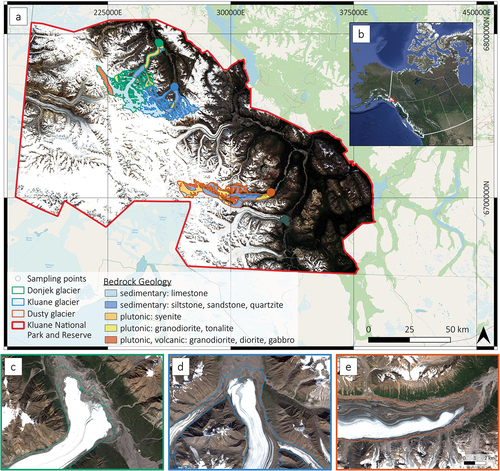
The study sites at the termini of three valley glaciers draining the St. Elias Mountains to the east were chosen based on three criteria: (1) different sizes of the catchment to presumably cover different sizes of subglacial areas with anoxic conditions; (2) the absence of a proglacial lake at the terminus to measure and collect samples as close as possible to subglacial outflows as degassing could have taken place, effectively lowering concentrations of dissolved gases at a greater distance; and (3) accessibility by helicopter. The choice was made by visual inspection of aerial photographs and satellite images. From north to south, the chosen sampling locations were Donjek glacier (61°12′32.29″ N, 139°32′13.88″ W), Kluane glacier (60°58′30.58″ N, 139°19′56.14″W), and Dusty glacier (60°25′41.52″ N, 138°11′20.00″ W; ). All three glaciers are classified as surge-type glaciers, indicating a temperate or polythermal regime (Murray et al. Citation2003).
Donjek glacier is the largest of the three studied valley glaciers when comparing size, length, and volume (). At the terminus, Donjek glacier flows into the Donjek river valley, where the glacier widens to a lobe. Donjek glacier is an active surge-type glacier with a short and regular surge cycle. The quiescent phase lasts around twelve years before a two-year-long surge (Kochtitzky et al. Citation2019). Since 1935, eight surges have been identified, the last from 2012 to 2014 (Kochtitzky et al. Citation2019). Kluane glacier flows into the Donjek river valley upstream of Donjek glacier and is the smallest and thinnest glacier of the study (). Kluane glacier is classified as a surge-type glacier due to visible fold trains along the ice of the glacier tongue, a morphological characteristic of surging glaciers (Young et al. Citation2022). Besides the surge of a tributary glacier from 2017 to 2018 (Samsonov, Tiampo, and Cassotto Citation2021), there is no documentation about previous surges of this glacier (Main et al. Citation2019). The third study site, Dusty glacier, is the second largest glacier of the study (). Dusty is a surge-type glacier, as suggested by the presence of folded medial moraines and a surge around 1966 (Clarke and Holdsworth Citation2002). The periodicity of the surge events of this glacier is unknown (Johnson Citation1995).
Table 1. Basic glacier characteristics. Glacier size and length as of 2010 for all glaciers (GLIMS Consortium Citation2005), elevation in 15 arc seconds resolution (National Centers for Environmental Information Citation2022), and glacier surface flow velocities for 2017 and 2018 in meters per year (Millan et al. Citation2022).
Sedimentary and igneous rocks dominate the bedrock geology of the study area. The majority of the catchment of Donjek and Kluane glaciers is underlain by carbonate rocks, mainly limestone and, to a minor degree, argillite and phyllite, and clastic rocks such as siltstone, sandstone, quartzite, and schist. Plutonic and volcanic rocks such as syenite, granodiorite, diorite, and gabbro are the second most abundant rock types under Donjek glacier but almost absent under Kluane glacier. The bedrock geology of Dusty glacier differs from that of the other two glaciers. Here, carbonate rocks cover only a small area of the catchment, which instead comprises clastic sedimentary and plutonic rocks (Yukon Geological Survey Citation2020; ).
Materials and methods
Collection of samples from upwellings of pressurized subglacial meltwater that can be enriched with dissolved gases (Lamarche-Gagnon et al. Citation2019). From a helicopter survey prior to choosing the exact sampling locations, it was observed that upwellings were present at the termini of all three glaciers. On 8 August 2022, all three glaciers were visited for 30 to 120 min, samples were collected, and measurements were performed a few meters from the center of each upwelling. On 11 August 2022, the upwelling at the terminus of Dusty glacier was revisited for a 10-h sampling campaign with hourly sampling. All samples were cooled at +4°C before analyses except on the flights from Canada to Denmark.
Measurements of CH4 and CO2
Atmospheric mixing ratios of CH4 and CO2 (gCH4 and gCO2) and dissolved concentrations of CH4 and CO2 (dCH4 and dCO2) were measured with three different methods: (1) ambient atmospheric background measurements with a portable CH4/CO2 gas analyzer; (2) in situ screening tests of dissolved gases with the portable CH4/CO2 gas analyzer; and (3) in situ extracted discrete gas samples for analyses via gas chromatography.
Atmospheric background measurements
Ambient atmospheric mixing ratios of gCH4 and gCO2 were measured in situ with a factory-calibrated CH4/CO2 gas analyzer (GLA131-GGA, LGR, sampling frequency 1 Hz with a precision of 0.9 ppb and a flow rate of 2.7 L min−1) by placing a tube connected to the inlet of the CH4/CO2 gas analyzer a few meters from the upwelling at all sites and measuring continuously for 5 min. These measurements allowed the detection in the field if the meltwater interacted with the atmospheric mixing ratios of CH4 and CO2 by exchange with the atmosphere. These numbers were used to correct concentrations of dissolved gases extracted in the field into an atmospheric headspace as described in method 2.
In situ screening tests of dissolved CH4 and CO2
To determine the presence of dCH4 and dCO2 in the meltwater with in situ screening tests, 2 L meltwater was collected in 4 L ziplock bags, allowing a headspace with ambient air. The bags were sealed and shaken for 2 min to extract dissolved gases into the headspace. A plastic tube was fitted between the ziplock bag and the inlet of the CH4/CO2 gas analyzer, permitting in situ measurements of headspace CH4 and CO2 mixing ratios. The bag was squeezed tightly around the tube to avoid contamination with atmospheric air, but it cannot be excluded that relatively small amounts diluted the headspace after shaking. The best estimate of the headspace volume in the bag was calculated by emptying the headspace using the CH4/CO2 gas analyzer pump while measuring the mixing ratio of CH4 and CO2 in the headspace. Multiplying the measurement duration (13–30 s) by the flow rate (2.7 L min−1) of the CH4/CO2 gas analyzer, plus an additional approximately 100 mL (equivalent to 2 s of pumping) left in the bag to avoid water entering the CH4/CO2 gas analyzer (see Figure S1a and b), yielded a headspace of 0.59 to 1.35 L. The measurement duration of 13 to 30 s was long enough for elevated concentrations to stabilize due to the combined high flow and precision of the CH4/CO2 gas analyzer. In situ tests were performed four times at Dusty and Donjek glaciers and three times at Kluane glacier on 9 August 2022, and between two and three times every 4 h at Dusty glacier on 11 August.
The dissolved concentration of CH4 (nmol L−1) was calculated using the procedure described in Christiansen et al. (Citation2021) assuming a water temperature of 0°C during extraction and subtracting the 5-min average ambient CH4 atmospheric mixing ratios () from measured headspace CH4 concentrations in the bag to account for the additionally added ambient CH4. Concentrations of dissolved CO2 from in situ screening tests were not calculated because the standard method (Weiss Citation1974) assumes a higher than atmospheric equilibrium concentration in the water sample, which was not the case.
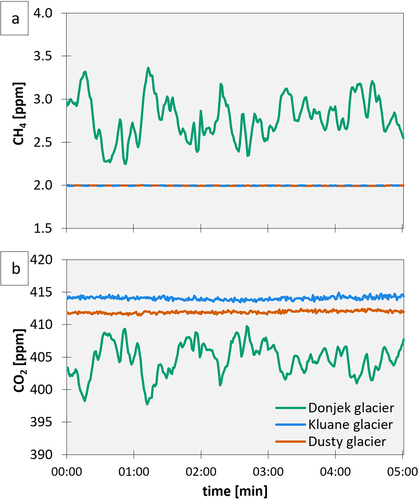
Figure 2. (a), (b) Atmospheric background mixing ratios of gCH4 and gCO2 measured with the CH4/CO2 gas analyzer for a duration of 5 min a few meters from the center of the upwellings at each site.
Discrete samples for dissolved CH4 and CO2 concentrations
Discrete gas samples were collected to determine the dCH4 and dCO2 concentrations more accurately than in the in situ screening tests. A bucket (10 L) was filled with meltwater from the upwelling to allow the collection of duplicate samples for dissolved gases from the same body of water while avoiding potential degassing between replicates due to turbulence. Immediately after filling the bucket, two 60-mL syringes capped with three-way valves were gently submerged in the water with the plunger out. The plunger was inserted into the syringe under water and excess water and gas bubbles were pushed out of the syringe by holding it vertically until 40 mL of water remained. Twenty milliliters of N2 gas was drawn into the syringes from an N2-filled Supel-inert multilayer foil bag, forming a 20-mL N2-filled headspace. The three-way valves were closed, and the syringes were shaken for 2 min, avoiding unintentional heating from hands by holding them on the plunger during shaking. A syringe needle was mounted on the valve, and the first 5-mL headspace was discarded. From each syringe, duplicate pre-evacuated 3-mL glass exetainers were filled and overpressurized with 5-mL headspace. On 8 August, four exetainers were filled at the three field sites. At Dusty glacier on 11 August, four exetainer samples were collected every full hour between 10:10 and 20:00. In the laboratory, overpressure was released from the exetainers by inserting a needle through the rubber septum. Three months after sampling, the exetainers were analyzed on an Agilent 7890A gas chromatograph fitted with a flame ionization detector for CH4 and CO2. A methanizer was used to convert CO2 into CH4. The dissolved concentrations of CH4 (nmol L−1) and CO2 (µmol L−1) were calculated using the same procedure as in Christiansen et al. (Citation2021) for CH4 and Weiss (Citation1974) for CO2, assuming a water temperature of 0°C during extraction.
Gas samples for the analyses of the isotopic composition of CH4
From the outlet of the CH4/CO2 gas analyzer, the measured extracted gases from the in situ screening tests were collected in rinsed and evacuated 2 L foil bags for analyses of stable carbon and hydrogen isotope values (δ13C-CH4 and δ2H-CH4 values, respectively). Each foil bag was filled with the headspace of two to four in situ gas extractions in ziplock bags to a total volume of ~2 L. One foil bag was filled at each field site on 8 August 2022. At Dusty glacier on 11 August, foil bag samples were collected every fourth hour at 12:30, 16:15, and 20:15. Analyses took place in the laboratory of the University of Heidelberg, Germany, four weeks after collection. In this study, the conventional δ-notation in per mill (‰) is used to express the stable isotope ratios of CH4 relative to Vienna Peedee Belemnite and Vienna Standard Mean Ocean Water for carbon and hydrogen, respectively.
For the measurement of δ13C-CH4 and δ2H-CH4 values, gas samples from the foil bags were transferred to pre-evacuated 12-mL glass exetainers and analyzed using a DeltaPLUS XL IRMS (ThermoFisher Scientific) coupled with an HP 6890N gas chromatograph (GC) that was equipped with a CP-PoraPLOT Q capillary column, using a Combustion III Interface. The combustion interface included an oxidation reactor (GC-C) held at a temperature of 960°C for stable carbon isotope ratio measurements and a thermo conversion reactor (GC-TC) maintained at a temperature of 1450°C for stable hydrogen isotope ratio analysis. Before the samples were analyzed in the GC-C/TC-IRMS system, it was introduced via a cryogenic preconcentration unit (for a more detailed explanation, refer to Greule, Huber, and Keppler Citation2012). The normalization of stable isotope values was performed by using two CH4 reference gases that were calibrated against International Atomic Energy Agency and National Institute of Standards and Technology (NIST) reference materials, with δ13C-CH4 values of −42.3‰ and −61.4‰ and δ2H-CH4 values of −190.6‰ and −312.7‰. The normalization of the analyzed stable isotope values was performed as described in Paul, Skrzypek, and Fórizs (Citation2007).
Water chemistry
On 8 August, meltwater samples for the determination of pH, electrical conductivity, alkalinity, major ions, dissolved organic carbon (DOC), and dissolved inorganic carbon were collected in 50-mL PVC tubes from the same meltwater-filled bucket as the dissolved gas samples rinsed three times with sample water and ensuring that no bubbles were present after sampling. Samples were not filtered or acidified in the field; hydrochemical data should be treated as conservative estimates because dissolution of particulate sediment during transport and storage could have increased the concentration of dissolved elements. Due to the fast dissolution of Ca2+ and Mg2+, the reported values of these elements are estimated to be elevated compared to in situ concentrations (Slatt Citation1972). As a consequence, measured pH values, which were likely elevated due to dissolution of particulate Ca2+ post sample collection, will not be reported.
A total of 150 mL was collected at Dusty glacier and 300 mL at Kluane and Donjek glaciers. On 11 August at Dusty glacier, one sample of 50 mL was collected each hour, except at 12:00, 16:00, and 20:00, corresponding to the timing of foil bag samples, when 110 mL was collected in one 50-mL and four 15-mL PVC tubes.
Water samples were analyzed in the laboratory of the Department of Geoscience and Natural Resource Management, University of Copenhagen. For samples collected on 8 August, three 50-mL samples were pooled into a 150-mL sample at the Dusty glacier site, and six 50-mL samples were pooled into 300 mL at Kluane and Donjek glaciers. For samples with a volume of >110 mL, electrical conductivity and alkalinity were measured simultaneously with an 855 Robotic Titrosampler, which was available for all samples collected on 8 August and three samples collected at Dusty glacier on 11 August at 12:00, 16:00, and 20:00. Prior to multi-element analysis by inductively coupled plasma–mass spectrometry (ICP-MS) the samples were acidified by adding 200 µL concentrated nitric acid of subboiling quality to a 10-mL sample. Analysis was done on the iCAP-Q ICP-MS in KED mode using He as the collision gas. For quantification, external calibration and internal standards were used to compensate drift and matrix effects. The NIST 1643f and NIST 1640a reference materials were analyzed to evaluate calibration verification and accuracy. DOC was measured with a TOC-V CPH total organic carbon analyzer with a TNM-1 total nitrogen measuring unit. Ion chromatograph (IC) analyses for Cl−, NO3−, and SO42− were performed on a 930 Compact IC Flex. HCO3− concentration was calculated from alkalinity (Rounds and Wilde Citation2012). The NH4+ concentration was measured with continuous flow analysis using a Seal AA500 Autoanalyzer.
Results
Comparison of CH4 and CO2 concentrations in air and meltwater between Donjek, Kluane, and Dusty glaciers
The effect of the CH4 degassing (and hence emission) and net CO2 uptake in meltwater on the atmospheric concentration was clearly visible at the Donjek site, where atmospheric mixing ratios of gCH4 and gCO2 were highly variable and consistently higher than the atmospheric background for CH4 (~2 ppm) and lower for CO2 (~415–420 ppm), respectively (). For the Dusty and Kluane sites, the background mixing ratios were stable and did not differ for gCH4 and only a few parts per million for gCO2, which could be due to turbulent mixing by wind.
Discrete samples extracted by the headspace method showed the lowest dCH4 concentrations in the meltwater of Dusty glacier (164 ± 5 nmol L−1), followed by Kluane glacier (482 ± 9 nmol L−1) and Donjek glacier (922 ± 26 nmol L−1; ), corresponding to 45, 135, and 250 times the atmospheric equilibrium of dissolved CH4. dCO2 concentrations were comparable between the sites and had a larger standard deviation between duplicate samples. The lowest dCO2 concentrations were measured at Dusty glacier (5.5 ± 1.5 µmol L−1), followed by Donjek glacier (6.0 ± 1.7 µmol L−1) and Kluane glacier at (6.3 ± 0.9 µmol L−1). Average dCH4 concentrations from discrete samples were in the same range as average concentrations from in situ screening tests, deviating only 2.1 percent, for all calculated dCH4 concentrations (nmol L−1; ). An example of an in situ screening test for dissolved CH4 and CO2 at each site is plotted in Figures S1a and S1b, and CH4 and CO2 mixing ratios during all performed in situ screening tests are provided in and Table S1.
Table 2. Summary of dCH4 concentrations and dCO2 mixing ratios from in situ screening tests and dCH4 and dCO2 concentrations from discrete samples.
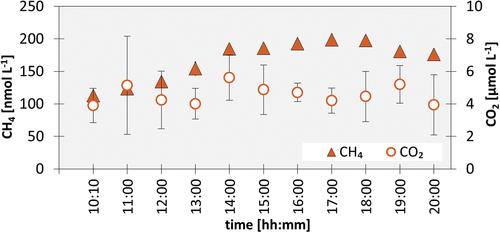
Dissolved gas concentrations of discrete samples collected over an 10-h period at Dusty glacier on 11 August 2022 () were of comparable magnitude to samples collected three days before at this site (). dCH4 concentrations varied over the 10 h, starting at 113 ± 2 nmol L−1 at 10:10 and increasing to a maximum of 199 ± 8 nmol L−1 at 17:00 before decreasing slightly to around 176 ± 6 nmol L−1 at the end of the measurement period at 20:00. Average dCO2 concentrations varied little, between 4 and 6 µmol L−1, throughout the measurement period but showed considerable variability between duplicate samples.
Figure 3. Time series of dCH4 (nmol CH4 L−1) and dCO2 (µmol CO2 L−1) concentrations at Dusty glacier on 11 August 2022. Error bars indicate standard deviations.
Isotopic (δ13C-CH4 and δ2H-CH4 values) composition of subglacial CH4
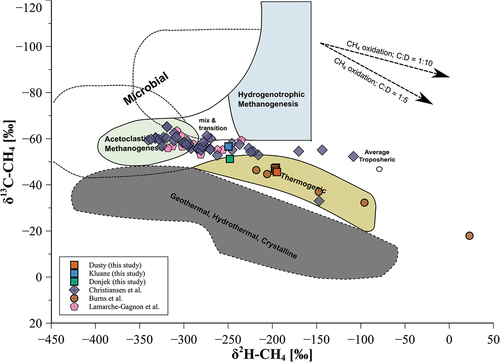
The stable carbon and hydrogen isotope values of dCH4 at Dusty glacier during all four sampled time points were the most enriched of the three investigated sites and lie in a very narrow range with δ13C-CH4 values from −47.5‰ to −45.5‰ and δ2H-CH4 values between −197‰ and −195‰ (). Compared to Dusty glacier, both δ13C-CH4 and δ2H-CH4 values were more depleted at Kluane and Donjek glaciers, which also contain a higher coverage of sedimentary rocks (). dCH4 at Kluane glacier displayed the most depleted δ13C-CH4 and δ2H-CH4 values of −56.6‰ and −250‰, respectively, whereas at Donjek glacier stable isotope values were less depleted, with δ13C-CH4 and δ2H-CH4 values of −51.3‰ and −248‰, respectively ().
Figure 4. Dual isotope plot showing δ13C-CH4 and δ2H-CH4 values of dissolved CH4 at Dusty, Kluane, and Donjek glaciers compared to previous studies at other sites from Burns et al. (Citation2018), Lamarche-Gagnon et al. (Citation2019), and Christiansen et al. (Citation2021). Stable isotope values taken from the literature are given as the mean average with standard deviation. Colored areas show the classification of CH4 sources based on its stable isotope composition (adapted after Whiticar Citation1999).
Water chemistry
The most abundant anion in the meltwaters of all three glaciers was HCO3− and cation Ca2+. HCO3− concentrations were 139, 45, and 79 mg L−1, and Ca2+ concentrations were 15, 21, and 26 mg L−1 in the meltwaters of Dusty, Kluane, and Donjek glaciers, respectively. DOC concentrations were highest in the meltwater of Dusty (9.6 mg L−1), followed by Donjek (8.3 mg L−1) and Kluane (4.6 mg L−1). After HCO3−, the three most abundant anions in all glaciers were SO42− > Cl− > NO3−. Concentrations of SO42− were an order of magnitude smaller than HCO3− and Cl− and NO3− was an order of magnitude smaller than SO42−. The five most abundant cations in the meltwater of all glaciers after Ca2+ were S > Mg2+ > K+ > Na+ > Si (). The highest concentration of all major cations was measured in the water from Donjek glacier, followed by Kluane and Dusty glaciers. Overall, the chemical composition of the meltwater was similar between the three glaciers, with some deviation in concentrations, but due to nonfiltering and acidification in the field as mentioned above, concentrations should be regarded as approximate estimates.
Table 3. Results of hydrochemical analyses of meltwater of all three glaciers.
Discussion
The first aim of this study was to investigate whether glaciers of the St. Elias Mountains have the potential for direct emissions of CH4 and CO2 from meltwater as has previously been shown for other glacial locations (Burns et al. Citation2018; Christiansen and Jørgensen Citation2018; Lamarche-Gagnon et al. Citation2019; Pain et al. Citation2021). The meltwater of all three surveyed glaciers was elevated in dCH4 and depleted in dCO2 compared to the equilibrium with atmospheric mixing ratios. Though the magnitude of dCO2 concentrations was comparable between the three glaciers, dCH4 concentrations varied significantly. dCH4 concentrations in the meltwater of the Donjek, Kluane and Dusty glaciers (136–899 nmol L−1) fell within the range of published values from other known subglacial CH4-emitting glaciers (Christiansen and Jørgensen Citation2018; Lamarche-Gagnon et al. Citation2019; Pain et al. Citation2021). dCH4 concentrations in this study () were higher than reported for Kiattut Sermiat in southwestern Greenland (mean ± standard deviation: 9 ± 5 nmol L−1; Pain et al. Citation2021) and fell within the concentration range reported from the two other Greenland glaciers: Russell glacier (dCH4 110 ± 78 nmol L−1; Pain et al. Citation2021) and Leverett glacier (271 ± 34 nmol L−1 over the first two months of the melt season; Lamarche-Gagnon et al. Citation2019) and the lower concentration range of previously reported values from the subcatchment of Isunnguata Sermia (1,575 ± 997 nmol L−1; Pain et al. Citation2021), which is often referred to as Point 660 (Lindbäck et al. Citation2015). The Point 660 site displayed pronounced diurnal and seasonal variations in dCH4 that exceeded values measured in this study up to one order of magnitude (Christiansen and Jørgensen Citation2018; Christiansen et al. Citation2021; Pain et al. Citation2021). The comparably small diurnal signal of dCH4 concentrations and stable dCO2 concentrations in the 10-h time series of Dusty glacier could potentially be an indicator of pressurized meltwater discharge from a confined subglacial conduit with the first point of degassing of dissolved CH4 at the glacier terminus.
In the meltwater of the Yukon glaciers, dCO2 concentrations were significantly depleted (5 ± 2 µmol L−1) compared to the equilibrium at atmospheric concentrations. In contrast, meltwaters of other known subglacial CH4-emitting glaciers were reported to be enriched in dCO2 throughout the melt season (Isunnguata-Sermia subcatchment, 58 ± 18 µmol L−1; Pain et al. Citation2021) or close to the atmospheric equilibrium (Russell glacier, 29 ± 4 µmol L−1; Pain et al. Citation2021). The meltwater of Kiattut Sermiat was also reported to be depleted in dCO2 (19 ± 2 µmol L−1; Pain et al. Citation2021) but apparently to a smaller degree than the measurements from the Yukon glaciers as this study suggested. Carbonate and silicate weathering reactions of freshly eroded sediments at the bed of glaciers can consume CO2 (St. Pierre et al. Citation2019). The Yukon glaciers cover predominantly carbonate bedrock, and the low concentrations of dCO2 in the meltwater are therefore attributed to CO2 consumption from carbonate dissolution and a slower dissolution of atmospheric CO2 in surface meltwater compared to consumption at the glacier bed.
Measured dCH4 and dCO2 concentrations at the glacier margin represent the net concentration. They are the result of the interaction of the combined sources and sinks with the meltwater in between the source area(s) and the point of contact with the atmosphere. Concentrations will presumably vary on diurnal and seasonal timescales in response to changes in surface meltwater inflow and the size and physical configuration of the subglacial drainage system (Burns et al. Citation2018; Christiansen and Jørgensen Citation2018; Christiansen et al. Citation2021; Pain et al. Citation2021), which are essential parameters for the calculation of the overall magnitude of CH4 and CO2 emissions. Therefore, the dCH4 and dCO2 concentrations measured in the meltwaters of Donjek, Kluane, and Dusty glaciers can only be considered snapshots in time and are not necessarily representative of diurnal and seasonal average concentrations.
The second aim of the study was to determine the possible sources of the CH4 based on the δ13C-CH4 and δ2H-CH4 values of dCH4 from the three studied glaciers. The dual isotopic signatures of dissolved CH4 are not conclusive as to whether the CH4 is produced only by microbial methanogenesis of a subglacial organic carbon source, because the isotopic signature values of CH4 of δ13C-CH4 and δ2H-CH4 are located in the proposed region of thermogenic CH4 or in the transition to acetoclastic methanogenesis (). CH4 from the subglacial meltwater of Dusty glacier might have originated from a different source or a combination of multiple sources and processes compared to Kluane and Donjek glaciers. The dCH4 from Kluane and Donjek glaciers was more depleted in 13C, indicating a dominance of acetoclastic methanogenesis as the source (), whereas the stable isotope values of CH4 from Dusty glacier were more enriched in 13C and in the same range as reported from the meltwater outlet of Sólheimajökull in Iceland (Burns et al. Citation2018), indicating a predominantly thermogenic source. The degree of 13C depletion in the dissolved CH4 is higher in the catchments with more sedimentary rocks. Though there may be a mechanistic link between bedrock geology and isotopic composition, we have too little data to discuss any links at this moment.
In recent studies (Burns et al. Citation2018; Lamarche-Gagnon et al. Citation2019; Pain et al. Citation2021), it has been argued that the oxidation of subglacial CH4, which shifts both δ13C-CH4 and δ2H-CH4 values toward more enriched values (see arrows in ), results in apparent isotopic signatures resembling a thermogenic origin, which has also been shown in other natural biogenic CH4-producing systems (Coleman, Risatti, and Schoell Citation1981; Wang, Welander, and Ono Citation2016). It is likely that the dissolved CH4 found in the meltwater from glaciers of this study could have been altered by methanotrophy in the more oxygen-rich part of subglacial meltwaters. This would imply that dCH4 under Dusty glacier was more oxidized than that from Donjek and Kluane glaciers based on the clear separation of the 13C-CH4 depletion (). However, CH4 can be potentially produced as a result of abrasion of especially carbon-rich sediments or rocks in the subglacial environment (Gill-Olivas et al. Citation2023). Because the bedrock under the studied glaciers, especially of Donjek and Kluane glaciers, is dominated by carbonate rocks, the resulting production of CH4 from abrasion could contribute to the dissolved CH4 in the meltwater. In addition, the studied glaciers are located in an active tectonic area where thermogenic formation, and subsequent evasion, of CH4 in subducted and warmed carbon containing sediments could happen near the surface. The isotopic signatures of these alternative CH4 sources as well as their impact on the isotopic signature of dCH4 in subglacial meltwater remain unknown. The results of isotopic analyses for the studied glaciers potentially could imply that CH4 from the subglacial meltwater of Dusty glacier originated from multiple sources which could also be the case for Kluane and Donjek glaciers.
Hence, the occurrence of multiple processes within the subglacial CH4 cycle complicates an unambiguous characterization of the CH4 source(s) only based on δ13C-CH4 and δ2H-CH4 values. Thus, future studies should address the extent of microbial methane oxidation in the subglacial meltwaters of the three investigated glaciers and include other geochemical abiotic and thermogenic CH4 contributions, such as the presence of C2 and C3 gases (Bernard, Brooks, and Sackett Citation1976) and clumped isotopes (Agmuas Adnew et al. Citation2023) for a more complete overview of processes influencing the CH4 cycle in these environments and the source of CH4.
The third aim of the study was to investigate how bedrock geology, glacier size, and surging history could be linked to concentrations of dCH4 in the meltwater. In contrast to the known sites of direct subglacial CH4 emissions in Greenland and Iceland (Burns et al. Citation2018; Christiansen and Jørgensen Citation2018; Christiansen et al. Citation2021; Pain et al. Citation2021), the studied glaciers in Yukon are different due to their sedimentary bedrock type and, hence, geochemical settings. Compared to other known subglacial CH4-emitting glaciers, the valley glaciers in the Yukon are among the largest in size. Further, they differ in their dynamic behavior due to their classification as surge-type glaciers.
The differences in the hydrochemical composition of the meltwater between the glaciers can be related to the timing of sampling, the amount of discharge, and the portion of surface melt of the total discharge. The pattern of increasing dCH4 concentrations measured over a 10-h period at Dusty glacier on 11 August coincided with similar trends for several of the dissolved elements (SO42−, Cl−, NO3−, S, Mg2+, K+, Na+, and Si). This indicates a similar meltwater control on the subglacial export of these elements (Table S2) but not necessarily a geochemical regulation of CH4 concentrations. A comparison to the hydrochemical composition of meltwater from other known CH4-emitting glaciers in Greenland that are underlain by metamorphic bedrock showed that Donjek, Kluane, and Dusty glaciers differ substantially in cation content, even with the consideration of enrichment post sampling, but were similar in dissolved anions (Figure S2). However, comparable dCH4 concentrations have been reported from glaciers covering sedimentary (Yukon) and metamorphic bedrock (Greenland), indicating that bedrock geology, as reflected in the geochemical composition of the meltwater, is no valuable indicator for the presence or concentration of dCH4. An exception to this seems to be the case for the seepage of thermogenic methane from groundwater springs in recently deglaciated forefields in Svalbard, where the highest concentrations coincided with the presence of shale bedrock (Kleber et al. Citation2023). For dCO2, it was observed in this study and for Kiattut Sermiat (Pain et al. Citation2021), which is also partly underlain by sedimentary rocks, that dCO2 concentrations were depleted. This could indicate that CO2-driven subglacial weathering of sedimentary rocks impacts dCO2 to a higher degree than dCH4. This study provides too few data points to establish whether the highly different dCH4 concentrations from Donjek, Kluane, and Dusty glaciers () relate to differences in bedrock geology. The apparent correlation of dCH4 concentrations and dissolved solutes could rather be a sign of a larger area of the glacier bed being flushed by meltwater, increasing solute and dCH4 concentrations simultaneously.
With areal extents of 448, 324, and 343 km2 (Consortium 2005) for Donjek, Kluane, and Dusty glaciers, respectively, the glaciers in the Yukon are among the largest of all known CH4-emitting glaciers. The smallest glacier with reported subglacial CH4 production is Kiattut Sermiat (36 km2; Hawkings et al. Citation2016; Pain et al. Citation2021), followed by the subcatchment of Isunnguata Sermia (40 km2; Lindbäck et al. Citation2015), Russell glacier (300 km2; Pain et al. Citation2021), and Leverett glacier (600 km2; Hawkings et al. Citation2016). Compared to Donjek, Kluane, and Dusty glaciers, sizes reported for the outlet glaciers of the Greenland Ice Sheet are all estimates of the subglacial catchment area. The areal extent or subglacial catchment area does not correlate with reported dCH4 concentrations (Figure S3). This indicates that areal or subglacial catchment extent alone does not explain the varying magnitudes of dCH4 concentrations between the glaciers, but differences in CH4 exports between glaciers will be better constrained by other factors; for example, the size of the subglacial area of anoxia, the ratio of subglacial versus surface melt of the discharge volumes, and the availability of organic matter and other nonbiogenic CH4 sources.
Different to the known subglacial CH4-emitting glaciers to date, the three studied glaciers in the Yukon are all classified as surge-type glaciers (Clarke and Holdsworth Citation2002; Kochtitzky et al. Citation2019; Young et al. Citation2022), raising the question of whether the magnitude of CH4 emissions could be influenced by glacier dynamics. The high abundance of surge-type glaciers is notable for the St. Elias Mountains, especially on the Canadian side (Clarke and Holdsworth Citation2002; Sevestre and Benn Citation2015). Out of 2,356 glaciers, about 6.4 percent show surge-type behavior (Clarke et al. Citation1986), the third highest accumulation after Svalbard and Pamir (Kochtitzky et al. Citation2019). In comparison, less than 1 percent of glaciers worldwide are classified as surging glaciers (Sevestre and Benn Citation2015). The studied Yukon glaciers follow highly different surge cycles. Donjek is the most active surge glacier of the three, followed by Kluane and Dusty glaciers (Clarke and Holdsworth Citation2002; Kochtitzky et al. Citation2019; Young et al. Citation2022). Interestingly, the surge frequency correlates with higher dCH4 concentrations measured, and our data provide the first observation to suggest a potential link between subglacial CH4 production and the dynamic behavior of glaciers. A hypothesis could be that the remobilization of subglacial sediment during a surge could establish contact between the subglacial anoxic environment and fresh organic material. Frequent surges could therefore provide a resupply of subglacial organic material sustaining subglacial CH4 production. Surging further increases abrasion at the glacier bed, providing nutrients and energy sources from crushed sedimentary rocks that could drive methanogenesis (Gill-Olivas et al. Citation2023). A change in the distribution of ice volume due to surging and the accompanying decrease in basal pressure on the underlying bedrock could further lead to a release of stored gases within the lithosphere along fractures and faults (Vachon et al. Citation2022; Kleber et al. Citation2023). Repeated measurements of dCH4 across a wider range of glacier types, surging and nonsurging, are needed to test this hypothesis.
Concluding remarks and perspectives
This study first investigates the presence of dissolved CH4 and CO2 in the subglacial meltwater of three outlet glaciers of the St. Elias Mountains in Yukon, Canada. We show that the subglacial meltwaters from three mountain glaciers, Donjek, Kluane, and Dusty glaciers, were sources of CH4 and sinks of atmospheric CO2.
dCH4 concentrations in discrete samples were 45, 135, and 250 times higher in the meltwater of Dusty, Kluane, and Donjek glaciers, respectively, compared to the atmospheric equilibrium and were comparable to concentrations reported from subglacial meltwater rivers in Greenland and Iceland. dCO2 concentrations were below the atmospheric equilibrium and lower than reported from other known subglacial CH4-emitting sites.
The stable carbon and hydrogen isotope values of CH4 from Kluane and Donjek glaciers were similar to values measured for Greenland glaciers, where δ13C-CH4 and δ2H-CH4 values of meltwater from Dusty glacier showed more 13C-enriched CH4. Thus, CH4 at Dusty glacier originated either from a different source, such as thermogenic or from a mixture of thermogenic and microbial CH4 when compared to Kluane and Donjek glaciers. Additionally, potentially occurring microbial methanotrophy might have led to an enrichment in the heavier isotopes. The ambiguous isotopic evidence of the origin of CH4 from the observed sites is not completely understood and demands further investigation in the future and measurements of excess C2 and C3 gases to better constrain sources and sinks of CH4.
Compared to the currently known sources of direct subglacial CH4 emissions in Greenland and Iceland, the studied glaciers in Yukon are different due to their sedimentary bedrock and hence geochemical settings as well as their classification as surge-type glaciers. No relation between dissolved ions in the meltwater, glacier size, and dCH4 concentrations could be established. However, the CO2 sink can be explained by carbonate dissolution. This finding indicates that bedrock geology may not be a determining factor of the presence of methanogenesis underneath glaciers; however, it might slightly influence the measured concentrations and isotopic values. Therefore, it is hypothesized that the residence time and the presence of anoxic unconsolidated sediments with available organic carbon substrates play the most critical role in determining whether CH4 is produced subglacially. More glaciers need to be included and preferably longer time series established to determine whether there is a link between bedrock geology, glacier size, and subglacial CH4 and CO2 production and/or consumption, and more subglacial CH4-emitting sites must be found to constrain the physical parameters required for subglacial CH4 production.
It remains unresolved whether the dynamic behavior of glaciers—for example, surging—could impact the methanogenic potential. In this study, Donjek glacier, the most active surge-type glacier, also shows the highest dissolved CH4 concentrations in the meltwater. However, only one measurement of dCH4 concentrations is not enough to answer this hypothesis. Further, more surge-type glaciers need to be investigated for elevated dCH4 concentrations in the meltwater and longer time series measured to answer whether surge-type glaciers offer favorable conditions for subglacial CH4 production and whether the surging frequency is positively linked to the presence and magnitude of direct CH4 emissions from subglacial meltwater.
The discovery of three alpine glaciers as subglacial CH4-emitting sites proposes that subglacial CH4 production might be a much more common phenomenon underneath the world’s ice masses than shown through empirical measurements so far. More long-term time series measurements of dCH4 and dCO2 are needed to assess whether the subglacial meltwater of outlet glaciers from the St. Elias Mountains is a net source or sink of GHGs to the atmosphere over a melt season and how much attention should be given to such alpine glaciers in the calculation of future carbon budgets.
Supplemental Material
Download Zip (1.7 MB)Acknowledgments
We thank the Kluane First Nations and Champagne & Aishihik First Nations for allowing us to conduct research on their land, the Kluane National Park and Reserve for issuing the research and collection permit (No. KLU-2022-42520) and the aircraft access permit (No. 22-RC-34), and the Kluane Lake Research Station and Capitol Helicopter for help with logistics. We thank Maja Holm Wahlgren from the laboratory of the Department of Geosciences and Natural Resource Management, University of Copenhagen, for help with gas analyses. We are thankful for the comments and suggestions of two anonymous reviewers that improved the article.
Disclosure statement
No potential conflict of interest was reported by the authors.
Supplementary material
Supplemental data for this article can be accessed online at https://doi.org/10.1080/15230430.2023.2284456.
Additional information
Funding
References
- Agmuas Adnew, G., M. Schroll, S. E. Sapper, T. Röckmann, M. E. Popa, C. Juncher Jørgensen, F. Keppler, C. van der Veen, M. Sivan, T. Blunier, and J.R. Christiansen, eds. 2023. Constraining sources and sinks of subglacial methane from the Greenland Ice Sheet using clumped isotopes. EGU general assembly conference abstracts.
- Bernard, B. B., J. M. Brooks, and W. M. Sackett. 1976. Natural gas seepage in the Gulf of Mexico. Earth and Planetary Science Letters 31, no. 1: 48–13. doi:10.1016/0012-821X(76)90095-9.
- Boyd, E. S., M. Skidmore, A. C. Mitchell, C. Bakermans, and J. W. Peters. 2010. Methanogenesis in subglacial sediments. Environmental Microbiology Reports 2, no. 5: 685–92. doi:10.1111/j.1758-2229.2010.00162.x.
- Burns, R., P. M. Wynn, P. Barker, N. McNamara, S. Oakley, N. Ostle, A. W. Stott, et al. 2018. Direct isotopic evidence of biogenic methane production and efflux from beneath a temperate glacier. Scientific Reports 8, no. 1: 17118. doi:10.1038/s41598-018-35253-2.
- Christiansen, J. R., and C. J. Jørgensen. 2018. First observation of direct methane emission to the atmosphere from the subglacial domain of the Greenland Ice Sheet. Scientific Reports 8, no. 1: 1–6. doi:10.1038/s41598-018-35054-7.
- Christiansen, J. R., T. Röckmann, M. E. Popa, C. J. Sapart, and C. J. Jørgensen. 2021. Carbon emissions from the edge of the Greenland Ice Sheet reveal subglacial processes of methane and carbon dioxide turnover. Journal of Geophysical Research: Biogeosciences 126, no. 11: e2021JG006308.
- Christner, B. C., G. G. Montross, and J. C. Priscu. 2012. Dissolved gases in frozen basal water from the NGRIP borehole: Implications for biogeochemical processes beneath the Greenland Ice Sheet. Polar Biology 35: 1735–41. doi:10.1007/s00300-012-1198-z.
- Clarke, G. K., and G. Holdsworth 2002. Glaciers of the St. Elias Mountains. US Geological Survey professional paper, (1386J).
- Clarke, G. K., J. P. Schmok, C. S. L. Ommanney, and S. G. Collins. 1986. Characteristics of surge‐type glaciers. Journal of Geophysical Research: Solid Earth 91, no. B7: 7165–80. doi:10.1029/JB091iB07p07165.
- Coleman, D. D., J. B. Risatti, and M. Schoell. 1981. Fractionation of carbon and hydrogen isotopes by methane-oxidizing bacteria. Geochimica et Cosmochimica Acta 45, no. 7: 1033–7. doi:10.1016/0016-7037(81)90129-0.
- Du, Z.-H., L. Wang, Z.-Q. Wei, J.-F. Liu, P.-L. Lin, J.-H. Lin, Y.-Z. Li, et al. 2022. CH4 and CO2 observations from a melting high mountain glacier, Laohugou Glacier No. 12. Advances in Climate Change Research 13, no. 1: 146–55. doi:10.1016/j.accre.2021.11.007.
- Gill-Olivas, B., J. Telling, M. Skidmore, and M. Tranter. 2023. Abrasion of sedimentary rocks as a source of hydrogen peroxide and nutrients to subglacial ecosystems. Biogeosciences 20, no. 5: 929–43. doi:10.5194/bg-20-929-2023.
- GLIMS Consortium. 2005. GLIMS glacier database, version 1. Boulder, Colorado, USA: NASA National Snow and Ice Data Center Distributed Active Archive Center.
- Greule, M., S. G. Huber, and F. Keppler. 2012. Stable hydrogen-isotope analysis of methyl chloride emitted from heated halophytic plants. Atmospheric Environment 62: 584–92. doi:10.1016/j.atmosenv.2012.09.007.
- Hawkings, J., J. Wadham, M. Tranter, J. Telling, E. Bagshaw, A. Beaton, S.-L. Simmons, et al. 2016. The Greenland Ice Sheet as a hot spot of phosphorus weathering and export in the Arctic. Global Biogeochemical Cycles 30, no. 2: 191–210. doi:10.1002/2015GB005237.
- Johnson, P. 1995. Ice‐dammed lake history, Dusty Glacier, St. Elias Mountains, Yukon. Canadian Geographer/Le Géographe Canadien 39, no. 3: 262–73. doi:10.1111/j.1541-0064.1995.tb00417.x.
- Kleber, G. E., A. J. Hodson, L. Magerl, E. S. Mannerfelt, H. J. Bradbury, Y. Zhu, M. Trimmer, et al. 2023. Groundwater springs formed during glacial retreat are a large source of methane in the high Arctic. Nature Geoscience 16, no. 7: 597–604. doi:10.1038/s41561-023-01210-6.
- Kochtitzky, W., H. Jiskoot, L. Copland, E. Enderlin, R. McNabb, K. Kreutz, B. Main, et al. 2019. Terminus advance, kinematics and mass redistribution during eight surges of Donjek Glacier, St. Elias Range, Canada, 1935 to 2016. Journal of Glaciology 65, no. 252: 565–79. doi:10.1017/jog.2019.34.
- Konya, K., G. Iwahana, T. Sueyoshi, T. Morishita, and T. Abe. 2022. Methane flux around the Gulkana Glacier terminus, Alaska summer 2019. Polar Data Journal 6: 32–42. doi:10.20575/00000040.
- Lamarche-Gagnon, G., J. L. Wadham, B. Sherwood Lollar, S. Arndt, P. Fietzek, A. D. Beaton, A. J. Tedstone, et al. 2019. Greenland melt drives continuous export of methane from the ice-sheet bed. Nature 565, no. 7737: 73–7. doi:10.1038/s41586-018-0800-0.
- Lindbäck, K., R. Pettersson, A. L. Hubbard, S. H. Doyle, D. van As, A. B. Mikkelsen, A. A. Fitzpatrick, et al. 2015. Subglacial water drainage, storage, and piracy beneath the Greenland Ice Sheet. Geophysical Research Letters 42, no. 18: 7606–14. doi:10.1002/2015GL065393.
- Main, B., L. Copland, S. V. Samsonov, C. F. Dow, G. E. Flowers, E. Young, W.H. Kochtitzky eds. 2019. Surge of Little Kluane Glacier in the St. Elias Mountains, Yukon, Canada, from 2017-2018. AGU Fall Meeting Abstracts.
- Michaud, A. B., J. E. Dore, A. M. Achberger, B. C. Christner, A. C. Mitchell, M. L. Skidmore, T. J. Vick-Majors, et al. 2017. Microbial oxidation as a methane sink beneath the West Antarctic Ice Sheet. Nature Geoscience 10, no. 8: 582–6. doi:10.1038/ngeo2992.
- Millan, R., J. Mouginot, A. Rabatel, and M. Morlighem. 2022. Ice velocity and thickness of the world’s glaciers. Nature Geoscience 15, no. 2: 124–9. doi:10.1038/s41561-021-00885-z.
- Murray, T., T. Strozzi, A. Luckman, H. Jiskoot, and P. Christakos. 2003. Is there a single surge mechanism? Contrasts in dynamics between glacier surges in Svalbard and other regions. Journal of Geophysical Research: Solid Earth 108, no. B5. doi:10.1029/2002JB001906.
- National Centers for Environmental Information. 2022. ETOPO 2022 15 arc-second global relief model.
- Pain, A. J., J. B. Martin, E. E. Martin, Å. K. Rennermalm, and S. Rahman. 2021. Heterogeneous CO2 and CH4 content of glacial meltwater from the Greenland Ice Sheet and implications for subglacial carbon processes. The Cryosphere 15, no. 3: 1627–44. doi:10.5194/tc-15-1627-2021.
- Paul, D., G. Skrzypek, and I. Fórizs. 2007. Normalization of measured stable isotopic compositions to isotope reference scales–a review. Rapid Communications in Mass Spectrometry: An International Journal Devoted to the Rapid Dissemination of Up‐to‐the‐Minute Research in Mass Spectrometry 21, no. 18: 3006–14. doi:10.1002/rcm.3185.
- Portnov, A., S. Vadakkepuliyambatta, J. Mienert, and A. Hubbard. 2016. Ice-sheet-driven methane storage and release in the Arctic. Nature Communications 7, no. 1: 10314. doi:10.1038/ncomms10314.
- Rounds, S. A. 2012. Alkalinity and acid neutralizing capacity (ver. 4.0, September 2012). U.S. Geological Survey Techniques of Water-Resources Investigations, 09-A6.6. doi:10.3133/twri09A6.6.
- Samsonov, S., K. Tiampo, and R. Cassotto. 2021. Measuring the state and temporal evolution of glaciers in Alaska and Yukon using synthetic-aperture-radar-derived (SAR-derived) 3D time series of glacier surface flow. The Cryosphere 15, no. 9: 4221–39. doi:10.5194/tc-15-4221-2021.
- Sevestre, H., and D. I. Benn. 2015. Climatic and geometric controls on the global distribution of surge-type glaciers: Implications for a unifying model of surging. Journal of Glaciology 61, no. 228: 646–62. doi:10.3189/2015JoG14J136.
- Skidmore, M. L., J. M. Foght, and M. J. Sharp. 2000. Microbial life beneath a high Arctic glacier. Applied and Environmental Microbiology 66, no. 8: 3214–20. doi:10.1128/AEM.66.8.3214-3220.2000.
- Slatt, R. M. 1972. Geochemistry of meltwater streams from nine Alaskan glaciers. Geological Society of America Bulletin 83, no. 4: 1125–32. doi:10.1130/0016-7606(1972)83[1125:GOMSFN]2.0.CO;2.
- Stibal, M., J. L. Wadham, G. P. Lis, J. Telling, R. D. Pancost, A. Dubnick, M. J. Sharp, et al. 2012. Methanogenic potential of Arctic and Antarctic subglacial environments with contrasting organic carbon sources. Global Change Biology 18, no. 11: 3332–45. doi:10.1111/j.1365-2486.2012.02763.x.
- St. Pierre, K. A., V. L. St. Louis, S. L. Schiff, I. Lehnherr, P. G. Dainard, A. S. Gardner, P. J. K. Aukes, et al. 2019. Proglacial freshwaters are significant and previously unrecognized sinks of atmospheric CO2. Proceedings of the National Academy of Sciences 116, no. 36: 17690–5. doi:10.1073/pnas.1904241116.
- Vachon, R., P. Schmidt, B. Lund, A. Plaza‐Faverola, H. Patton, and A. Hubbard. 2022. Glacially induced stress across the Arctic from the Eemian Interglacial to the present—Implications for faulting and methane seepage. Journal of Geophysical Research: Solid Earth 127, no. 7: e2022JB024272.
- Wadham, J. L., S. Arndt, S. Tulaczyk, M. Stibal, M. Tranter, J. Telling, G. P. Lis, et al. 2012. Potential methane reservoirs beneath Antarctica. Nature 488, no. 7413: 633–7. doi:10.1038/nature11374.
- Wadham, J. L., J. R. Hawkings, L. Tarasov, L. J. Gregoire, R. G. M. Spencer, M. Gutjahr, A. Ridgwell, et al. 2019. Ice sheets matter for the global carbon cycle. Nature Communications 10, no. 1: 3567. doi:10.1038/s41467-019-11394-4.
- Wadham, J. L., M. Tranter, S. Tulaczyk, and M. Sharp. 2008. Subglacial methanogenesis: A potential climatic amplifier? Global Biogeochemical Cycles 22, no. 2. doi:10.1029/2007GB002951.
- Wang, D. T., P. V. Welander, and S. Ono. 2016. Fractionation of the methane isotopologues 13CH4, 12CH3D, and 13CH3D during aerobic oxidation of methane by Methylococcus capsulatus (Bath). Geochimica et Cosmochimica Acta 192: 186–202. doi:10.1016/j.gca.2016.07.031.
- Weiss, R. F. 1974. Carbon dioxide in water and seawater: The solubility of a non-ideal gas. Marine Chemistry 2, no. 3: 203–15. doi:10.1016/0304-4203(74)90015-2.
- Whiticar, M. J. 1999. Carbon and hydrogen isotope systematics of bacterial formation and oxidation of methane. Chemical Geology 161, no. 1–3: 291–314. doi:10.1016/S0009-2541(99)00092-3.
- Young, E. M., G. E. Flowers, H. Jiskoot, and H. D. Gibson. 2022. Kinematic evolution of kilometre-scale fold trains in surge-type glaciers explored with a numerical model. Journal of Structural Geology 161: 104644. doi:10.1016/j.jsg.2022.104644.
- Yukon Geological Survey. 2020. A digital atlas of terranes for the northern Cordillera. http://www.geology.gov.yk.ca/.
- Yukon Geological Survey. 2022. Yukon digital bedrock geology. https://data.geology.gov.yk.ca/Compilation/3