
 ?Mathematical formulae have been encoded as MathML and are displayed in this HTML version using MathJax in order to improve their display. Uncheck the box to turn MathJax off. This feature requires Javascript. Click on a formula to zoom.
ABSTRACT
The increase in deciduous shrub growth in response to climate change throughout the Arctic tundra has uncertain implications, in part due to a lack of field observations. Here we investigate how increasing alder shrub growth in alpine tundra in Interior Alaska corresponds to active layer thickness and soil physical properties. We documented increased alder growth by combining biomass harvests and dendrochronology with the analysis of remotely sensed Normalized Difference Vegetation Index and fire history. Active layer thickness was measured with a tile probe and carbon and nitrogen pools were assessed via elemental analysis. Shallower organic layers under increasing alder growth indicate that nitrogen-rich, deciduous litter inputs may play a role in accelerating decomposition. Despite the observed reduction in organic carbon stocks, active layer thickness was the same under alder and adjacent graminoid tundra, implying deeper thaw of the underlying mineral soil. This study provides further evidence that the widely observed expansion of deciduous shrubs into graminoid tundra will reduce ecosystem carbon stocks and intensify soil–atmosphere thermal coupling.
PLA IN LANGUAGE SUMMARY
Two consequences of rapid climate warming in the Arctic, where grass-like plants dominate under very cold conditions, are an increased growth and occurrence of shrubs and associated thaw of frozen ground. This exposes organic matter in soils to microbes that can decompose it into carbonaceous greenhouse gases, but some of this carbon loss may be offset by the increased plant growth. Here, we investigate the impacts of greater shrub presence on soil properties at five sites in Alaska. We documented shrub growth by analyzing satellite images, which can help us understand the productivity and/or leaf coverage at each site back in time, and annual growth rings in shrub stems, which show how old the shrubs are and how much they grow each year. We also measured the depth of soil thaw in the field and its organic matter content in a laboratory. Where shrubs were more common, we found a thinner layer of organic matter at the soil surface. Thaw depth remained the same, which may indicate that the presence of shrubs results in deeper thaw of the mineral soil. Our findings support the hypothesis that shrub expansion will further enhance warming-driven increases of greenhouse gas emissions from Arctic landscapes.
KEY POINTS
Trends in dendrochronology and Normalized Difference Vegetation Index reveal increasing growth of alder shrubs in Interior Alaska.
More alder cover results in the loss of the soil organic layer and thus soil C and N that is not offset by more shrub biomass.
Increasing alder growth may promote permafrost thaw not captured by tile probe active layer thickness monitoring.
Introduction
Deciduous shrubs have become more abundant across the Arctic (Sturm et al. Citation2001; Tape, Sturm, and Racine Citation2006; Elmendorf et al. Citation2012; Frost and Epstein Citation2014; Shevtsova et al. Citation2020), manifesting in greater shrub height, infilling of open shrub patches, and shrubline advance (Myers-Smith et al. Citation2011). The causes of this shrub expansion (“shrubification”) are complex (Martin et al. Citation2017) but include warming (Tape et al. Citation2012), increased soil moisture (Jespersen et al. Citation2018; Chen, Hu, and Lara Citation2021), greater availability of nutrients (Vankoughnett and Grogan Citation2016), and changes in disturbance frequency (Racine et al. Citation2004; Frost et al. Citation2013; Pearson et al. Citation2013; Plante et al. Citation2014; Andruko, Danby, and Grogan Citation2020; Huebner, Buchwal, and Bret-Harte Citation2022; Liu et al. Citation2022). Though shrubification has been widely documented, the ramifications of increased shrub growth on ecosystem processes remain less clear (Chapin et al. Citation2005; Mekonnen et al. Citation2021). Specifically, vegetation cover and type are known to impact net radiation and surface energy exchange (Jorgenson et al. Citation2010; Loranty et al. Citation2018), raising the possibility that large-scale shrubification may trigger important changes in permafrost distribution across the Arctic and the large amounts of organic carbon (C) contained within it (Miner et al. Citation2022).
Shrubification is generally expected to promote deepening of the active layer—the layer of soil above permafrost which seasonally thaws—ultimately resulting in soil carbon loss due to greater microbial activity, especially during the cold season (Sturm et al. Citation2005; Kropp et al. Citation2020; Way and Lapalme Citation2021). Tall shrubs trap snow in winter, which insulates soils from subfreezing air temperatures, and also protrude from the snow surface during spring, which lowers surface albedo and accelerates snow melt (Lawrence and Swenson Citation2011; Vankoughnett and Grogan Citation2016; Jafarov et al. Citation2018; Wilcox et al. Citation2019). However, cold season shrub–snow interactions may change with climate warming if more frequent snowmelt events occur in autumn, because the resulting ice layers can decrease winter snow drifting and facilitate soil cooling (Barrere et al. Citation2018). Growing season processes further complicate the picture, because greater evapotranspiration and shading from tall shrubs may lead to cooler and drier soils (Nauta et al. Citation2015; Vankoughnett and Grogan Citation2016). Shrub-induced soil drying may even lead to cooler soil temperatures year-round (Göckede et al. Citation2017); however, the long-term implications of shrubification and surface hydrology on permafrost remain uncertain (Loranty et al. Citation2018; Heijmans et al. Citation2022). Manipulation experiments have found evidence of increased soil temperatures caused by shrub presence (Aguirre, Benhumea, and McLaren Citation2021) but also by shrub removal (Blok et al. Citation2010), resulting in opposite effects on nutrient cycling and active layer thickness (ALT). Thus, it remains unclear what role increased shrub growth in situ plays in modulating soil physical properties.
Adding to the complexity of assessing the consequences of Arctic shrubification are species effects, which cannot be evaluated at the current resolution of satellite imagery. Shrubification primarily involves three different shrubs, alder (Alnus spp.), birch (Betula spp.), and willow (Salix spp.; Tape, Sturm, and Racine Citation2006). These genera differ in their tissue chemistry (i.e., nitrogen [N] and tannin content; Christie et al. Citation2015) as well as their C allocation strategy (Vankoughnett and Grogan Citation2016; Lynch et al. Citation2018; Street et al. Citation2018), both of which impact shrubs’ competitive abilities, herbivore interactions (Olofsson et al. Citation2009; Cahoon et al. Citation2012; Christie et al. Citation2015), and effects on soil properties. Alder, which has N2-fixing symbionts, is expanding across parts of Alaska (Tape, Sturm, and Racine Citation2006). Alder presence increases accumulation and bioavailability of N in soil (Hart, Binkley, and Perry Citation1997; Rhoades et al. Citation2001), and a recent study showed that alder stands mediate local diversity by encouraging growth of birch and evergreen shrubs and limiting understory tundra species (Wallace and Baltzer Citation2020). However, additional field studies are needed to explore the relative effects of alder on permafrost soil properties.
Despite the ubiquity of Arctic shrubification and uncertainty surrounding its ecosystem consequences, few field studies have quantified the implications of increased shrub growth on ecosystem and soil C sequestration (Mekonnen et al. Citation2021). Some have proposed that shrubification has the potential to offset part of the C emissions associated with permafrost thaw. For instance, one modeling study predicted that a shift from graminoid and nonvascular vegetation to woody vegetation in North America under the RCP8.5 scenario would result in additional C sequestration during the twenty-first century because the greater productivity of shrubs, lower decomposition rates of shrub litter, and shading of the soil surface during the growing season compensated for warming-driven increases in heterotrophic respiration (Mekonnen et al. Citation2018). For temperate soils, chronosequence studies found that woody encroachment into grasslands resulted in net ecosystem C gains in drier regions but C losses in wetter regions (Jackson et al. Citation2002). An analogous assessment of soil C stocks in the circumpolar permafrost region is particularly challenging because differences in microtopography (and associated differences in net radiation, energy partitioning, and surface hydrology) and buried horizons (formed under previous vegetation types and with legacy C) often inhibit direct comparison of nearby soils under graminoid and shrub tundra.
In recent decades, remote sensing has greatly advanced our understanding of large-scale vegetation change patterns (Myers-Smith et al. Citation2020). However, it remains limited in its efficacy in detecting soil properties (Odebiri, Odindi, and Mutanga Citation2021). Therefore, combining high-resolution remote sensing data sets with ground observations is critical to understanding the implications of vegetation change in Arctic landscapes. Here we combine surveys of alder shrub biomass and soil properties with dendrochronology and satellite observations of plant productivity and fire history at five subarctic alpine graminoid tundra field sites in Interior Alaska. This hybrid experimental approach, which combines retrospective remote sensing observations with in situ field observations, offers opportunities to overcome the limitations imposed by pure remote sensing observations. We sought to target belowground and aboveground measurements at sites that were actively responding to drivers associated with vegetation change in the tundra. We asked: What are the implications of increasing alder biomass and/or cover for surface soil properties and active layer thickness?
Materials and Methods
Site description
Shrub biomass data and soil samples were collected at five alpine tundra sites in Interior Alaska along the James W. Dalton Highway (Alaska Route 11), between milepost (MP) 95 and 240, in August 2019 (), where vegetation is a mosaic of boreal forest, wetlands, and (at higher elevation) alpine tundra.
Table 1. Overview of study sites in Interior Alaska, average (standard deviation), n = 21/site.
Sites were selected based on geomorphology, vegetation type (alpine tundra; i.e., absence of trees) and abundance of alder shrubs while also trying to minimize differences (a) in topography between areas with more or less alder at each site and (b) in tundra community composition, aspect, and parent material between sites. Sites 1 to 3 were located within about 20 km of Finger Mountain (MP 98), where granite tors represent remnants of bedrock hills that formed from a Cretaceous pluton and remained unglaciated during the last ice age (D. A. Walker et al. Citation2009). Site 4 was located near Connection Rock (MP 121) and site 5 in the southern foothills of the Brooks Range (MP 237).
At each site, we established three parallel 30-m transects incorporating areas of higher and lower shrub abundance (). Transects were separated by 10 m. Every 5 m along each transect, we recorded the Global Positioning System location and elevation (etrex 10, Garmin) and thaw depth (cm) using a tile probe (Mackay Citation1977) and quantified alder biomass using a sampling plot (see section “Vegetation surveys and alder biomass and growth history”). Because measurements were conducted at the end of the growing season (22–28 August 2019), we assume that our thaw depth measurements represent the ALT at each site in 2019. Thickening active layers can be indicative of vertical degradation of permafrost following some disturbance (e.g., climate change, fire, vegetation change), depending on how the permafrost formed (Shur and Jorgenson Citation2007). We interpreted ALT as a permafrost stability proxy in the field, assuming the presence/absence of alder in the gradient transect design the main predictor variable. In addition, alder cover was estimated across 10-m intervals of each transect, and alder disks and soil samples (O horizons) were collected to further assess vegetation history and soil properties, respectively (see sections “Vegetation surveys and alder biomass and growth history” and “Soil collection and analysis”).
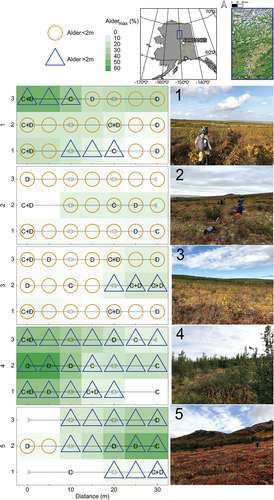
Figure 1. Map and photographs of alpine tundra with varying degree of alder abundance. “C” and “D” denote locations where soil cores and alder disks were sampled, respectively. Horizontal gray bars with arrow caps indicate 10-m intervals across which vegetation cover was estimated. All sites with alder >2 m tall also contained shorter alders. Sites 1 and 3 were affected by the Dall City Fire (2004) and site 4 was affected by the North Bonanza Fire (2005). ABoVE standard Alber’s equal area projection. Source: U.S. Census Bureau TIGER geographic database (U.S. Census Bureau Citation2022).
Vegetation surveys and alder biomass and growth history
Vegetation cover and composition were determined for each transect along 10-m intervals (three per transect, nine per site). For each transect, these data are reported at the 0-, 10-, 20-, and 30-m points, whereby the two cover estimates for the 10- and 20-m points were averaged. Using three levels (upper canopy, >2 m; lower canopy, ≤2 m; and ground) and a transect width of 0.5 m, we quantified the relative cover of alder (Alnus viridis (Chaix) DC.) and other tall shrub or tree species and of ground cover, separated into dwarf shrub, graminoid, moss, lichen, and bare soil. Additionally, we estimated the maximum alder coverage (Aldermax) at each location as the greater proportional alder coverage of the upper and lower canopy. Where two surveys overlapped, the Aldermax value was averaged.
Alder biomass was quantified by recording the number of alder stems within a 0.5 m × 0.5 m plot location every 5 m along each transect (twenty-one per site) and measuring the basal diameter of each stem using calipers. We also harvested five two six representative stems (including foliage) at sites 2 to 4 and measured their basal diameter. These samples were oven-dried to constant mass and weighed.
We used an allometric fit for the harvested alder stems that was used to predict alder biomass for all plot locations (EquationEquation (1)(1)
(1) ). Previous studies have found that the basal diameter of tall-stature shrubs is an accurate predictor of aboveground biomass (Berner et al. Citation2015), but few studies have analyzed this relationship for shrubs growing on permafrost. The fit was calculated as a nonlinear least squares regression using the stats package in R (R Core Team Citation2021) as in Berner et al. (Citation2015):
where AGBmodel is the estimated aboveground dry alder biomass (including leaves, cones, and woody material) per stem, BD is the measured basal diameter of each stem, and a and b are coefficients of the regression representing linear and nonlinear factors, respectively. To correct for nonrandom residuals (such as overprediction of small BD shrubs) we weighted the regression by AGBmodel−1. We determined model error predictions from a Monte Carlo simulation of confidence intervals (R predictNLS v1.0–4), which constructs more realistic estimates of nonlinear models than Taylor expansion. We found that the best-fit allometric equation to relate BD to AGBmodel had coefficients of a = 10.24 and b = 2.994 (R2 = 0.95, n = 16, 1σ = 4.6 g stem−1), which falls within one standard error of previously published coefficient estimates from boreal Alaska for the same species (Berner et al. Citation2015).
To establish the growth history of alder at our sites, basal stem disks were collected from multiple individuals in each transect (n = 40 total, ). We collected a disk of the alder with the largest basal diameter (five to eleven per site) within the transects at all sites and an additional two to six disks of large alders outside the transects at sites 2 to 5. Although study designs which sample selectively based on growth can impart biases to dendrochronological data sets (Nehrbass-Ahles et al. Citation2014), our approach provides an estimate of the timing of alder establishment (maximum age) and growth history at each site.
Disks were air-dried, sanded to 1,500 grit, and measured with a sliding bench micrometer. Shrubs ranged in age from 2 to 81 years, with a mean age of 21.8 years. Ring-width series were examined for dating errors in COFECHA (Holmes Citation1983). Age-related growth effects were removed from the shrub ring chronologies by detrending with age-based regional curve standardization. Signal-free chronologies were then produced using repeated divisions of the raw ring widths by the chronology indices (ten iterations). Regional curve standardization detrending and signal-free chronology development were performed in CRUST (Melvin and Briffa Citation2014) both at the site level and using a composite data set of all sampled shrubs.
Trends in NDVI
To evaluate productivity and fire history at each site, images from Collection 1 (Tiers 1 and 2), Landsat 5, 7, and 8 were extracted for Julian days 152 to 243 of years 2000 to 2020 using the Google Earth Engine Python API (van Rossum and Drake Citation2009; Gorelick et al. Citation2017; Berner et al. Citation2020) after field sampling. The study period 2000 to 2020 was chosen due to the limited number of Landsat observations in Alaska before 2000. Images were extracted using the central geographic location for each site with a 50-m circular buffer. These included images with WRS paths 71 to 74 and rows 12 to 14. Images were filtered for clouds, snow, water, band saturation, and geometric uncertainty following Berner et al. (Citation2020). Additionally, land cover classification was analyzed within a 50-m circular buffer around the central geographical coordinate of each site using the ABoVE Landsat-derived Annual Land Cover Across ABoVE Core Domain, 1984–2014 (Wang et al. Citation2019).
Landsat Normalized Difference Vegetation Index (NDVI) was calculated for each image using the red and infrared bands from each sensor (bands 3 and 4 for Landsat 5 and 7; bands 4 and 5 for Landsat 8). NDVImax was taken as the maximum observation per year per site. We note that NDVImax is sensitive to the number of quality images in a summer, because the likelihood that true peak greenness was measured increases as the number of observations increases. The difference between phenologically corrected NDVImax and Landsat-measured NDVImax has been shown to be insignificant when at least seven observations are available for a particular site and year (Berner et al. Citation2020). At least seven observations were available for all sites and years except for site 2 in 2012 (n = 6) and for site 4 in 2003 (n = 5) and 2006 (n = 4). No quality images were available in 2003 for sites 1 or 2.
Trends in NDVImax over time were analyzed for significance using the Mann-Kendall trend test and Theil-Sen slope using the zyp package (Bronaugh & Consortium, Citation2019) in R (R Core Team Citation2023), which accounts for autocorrelation in temporal data using Yue et al.’s method (Yue, Pilon, and Cavadias Citation2002). Similar methods for detecting NDVI trends have been used for Arctic and boreal sites (Berner et al. Citation2013, Citation2020; Guay et al. Citation2014). Wildfires that may have affected study sites in the time period 2000 to 2020 were explored using the MODIS burned area product (MCD64A1, monthly, 500 m) with a 3 km × 3 km buffer (Giglio et al. Citation2018). Major fires were identified using the Alaska Wildland Fire Information Map Series from the U.S. Bureau of Land Management (Alaska Fire Service (AFS) Alaska Wildland Fire Information Map Series Citationn.d.).
Soil collection and analysis
To assess the relationship among alder biomass, cover, and the properties of the soil organic layer, a total of twenty-eight soil cores (three to eight per site, ) were collected with an electric auger with a scalloped edge and an inner diameter of 2.54 cm (Nalder and Wein Citation1998) from the surface (dead moss or other O horizon) to a depth of 6 to 36 cm below the surface, determined by the distance to frozen or saturated ground, saprolite, or auger length. Thus, only complete organic layers are analyzed here. Sampling locations were chosen to capture end members of alder abundance and a representative range between. Cores were stored intact in capped plastic liners and frozen (−20°C) within 24 hours until analysis. Frozen soils were sectioned by horizon, oven-dried, and homogenized to <40 μm diameter or ground to powder, respectively. Aliquots (1–6 mg of organic and 8–25 mg of mineral soil) were weighed into tin capsules (5 mm × 9 mm) and analyzed for their total C and N content with an elemental analyzer. Percent C was used to determine whether soil horizons had been correctly classified as organic (≥20 percent C) or mineral (<20 percent). The total amount of C or N in each complete organic layer was calculated using bulk density, depth, and elemental data.
Statistical methods
To examine the influence of variable state factors and burn history on response variables (C and N stocks, organic layer thickness, ALT), Welch’s two-sample t tests were performed on soil measurements with <10 percent Aldermax coverage using the stats package in R (R Core Team Citation2023). Because burn sites (1, 3, and 4) burned around the same time (2005 and 2006), burn history was treated as binary (yes or no). t Tests failed to reject the null hypothesis that the mean response variable was not significantly different according to parent material, aspect, or burn history. We therefore proceed with analysis assuming that these variables do not significantly alter relationships among alder and response variables.
To examine the relationship between alder (biomass and coverage) and response variables, linear mixed effect (LME) models were created using the lme4 package in R (Bates et al. Citation2015; R Core Team Citation2023). All response variables but ALT were square root transformed prior to regression analysis to meet the assumption of normality (square root transformation was chosen to account for zero values). Independence of residuals was examined using the Durbin-Watson test for autocorrelated errors, normal distribution of residuals was examined using the Shapiro-Wilks test, and homoskedasticity was examined using the score test for nonconstant error variance using the car and stats packages in R (Fox and Weisberg Citation2019; R Core Team Citation2023). Models of the relationship between ALT and alder biomass or cover did not meet assumptions. LME models were chosen to account for the random variance created by site and transect in the study design. Models that treated both site and transect (as well as site and transect independently) as random effect intercepts were considered. The best fit of those models was chosen using Akaike’s information criterion (Bolker Citation2022); in all cases, models that treated only site as a random effect were chosen.
Results and Discussion
Alder growth history
Our results suggest that alder biomass and cover increased in recent decades at our alpine tundra sites, though with varying disturbance histories. Alder was consistently the dominant tall deciduous shrub species at all sites (aspen, birch, and willow accounted for <5 percent), and its growth chronologies suggest an increase in growth in the past four decades (). Among alder individuals sampled, which were the largest individuals per site, age varied by a factor of 3.7 across sites, ranging from a mean age of nine years at site 1 to thirty-four years at site 2; 43 percent of sampled stems established before 2000, and 53 percent established between 2000 and 2010. The cross-site growth chronology showed steadily increasing annual alder growth from the mid-1970s to about 2010, such that average radial growth post-2010 was approximately double the norms from the late 1970s. Site-specific growth chronologies displayed variable trends, with sites 2, 3, and 4 showing increasing recent growth and sites 1 and 5 displaying neutral or negative trends, but generally lacked sufficient within-site replication for reliable trend analysis (only one site generated a chronology with expressed population signal >0.85). Previous population studies of A. viridis report variable stand age structure (Lantz, Gergel, and Henry Citation2010), with one recent study reporting the mean age of a stand on Alaska’s North Slope to be 77 ± 15 years (Drew et al. Citation2023). Together, the low average age and increasing growth of large alder shrubs at these study sites point toward recent response to change, which may include recovery from fire disturbance and/or response to more favorable climatic conditions.
Figure 2. Records of (a) alder ring width index (1937–2018) and (b) maximum yearly NDVI (2000–2020) at five alpine tundra sites. Vertical bands indicate the following burn events and the sites that they affected: Dall City Fire of 2004 (sites 1 and 3) and North Bonanza Fire of 2005 (site 4), verified by MODIS MCD64A1. Black lines show intersite local regressions (span = 0.3), weighted by sample size in (a); gray band shows standard error.
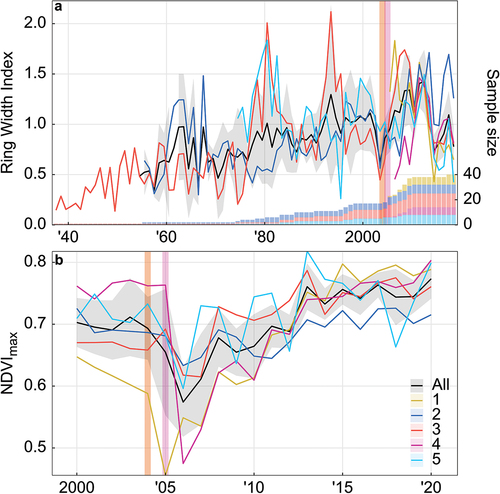
NDVImax was obtained from Landsat for the entirety of each study site as a metric for site productivity through time and disturbance history, because Landsat resolution is too coarse to capture the fine-scale vegetation gradient targeted for field sampling. Though there was a significantly positive trend in average NDVImax for all sites over the period 2000 to 2020 (tau = 0.495, Theil-Sen slope = 0.0044, p = .003; ), this trend was stronger among the burned sites (1, 3, and 4) than the unburned sites.
Time series of NDVImax support an increase in shrub cover and/or productivity at all sites, though evidence suggests variable site history. NDVI is known to be linked to leaf area index in both shrubland and graminoid tundra ecosystems (Gamon et al. Citation1995; Filella et al. Citation2004; Riedel, Epstein, and Walker Citation2005). Though NDVI is also known to be linked to biomass (Boelman et al. Citation2003), this correlation may be weakened in shrublands due to the abundance of woody biomass (Gamon et al. Citation1995; Cunliffe et al. Citation2020); NDVI at other phenological points (e.g., NDVI pre leaf out) may be better for estimating total aboveground biomass (Boelman et al. Citation2011). The mean NDVImax for all sites between 2000 and 2020 ranged from 0.6 ± 0.06 to 0.8 ± 0.04 (mean ± SD).This range, along with the positive trend observed over two decades, is consistent with shrubland tundra summer NDVI with high shrub cover (Beck and Goetz Citation2011), suggesting that an increase in shrub cover is the main driver of this trend, rather than an increase in productivity of graminoid species. However, the fire response evident at sites 1, 3, and 4 is consistent with those previously observed in boreal forest succession (Beck and Goetz Citation2011). Specifically, the NDVImax recovered and then exceeded prefire levels, likely due to increased deciduous recruitment (Johnstone et al. Citation2010; Beck and Goetz Citation2011; Beck et al. Citation2011), though this postfire recruitment may be linked to prefire deciduous species density (Johnstone et al. Citation2004). Though site selection targeted alpine tundra using vegetation characteristics described for the area (Hewitt et al. Citation2017), it seems possible that especially those sites at which alder growth was not observed prior to burn (sites 1 and 4) are in successional stages. However, analysis of percentage landcover classification for each burned site suggests that these sites were not classified as forest prior to burn (Wang et al. Citation2019). In 1984 (earliest year of data availability), site 1 was classified as 100 percent herbaceous; site 3 was 63 percent tussock tundra, 25 percent low shrub, and 13 percent herbaceous; and site 4 was 83 percent low shrub, 33 percent tall shrub, and 17 percent tussock tundra. Nevertheless, though more extensive studies would be needed to precisely determine the drivers of shrub growth at these study sites, our observations and data support the assumption that alder biomass and cover are increasing adjacent to alpine tundra.
Alder biomass and cover impacts on soils
The site random effect accounted for very little of the variance explained by the total models, which is clear in the R2 values (method described in Nakagawa and Schielzeth Citation2013) shown in (Bartoń Citation2023). Only in the case of organic thickness as a function of aboveground biomass did site explain any notable variance (0.0146 random effect and 0.8392 residual). Thus, the marginal fit (which considers fixed effects—i.e., the predictor variable—but not random effects; i.e., site) is shown in .
Figure 3. Relationships between modeled alder aboveground biomass (AGBmodel) or maximum alder cover (Aldermax) in alpine tundra and square root transformed organic layer (a), (b) thickness, (c), (d) C stock, (e), (f) N stock, or (g), (h) ALT. Soil response variables (organic layer thickness, C stock, N stock) are square root transformed. The marginal fit taken from LME models is shown in (a) to (f). Marginal R2 (R2 m) and conditional R2 (R2 c) are shown in inset plots. Ninety-five percent confidence interval bands were estimated by nonparametric bootstrapping (Bates et al. Citation2015; Wickham Citation2016; Bartoń Citation2023; R Core Team Citation2023).
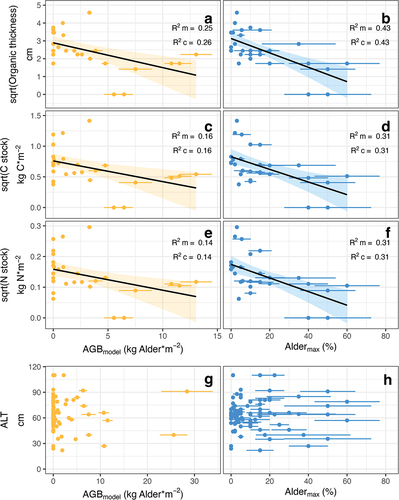
Organic layer thickness was negatively related to both AGBmodel and Aldermax (; R2 m = 0.25 and 0.43 for AGBmodel and Aldermax, respectively; n = 28), leading to lower organic C stocks under alder (; R2 m = 0.16 and 0.31, respectively; n = 28) and lower organic N stocks under alder (; R2 m = 0.14 and 0.31, respectively; n = 28). Aldermax was a stronger predictor of organic layer thickness, C stocks, and N stocks than AGBmodel.
Results indicate that organic layer properties may be responding to changes in alder litter quantity and/or quality over changes in alder biomass. Deciduous shrub leaf litter is relatively labile compared to other tundra plant functional types, which also promotes faster decomposition (Weintraub and Schimel Citation2005). Moreover, alder increases bioavailable N through a symbiotic relationship with N-fixing Frankia bacteria (Franche, Lindström, and Elmerich Citation2009), which may increase rates of decomposition and alter C balance (Salmon et al. Citation2019; Heslop et al. Citation2021; Pérez et al. Citation2021). Additionally, an increase in alder cover may affect organic layer C stocks through crowding of shade intolerant ground cover species, like mosses and lichen (Cornelissen et al. Citation2001; M. D. Walker et al. Citation2006; Pajunen, Oksanen, and Virtanen Citation2011; Elmendorf et al. Citation2012; Fraser et al. Citation2014; Mekonnen et al. Citation2021). The thick moss layer in the tundra promotes C accumulation due to slow decomposition rates (Hobbie et al. Citation2000) and reduces soil temperature fluctuations in the growing season (Turetsky et al. Citation2012; Fisher et al. Citation2016). A recent manipulative study found that shrub presence, rather than litter inputs, changed nutrient cycles and microbial processes indirectly though changes to soil temperature (Aguirre, Benhumea, and McLaren Citation2021). Also, the relatively low predictability of the linear models presented here may be attributed to heterogeneity in shrub canopy and soil properties in alder shrub tundra, which is not fully captured with the chosen sample design.
Contrary to expectations, no difference in ALT was observed with varying alder abundance (). Measured ALT was 63 ± 19 cm (mean ± SD) beneath alder and 66 ± 19 cm beneath tussock tundra. Previous studies have found both positive and negative relationships between ALT and shrub growth (Blok et al. Citation2010; Tape et al. Citation2012; Wilcox et al. Citation2019), because the expansion of shrubs on the tundra introduces complex feedback mechanisms which may produce net cooling (canopy shading, increased evapotranspiration) or net warming (increased albedo, increased snow accumulation, increased decomposition, increased fire occurrence) of the soil (Sturm et al. Citation2005; Lantz, Marsh, and Kokelj Citation2013; Loranty et al. Citation2018; Kropp et al. Citation2020). We found no evidence of an effect in either direction of shrub presence on ALT and thus permafrost stability. We therefore found that the observed organic horizon shallowing beneath alder had no effect on ALT. Previous work in the boreal region has shown that a greater (canopy and understory) leaf area index and organic layer thickness (particularly moss) are associated with a shallower ALT (O’Donnell et al. Citation2009; Fisher et al. Citation2016; Matyshak et al. Citation2017). It is perplexing then that the observed organic horizon shallowing beneath alder had no effect on ALT, especially because moss cover and thickness tended to be lower under alder. Taken together, the combination of a lack of trend in thaw depth and a negative trend in organic horizon thickness indicates that ALT could be deepening into mineral soil, albeit with high variability. However, this proposed type of active layer deepening is not typically observed with vegetation change (Fisher et al. Citation2016) and could still be influenced by fire history.
The role of wildfire should also be considered in the interpretation of both organic horizon and ALT results. Fire inhibits shrub growth immediately after occurrence but promotes shrub growth in the long term on the order of a few decades (Racine et al. Citation2004). Because shrubs can resprout following fire and have resilient mycorrhizal symbionts, they may facilitate vegetation recovery (Lantz, Gergel, and Henry Citation2010; Hewitt et al. Citation2013; Heim et al. Citation2021; Mekonnen et al. Citation2021). It is therefore possible that the observed organic horizon properties are predictive of alder presence rather than vice versa, because exposed mineral soil after fire provides area for seed germination (Racine et al. Citation2004). However, in this case we would expect to see additional evidence of active fire recovery at burned sites. We do not observe any significant difference in organic layer thickness, C or N stocks, or ALT in non-alder tundra between burned and unburned sites. We also do not see evidence of increased ALT corresponding with either shallow organic layer or burn occurrence. In a boreal forest study, thicker organic layers resulted in decreased ALTs, and fire occurrence resulted in increased ALTs through direct effects on canopy, soil moisture, and organic layer thickness (Fisher et al. Citation2016). Tundra vegetation usually recovers within five to ten years in small tundra fires, but compositional shifts may persist for decades after severe fires and/or result in regime shifts (Bret-Harte et al. Citation2013). It is evident that tundra fires have a role in promoting shrub growth and altering organic layer properties in the short term, but based on the results of this study, it seems evident that shrub growth facilitates the persistence of these effects. Increased burn area and frequency of large fires were observed in the boreal region in the twentieth century (Kasischke and Turetsky Citation2006; Kelly et al. Citation2013), and tundra fires are projected to increase in frequency and severity (Hu et al. Citation2010); thus, fire will have an increasingly present role in moderating tundra shrub growth.
Current Earth system models suggest that the increase in net primary production due to warming will offset the loss of C from Arctic soils (Todd-Brown et al., Citation2013), but our data suggest the opposite may be the case, considering that the organic layer is high in C content (Tarnocai et al. Citation2009). In the set of locations for which a soil core was harvested (n = 28), we found that the maximum stock of soil C in the organic horizon was 20 kg soil C m−2 (associated with 1.7 kg alder C m−2 at the same plot location) and the maximum stock of alder biomass C was 5.7 kg alder C m−2 (associated with 2.6 kg soil C m−2). Thus, at the observed maximum alder biomass, there was a loss of about 62 percent combined biomass and organic layer C stock. Though limited in scope, our study reveals that the accelerated growth of alder in alpine tundra systems is resulting in a loss of the organic soil horizons containing large quantities of C and N.
Conclusions
This study investigated the impact of alder shrub biomass and cover on soil organic layer properties in graminoid, alpine tundra in Interior Alaska. Though limited in site selection by terrain and infrastructure, this study sought to fill a need for in situ measurements of the impact of alder shrub growth on the landscape. We found that increasing alder biomass and cover—at five sites that have exhibited increasing growth over the past four decades—was associated with a reduction in organic layer thickness, C, and N, resulting in net C loss among organic soil horizons and biomass. However, we found no difference in ALT associated with increasing alder growth. Given the scale and speed of Arctic shrubification, more studies are urgently needed to understand the impacts of shrub growth on C sequestration and permafrost degradation, especially because it may vary for other species of shrubs.
Supplemental Material
Download Zip (327.1 KB)Acknowledgments
We thank S. Sackett (Fairbanks ABoVE field office) and NSF Toolik Field Station for logistical assistance during field campaigns.
Disclosure statement
No potential conflict of interest was reported by the authors.
Data availability statement
The data collected for this study are available at the Oak Ridge National Laboratory Distributed Active Archive Center (https://doi.org/10.3334/ORNLDAAC/2300). Figures and models were made with R v4.2.1: https://cran.r-project.org/bin/windows/base/old/.
Supplementary material
Supplemental data for this article can be accessed online at https://doi.org/10.1080/15230430.2023.2285334.
Additional information
Funding
References
- Aguirre, D., A. E. Benhumea, and J. R. McLaren. 2021. Shrub encroachment affects tundra ecosystem properties through their living canopy rather than increased litter inputs. Soil Biology and Biochemistry 153: 108121. doi:10.1016/j.soilbio.2020.108121.
- Alaska Fire Service (AFS) Alaska Wildland Fire Information Map Series. n.d. Accessed December 13, 2023. https://www.arcgis.com/apps/webappviewer/index.html?id=4a083628f8f94a4290fd502e43551f73.
- Andruko, R., R. Danby, and P. Grogan. 2020. Recent growth and expansion of birch shrubs across a low arctic landscape in continental Canada: Are these responses more a consequence of the severely declining caribou herd than of climate warming? Ecosystems 23, no. 7: 1362–14. doi:10.1007/s10021-019-00474-7.
- Barrere, M., F. Domine, M. Belke-Brea, and D. Sarrazin. 2018. Snowmelt events in autumn can reduce or cancel the soil warming effect of snow–vegetation interactions in the Arctic. Journal of Climate 31, no. 23: 9507–18. doi:10.1175/JCLI-D-18-0135.1.
- Bartoń, K. (2023). MuMIn: Multi-model inference. https://CRAN.R-project.org/package=MuMIn.
- Bates, D., M. Mächler, B. Bolker, and S. Walker. 2015. Fitting linear mixed-effects models using lme4. Journal of Statistical Software 67, no. 1: 1–48. doi:10.18637/jss.v067.i01.
- Beck, P. S. A., and S. J. Goetz. 2011. Satellite observations of high northern latitude vegetation productivity changes between 1982 and 2008: Ecological variability and regional differences. Environmental Research Letters 6, no. 4: 045501. doi:10.1088/1748-9326/6/4/045501.
- Beck, P. S. A., S. J. Goetz, M. C. Mack, H. D. Alexander, Y. Jin, J. T. Randerson, and M. M. Loranty. 2011. The impacts and implications of an intensifying fire regime on Alaskan boreal forest composition and albedo. Global Change Biology 17, no. 9: 2853–66. doi:10.1111/j.1365-2486.2011.02412.x.
- Berner, L. T., H. D. Alexander, M. M. Loranty, P. Ganzlin, M. C. Mack, S. P. Davydov, and S. J. Goetz. 2015. Biomass allometry for alder, dwarf birch, and willow in boreal forest and tundra ecosystems of far northeastern Siberia and north-central Alaska. Forest Ecology and Management 337: 110–18. doi:10.1016/j.foreco.2014.10.027.
- Berner, L. T., P. S. A. Beck, A. G. Bunn, and S. J. Goetz. 2013. Plant response to climate change along the forest-tundra ecotone in northeastern Siberia. Global Change Biology 19, no. 11: 3449–62. doi:10.1111/gcb.12304.
- Berner, L. T., R. Massey, P. Jantz, B. C. Forbes, M. Macias-Fauria, I. Myers-Smith, T. Kumpula, et al. 2020. Summer warming explains widespread but not uniform greening in the Arctic tundra biome. Nature Communications 11, no. 1: 4621. doi:10.1038/s41467-020-18479-5.
- Blok, D., M. M. P. D. Heijmans, G. Schaepman‐Strub, A. V. Kononov, T. C. Maximov, and F. Berendse. 2010. Shrub expansion may reduce summer permafrost thaw in Siberian tundra. Global Change Biology 16, no. 4: 1296–305. doi:10.1111/j.1365-2486.2009.02110.x.
- Boelman, N. T., L. Gough, J. R. McLaren, and H. Greaves. 2011. Does NDVI reflect variation in the structural attributes associated with increasing shrub dominance in Arctic tundra? Environmental Research Letters 6, no. 3: 035501. doi:10.1088/1748-9326/6/3/035501.
- Boelman, N. T., M. Stieglitz, H. M. Rueth, M. Sommerkorn, K. L. Griffin, G. R. Shaver, and J. A. Gamon. 2003. Response of NDVI, biomass, and ecosystem gas exchange to long-term warming and fertilization in wet sedge tundra. Oecologia 135, no. 3: 414–21. doi:10.1007/s00442-003-1198-3.
- Bolker, B. & R Development Core Team. (2022). bbmle: Tools for general maximum likelihood estimation. https://CRAN.R-project.org/package=bbmle
- Bret-Harte, M. S., M. C. Mack, G. R. Shaver, D. C. Huebner, M. Johnston, C. A. Mojica, C. Pizano, and J. A. Reiskind. 2013. The response of Arctic vegetation and soils following an unusually severe tundra fire. Philosophical Transactions of the Royal Society B: Biological Sciences 368, no. 1624: 20120490. doi:10.1098/rstb.2012.0490.
- Bronaugh, D., & Consortium, A. W. for the P. C. I. (2019). zyp: Zhang + Yue-pilon trends package. https://CRAN.R-project.org/package=zyp
- Cahoon, S. M. P., P. F. Sullivan, E. Post, and J. M. Welker. 2012. Large herbivores limit CO2 uptake and suppress carbon cycle responses to warming in West Greenland. Global Change Biology 18, no. 2: 469–79. doi:10.1111/j.1365-2486.2011.02528.x.
- Chapin, F. S., M. Sturm, M. C. Serreze, J. P. McFadden, J. R. Key, A. H. Lloyd, A. D. McGuire, et al. 2005. Role of land-surface changes in Arctic summer warming. Science 310, no. 5748: 657–60. doi:10.1126/science.1117368.
- Chen, Y., F. S. Hu, and M. J. Lara. 2021. Divergent shrub-cover responses driven by climate, wildfire, and permafrost interactions in Arctic tundra ecosystems. Global Change Biology 27, no. 3: 652–63. doi:10.1111/gcb.15451.
- Christie, K. S., J. P. Bryant, L. Gough, V. T. Ravolainen, R. W. Ruess, and K. D. Tape. 2015. The role of vertebrate herbivores in regulating shrub expansion in the Arctic: A synthesis. BioScience 65, no. 12: 1123–33. doi:10.1093/biosci/biv137.
- Cornelissen, J. H. C., T. V. Callaghan, J. M. Alatalo, A. Michelsen, E. Graglia, A. E. Hartley, D. S. Hik, et al. 2001. Global change and Arctic ecosystems: Is lichen decline a function of increases in vascular plant biomass? Journal of Ecology 89, no. 6: 984–94. doi:10.1111/j.1365-2745.2001.00625.x.
- Cunliffe, A. M., J. J. Assmann, G. N. Daskalova, J. T. Kerby, and I. H. Myers-Smith. 2020. Aboveground biomass corresponds strongly with drone-derived canopy height but weakly with greenness (NDVI) in a shrub tundra landscape. Environmental Research Letters 15, no. 12: 125004. doi:10.1088/1748-9326/aba470.
- Drew, J. W., M. S. Bret-Harte, A. Buchwal, and C. Heslop. 2023. Age matters: Older alnus viridis ssp. fruticosa are more sensitive to summer temperatures in the Alaskan Arctic. Functional Ecology 37, no. 5: 1463–75. doi:10.1111/1365-2435.14307.
- Elmendorf, S. C., G. H. R. Henry, R. D. Hollister, R. G. Björk, A. D. Bjorkman, T. V. Callaghan, L. S. Collier, et al. 2012. Global assessment of experimental climate warming on tundra vegetation: Heterogeneity over space and time. Ecology Letters 15, no. 2: 164–75. doi:10.1111/j.1461-0248.2011.01716.x.
- Filella, I., J. Peñuelas, L. Llorens, and M. Estiarte. 2004. Reflectance assessment of seasonal and annual changes in biomass and CO2 uptake of a Mediterranean shrubland submitted to experimental warming and drought. Remote Sensing of Environment 90, no. 3: 308–18. doi:10.1016/j.rse.2004.01.010.
- Fisher, J. P., C. Estop-Aragonés, A. Thierry, D. J. Charman, S. A. Wolfe, I. P. Hartley, J. B. Murton, M. Williams, and G. K. Phoenix. 2016. The influence of vegetation and soil characteristics on active-layer thickness of permafrost soils in boreal forest. Global Change Biology 22, no. 9: 3127–40. doi:10.1111/gcb.13248.
- Fox, J., and S. Weisberg. 2019. An R companion to applied regression. 3rd ed. Thousand Oaks, CA: Sage. https://socialsciences.mcmaster.ca/jfox/Books/Companion/
- Franche, C., K. Lindström, and C. Elmerich. 2009. Nitrogen-fixing bacteria associated with leguminous and non-leguminous plants. Plant and Soil 321, no. 1: 35–59. doi:10.1007/s11104-008-9833-8.
- Fraser, R. H., T. C. Lantz, I. Olthof, S. V. Kokelj, and R. A. Sims. 2014. Warming-induced shrub expansion and lichen decline in the western Canadian Arctic. Ecosystems 17, no. 7: 1151–68. doi:10.1007/s10021-014-9783-3.
- Frost, G. V., and H. E. Epstein. 2014. Tall shrub and tree expansion in Siberian tundra ecotones since the 1960s. Global Change Biology 20, no. 4: 1264–77. doi:10.1111/gcb.12406.
- Frost, G. V., H. E. Epstein, D. A. Walker, G. Matyshak, and K. Ermokhina. 2013. Patterned-ground facilitates shrub expansion in Low Arctic tundra. Environmental Research Letters 8, no. 1: 015035. doi:10.1088/1748-9326/8/1/015035.
- Gamon, J. A., C. B. Field, M. L. Goulden, K. L. Griffin, A. E. Hartley, G. Joel, J. Penuelas, and R. Valentini. 1995. Relationships between NDVI, canopy structure, and photosynthesis in three Californian vegetation types. Ecological Applications 5, no. 1: 28–41. doi:10.2307/1942049.
- Giglio, L., L. Boschetti, D. P. Roy, M. L. Humber, and C. O. Justice. 2018. The Collection 6 MODIS burned area mapping algorithm and product. Remote Sensing of Environment 217: 72–85. doi:10.1016/j.rse.2018.08.005.
- Göckede, M., F. Kittler, M. J. Kwon, I. Burjack, M. Heimann, O. Kolle, N. Zimov, and S. Zimov. 2017. Shifted energy fluxes, increased Bowen ratios, and reduced thaw depths linked with drainage-induced changes in permafrost ecosystem structure. The Cryosphere 11, no. 6: 2975–96. doi:10.5194/tc-11-2975-2017.
- Gorelick, N., M. Hancher, M. Dixon, S. Ilyushchenko, D. Thau, and R. Moore. 2017. Google Earth Engine: Planetary-scale geospatial analysis for everyone. Remote Sensing of Environment 202: 18–27. doi:10.1016/j.rse.2017.06.031.
- Guay, K. C., P. S. A. Beck, L. T. Berner, S. J. Goetz, A. Baccini, and W. Buermann. 2014. Vegetation productivity patterns at high northern latitudes: A multi-sensor satellite data assessment. Global Change Biology 20, no. 10: 3147–58. doi:10.1111/gcb.12647.
- Hart, S. C., D. Binkley, and D. A. Perry. 1997. Influence of red alder on soil nitrogen transformations in two conifer forests of contrasting productivity. Soil Biology and Biochemistry 29, no. 7: 1111–23. doi:10.1016/S0038-0717(97)00004-7.
- Heijmans, M. M. P. D., R. Í. Magnússon, M. J. Lara, G. V. Frost, I. H. Myers-Smith, J. van Huissteden, M. T. Jorgenson, et al. 2022. Tundra vegetation change and impacts on permafrost. Nature Reviews Earth & Environment 3, no. 1: Article 1. doi:10.1038/s43017-021-00233-0.
- Heim, R. J., A. Bucharova, L. Brodt, J. Kamp, D. Rieker, A. V. Soromotin, A. Yurtaev, and N. Hölzel. 2021. Post-fire vegetation succession in the Siberian subarctic tundra over 45 years. Science of the Total Environment 760: 143425. doi:10.1016/j.scitotenv.2020.143425.
- Heslop, C. B., R. W. Ruess, K. Kielland, and M. S. Bret-Harte. 2021. Soil enzymes illustrate the effects of alder nitrogen fixation on soil carbon processes in Arctic and boreal ecosystems. Ecosphere 12, no. 11: e03818. doi:10.1002/ecs2.3818.
- Hewitt, R. E., E. Bent, T. N. Hollingsworth, F. S. Chapin, and D. L. Taylor. 2013. Resilience of Arctic mycorrhizal fungal communities after wildfire facilitated by resprouting shrubs. Ecoscience 3, no. 20: 296–310. doi:10.2980/20-3-3620.
- Hewitt, R. E., F. S. Chapin III, T. N. Hollingsworth, and D. L. Taylor. 2017. The potential for mycobiont sharing between shrubs and seedlings to facilitate tree establishment after wildfire at Alaska Arctic treeline. Molecular Ecology 26, no. 14: 3826–38. doi:10.1111/mec.14143.
- Hobbie, S. E., J. P. Schimel, S. E. Trumbore, and J. R. Randerson. 2000. Controls over carbon storage and turnover in high-latitude soils. Global Change Biology 6, no. S1: 196–210. doi:10.1046/j.1365-2486.2000.06021.x.
- Holmes, R. L. 1983. Computer-assisted quality control in tree-ring dating and measurement. Loveland, CO: Tree-Ring Society.
- Huebner, D. C., A. Buchwal, and M. S. Bret-Harte. 2022. Retrogressive thaw slumps in the Alaskan Low Arctic may influence tundra shrub growth more strongly than climate. Ecosphere 13, no. 6: e4106. doi:10.1002/ecs2.4106.
- Hu, F. S., P. E. Higuera, J. E. Walsh, W. L. Chapman, P. A. Duffy, L. B. Brubaker, and M. L. Chipman. 2010. Tundra burning in Alaska: Linkages to climatic change and sea ice retreat. Journal of Geophysical Research: Biogeosciences 115, no. G4. doi: 10.1029/2009JG001270.
- Jackson, R. B., J. L. Banner, E. G. Jobbágy, W. T. Pockman, and D. H. Wall. 2002. Ecosystem carbon loss with woody plant invasion of grasslands. Nature 418, no. 6898: Article 6898. doi:10.1038/nature00910.
- Jafarov, E. E., E. T. Coon, D. R. Harp, C. J. Wilson, S. L. Painter, A. L. Atchley, and V. E. Romanovsky. 2018. Modeling the role of preferential snow accumulation in through talik development and hillslope groundwater flow in a transitional permafrost landscape. Environmental Research Letters 13, no. 10: 105006. doi:10.1088/1748-9326/aadd30.
- Jespersen, R. G., A. J. Leffler, S. F. Oberbauer, and J. M. Welker. 2018. Arctic plant ecophysiology and water source utilization in response to altered snow: Isotopic (δ18O and δ2H) evidence for meltwater subsidies to deciduous shrubs. Oecologia 187, no. 4: 1009–23. doi:10.1007/s00442-018-4196-1.
- Johnstone, J. F., F. S. Chapin III, J. Foote, S. Kemmett, K. Price, and L. Viereck. 2004. Decadal observations of tree regeneration following fire in boreal forests. Canadian Journal of Forest Research 34, no. 2: 267–73. doi:10.1139/x03-183.
- Johnstone, J. F., T. N. Hollingsworth, F. S. Chapin III, and M. C. Mack. 2010. Changes in fire regime break the legacy lock on successional trajectories in Alaskan boreal forest. Global Change Biology 16, no. 4: 1281–95. doi:10.1111/j.1365-2486.2009.02051.x.
- Jorgenson, M. T., V. Romanovsky, J. Harden, Y. Shur, J. O. O’Donnell, E. A. G. Schuur, M. Kanevskiy, and S. Marchenko. 2010. Resilience and vulnerability of permafrost to climate change. Canadian Journal of Forest Research. doi: 10.1139/X10-060.
- Kasischke, E. S., and M. R. Turetsky. 2006. Recent changes in the fire regime across the North American boreal region—Spatial and temporal patterns of burning across Canada and Alaska. Geophysical Research Letters 33, no. 9. doi: 10.1029/2006GL025677.
- Kelly, R., M. L. Chipman, P. E. Higuera, I. Stefanova, L. B. Brubaker, and F. S. Hu. 2013. Recent burning of boreal forests exceeds fire regime limits of the past 10,000 years. Proceedings of the National Academy of Sciences 110, no. 32: 13055–60. doi:10.1073/pnas.1305069110.
- Kropp, H., M. M. Loranty, S. M. Natali, A. L. Kholodov, A. V. Rocha, I. Myers-Smith, B. W. Abbot, et al. 2020. Shallow soils are warmer under trees and tall shrubs across Arctic and Boreal ecosystems. Environmental Research Letters 16, no. 1: 015001. doi:10.1088/1748-9326/abc994.
- Lantz, T. C., S. E. Gergel, and G. H. R. Henry. 2010. Response of green alder (Alnus viridis subsp. Fruticosa) patch dynamics and plant community composition to fire and regional temperature in north-western Canada. Journal of Biogeography 37, no. 8: 1597–610. doi:10.1111/j.1365-2699.2010.02317.x.
- Lantz, T. C., P. Marsh, and S. V. Kokelj. 2013. Recent shrub proliferation in the Mackenzie Delta uplands and microclimatic implications. Ecosystems 16, no. 1: 47–59. doi:10.1007/s10021-012-9595-2.
- Lawrence, D. M., and S. C. Swenson. 2011. Permafrost response to increasing Arctic shrub abundance depends on the relative influence of shrubs on local soil cooling versus large-scale climate warming. Environmental Research Letters 6, no. 4: 045504. doi:10.1088/1748-9326/6/4/045504.
- Liu, Y., W. J. Riley, T. F. Keenan, Z. A. Mekonnen, J. A. Holm, Q. Zhu, and M. S. Torn. 2022. Dispersal and fire limit Arctic shrub expansion. Nature Communications 13, no. 1: Article 1. doi:10.1038/s41467-022-31597-6.
- Loranty, M. M., B. W. Abbott, D. Blok, T. A. Douglas, H. E. Epstein, B. C. Forbes, B. M. Jones, et al. 2018. Reviews and syntheses: Changing ecosystem influences on soil thermal regimes in northern high-latitude permafrost regions. Biogeosciences 15, no. 17: 5287–313. doi:10.5194/bg-15-5287-2018.
- Lynch, L. M., M. B. Machmuller, M. F. Cotrufo, E. A. Paul, and M. D. Wallenstein. 2018. Tracking the fate of fresh carbon in the Arctic tundra: Will shrub expansion alter responses of soil organic matter to warming? Soil Biology and Biochemistry 120: 134–44. doi:10.1016/j.soilbio.2018.02.002.
- Mackay, J. R. 1977. Probing for the bottom of the active layer. Geological Survey of Canada Paper 77: 327–8.
- Martin, A. C., E. S. Jeffers, G. Petrokofsky, I. Myers-Smith, and M. Macias-Fauria. 2017. Shrub growth and expansion in the Arctic tundra: An assessment of controlling factors using an evidence-based approach. Environmental Research Letters 12, no. 8: 085007. doi:10.1088/1748-9326/aa7989.
- Matyshak, G. V., O. Goncharova, Yu, N. G. Moskalenko, D. A. Walker, H. E. Epstein, and Y. Shur. 2017. Contrasting Soil thermal regimes in the forest-tundra transition near Nadym, West Siberia, Russia. Permafrost and Periglacial Processes 28, no. 1: 108–18. doi:10.1002/ppp.1882.
- Mekonnen, Z. A., W. J. Riley, L. T. Berner, N. J. Bouskill, M. S. Torn, G. Iwahana, A. L. Breen, et al. 2021. Arctic tundra shrubification: A review of mechanisms and impacts on ecosystem carbon balance. Environmental Research Letters 16, no. 5: 053001. doi:10.1088/1748-9326/abf28b.
- Mekonnen, Z. A., W. J. Riley, and R. F. Grant. 2018. Accelerated nutrient cycling and increased light competition will lead to 21st century shrub expansion in North American Arctic Tundra. Journal of Geophysical Research: Biogeosciences 123, no. 5: 1683–701. doi:10.1029/2017JG004319.
- Melvin, T. M., and K. R. Briffa. 2014. CRUST: Software for the implementation of regional chronology standardisation: Part 2. Further RCS options and recommendations. Dendrochronologia 32, no. 4: 343–56. doi:10.1016/j.dendro.2014.07.008.
- Miner, K. R., M. R. Turetsky, E. Malina, A. Bartsch, J. Tamminen, A. D. McGuire, A. Fix, C. Sweeney, C. D. Elder, and C. E. Miller. 2022. Permafrost carbon emissions in a changing Arctic. Nature Reviews Earth & Environment 3, no. 1: Article 1. doi:10.1038/s43017-021-00230-3.
- Myers-Smith, I. H., B. C. Forbes, M. Wilmking, M. Hallinger, T. Lantz, D. Blok, K. D. Tape, et al. 2011. Shrub expansion in tundra ecosystems: Dynamics, impacts and research priorities. Environmental Research Letters 6, no. 4: 045509. doi:10.1088/1748-9326/6/4/045509.
- Myers-Smith, I. H., J. T. Kerby, G. K. Phoenix, J. W. Bjerke, H. E. Epstein, J. J. Assmann, C. John, et al. 2020. Complexity revealed in the greening of the Arctic. Nature Climate Change 10, no. 2: Article 2. doi:10.1038/s41558-019-0688-1.
- Nakagawa, S., and H. Schielzeth. 2013. A general and simple method for obtaining R2 from generalized linear mixed-effects models. Methods in Ecology and Evolution 4, no. 2: 133–42. doi:10.1111/j.2041-210x.2012.00261.x.
- Nalder, I. A., and R. W. Wein. 1998. A new forest floor corer for rapid sampling, minimal disturbance and adequate precision. Silva Fennica 32: 373–82. doi:10.14214/sf.678.
- Nauta, A. L., M. M. P. D. Heijmans, D. Blok, J. Limpens, B. Elberling, A. Gallagher, B. Li, et al. 2015. Permafrost collapse after shrub removal shifts tundra ecosystem to a methane source. Nature Climate Change 5, no. 1: Article 1. doi:10.1038/nclimate2446.
- Nehrbass-Ahles, C., F. Babst, S. Klesse, M. Nötzli, O. Bouriaud, R. Neukom, M. Dobbertin, and D. Frank. 2014. The influence of sampling design on tree-ring-based quantification of forest growth. Global Change Biology 20, no. 9: 2867–85. doi:10.1111/gcb.12599.
- Odebiri, O., J. Odindi, and O. Mutanga. 2021. Basic and deep learning models in remote sensing of soil organic carbon estimation: A brief review. International Journal of Applied Earth Observation and Geoinformation 102: 102389. doi:10.1016/j.jag.2021.102389.
- O’Donnell, J. A., V. E. Romanovsky, J. W. Harden, and A. D. McGuire. 2009. The effect of moisture content on the thermal conductivity of moss and organic soil horizons from black spruce ecosystems in Interior Alaska. Soil Science 174, no. 12: 646. doi:10.1097/SS.0b013e3181c4a7f8.
- Olofsson, J., L. Oksanen, T. Callaghan, P. E. Hulme, T. Oksanen, and O. Suominen. 2009. Herbivores inhibit climate-driven shrub expansion on the tundra. Global Change Biology 15, no. 11: 2681–93. doi:10.1111/j.1365-2486.2009.01935.x.
- Pajunen, A. M., J. Oksanen, and R. Virtanen. 2011. Impact of shrub canopies on understorey vegetation in western Eurasian tundra. Journal of Vegetation Science 22, no. 5: 837–46. doi:10.1111/j.1654-1103.2011.01285.x.
- Pearson, R. G., S. J. Phillips, M. M. Loranty, P. S. A. Beck, T. Damoulas, S. J. Knight, and S. J. Goetz. 2013. Shifts in Arctic vegetation and associated feedbacks under climate change. Nature Climate Change 3, no. 7: 673–7. doi:10.1038/nclimate1858.
- Pérez, J., A. Basaguren, N. López-Rojo, A. M. Tonin, F. Correa-Araneda, L. Boyero. 2021. The role of key plant species on litter decomposition in streams: Alder as experimental model. In The ecology of plant litter decomposition in stream ecosystems, ed. C. M. Swan, L. Boyero, and C. Canhoto, 143–61. Cham: Springer International Publishing. doi: 10.1007/978-3-030-72854-0_8.
- Plante, S., E. Champagne, P. Ropars, S. Boudreau, E. Lévesque, B. Tremblay, and J.-P. Tremblay. 2014. Shrub cover in northern Nunavik: Can herbivores limit shrub expansion? Polar Biology 37, no. 5: 611–9. doi:10.1007/s00300-014-1461-6.
- Racine, C., R. Jandt, C. Meyers, and J. Dennis. 2004. Tundra fire and vegetation change along a hillslope on the Seward Peninsula, Alaska, U.S.A. Arctic, Antarctic, and Alpine Research 36, no. 1: 1–10. doi:10.1657/1523-0430(2004)036[0001:TFAVCA]2.0.CO;2.
- R Core Team. 2021. R: A language and environment for statistical computing. R Foundation for Statistical Computing. https://www.R-project.org/.
- R Core Team. 2023. R: A language and environment for statistical computing. R Foundation for Statistical Computing. https://www.R-project.org/.
- Rhoades, C., H. Oskarsson, D. Binkley, and B. Stottlemyer. 2001. Alder (Alnus crispa) effects on soils in ecosystems of the Agashashok River valley, northwest Alaska. Écoscience 8, no. 1: 89–95. doi:10.1080/11956860.2001.11682634.
- Riedel, S. M., H. E. Epstein, and D. A. Walker. 2005. Biotic controls over spectral reflectance of Arctic tundra vegetation. International Journal of Remote Sensing 26, no. 11: 2391–405. doi:10.1080/01431160512331337754.
- Salmon, V. G., A. L. Breen, J. Kumar, M. J. Lara, P. E. Thornton, S. D. Wullschleger, and C. M. Iversen. 2019. Alder distribution and expansion across a tundra hillslope: Implications for local N cycling. Frontiers in Plant Science 10: 1099. doi:10.3389/fpls.2019.01099.
- Shevtsova, I., B. Heim, S. Kruse, J. Schröder, E. I. Troeva, L. A. Pestryakova, E. S. Zakharov, and U. Herzschuh. 2020. Strong shrub expansion in tundra-taiga, tree infilling in taiga and stable tundra in central Chukotka (north-eastern Siberia) between 2000 and 2017. Environmental Research Letters 15, no. 8: 085006. doi:10.1088/1748-9326/ab9059.
- Shur, Y. L., and M. T. Jorgenson. 2007. Patterns of permafrost formation and degradation in relation to climate and ecosystems. Permafrost and Periglacial Processes 18, no. 1: 7–19. doi:10.1002/ppp.582.
- Street, L. E., J.-A. Subke, R. Baxter, K. J. Dinsmore, C. Knoblauch, and P. A. Wookey. 2018. Ecosystem carbon dynamics differ between tundra shrub types in the western Canadian Arctic. Environmental Research Letters 13, no. 8: 084014. doi:10.1088/1748-9326/aad363.
- Sturm, M., J. Holmgren, J. P. McFadden, G. E. Liston, F. S. Chapin, and C. H. Racine. 2001. Snow–shrub interactions in Arctic tundra: A hypothesis with climatic implications. Journal of Climate 14, no. 3: 336–44. doi:10.1175/1520-0442(2001)014<0336:ssiiat>2.0.CO;2.
- Sturm, M., J. Schimel, G. Michaelson, J. M. Welker, S. F. Oberbauer, G. E. Liston, J. Fahnestock, and V. E. Romanovsky. 2005. Winter biological processes could help convert Arctic tundra to shrubland. BioScience 55, no. 1: 17–26. doi:10.1641/0006-3568(2005)055[0017:WBPCHC]2.0.CO;2.
- Tape, K. D., M. Hallinger, J. M. Welker, and R. W. Ruess. 2012. Landscape heterogeneity of shrub expansion in Arctic Alaska. Ecosystems 15, no. 5: 711–24. doi:10.1007/s10021-012-9540-4.
- Tape, K. D., M. Sturm, and C. Racine. 2006. The evidence for shrub expansion in Northern Alaska and the Pan-Arctic. Global Change Biology 12, no. 4: 686–702. doi:10.1111/j.1365-2486.2006.01128.x.
- Tarnocai, C., J. G. Canadell, E. A. G. Schuur, P. Kuhry, G. Mazhitova, and S. Zimov. 2009. Soil organic carbon pools in the northern circumpolar permafrost region. Global Biogeochemical Cycles 23, no. 2. doi: 10.1029/2008GB003327.
- Todd-Brown, K. E. O., J. T. Randerson, W. M. Post, F. M. Hoffman, C. Tarnocai, E. A. G. Schuur, and S. D. Allison. 2013. Causes of variation in soil carbon simulations from CMIP5 Earth system models and comparison with observations. Biogeosciences 10, no. 3: 1717–36. doi:10.5194/bg-10-1717-2013.
- Turetsky, M. R., B. Bond-Lamberty, E. Euskirchen, J. Talbot, S. Frolking, A. D. McGuire, and E.-S. Tuittila. 2012. The resilience and functional role of moss in boreal and Arctic ecosystems. New Phytologist 196, no. 1: 49–67. doi:10.1111/j.1469-8137.2012.04254.x.
- U.S. Census Bureau. 2022. TIGER/Line Shapefiles [machine-readable data files] and technical documentation. http://www.census.gov/geo/maps-data/data/tiger-line.html.
- Vankoughnett, M. R., and P. Grogan. 2016. Plant production and nitrogen accumulation above- and belowground in low and tall birch tundra communities: The influence of snow and litter. Plant and Soil 408, no. 1: 195–210. doi:10.1007/s11104-016-2921-2.
- van Rossum, G., and F. L. Drake. 2009. Python 3 reference manual. Scotts Valley, CA: CreateSpace.
- Viereck, L. A. 1992. The Alaska vegetation classification. U.S. Department of Agriculture, Forest Service, Pacific Northwest Research Station.
- Walker, D. A., M. O. Leibman, H. E. Epstein, B. C. Forbes, U. S. Bhatt, M. K. Raynolds, J. C. Comiso, et al. 2009. Spatial and temporal patterns of greenness on the Yamal Peninsula, Russia: Interactions of ecological and social factors affecting the Arctic normalized difference vegetation index. Environmental Research Letters 4, no. 4: 045004. doi:10.1088/1748-9326/4/4/045004.
- Walker, M. D., C. H. Wahren, R. D. Hollister, G. H. R. Henry, L. E. Ahlquist, J. M. Alatalo, M. S. Bret-Harte, et al. 2006. Plant community responses to experimental warming across the tundra biome. Proceedings of the National Academy of Sciences 103, no. 5: 1342–6. doi:10.1073/pnas.0503198103.
- Wallace, C. A., and J. L. Baltzer. 2020. Tall shrubs mediate abiotic conditions and plant communities at the taiga-tundra ecotone. Ecosystems 23, no. 4: 828–41. doi:10.1007/s10021-019-00435-0.
- Wang, J. A., D. Sulla-Menashe, C. E. Woodcock, O. Sonnentag, R. F. Keeling, and M. A. Friedl. 2019. ABoVE: Landsat-derived annual dominant land cover across ABoVE core domain, 1984–2014. Oak Ridge, TN: ORNL Distributed Active Archive Center. doi: 10.3334/ORNLDAAC/1691.
- Way, R. G., and C. M. Lapalme. 2021. Does tall vegetation warm or cool the ground surface? Constraining the ground thermal impacts of upright vegetation in northern environments. Environmental Research Letters 16, no. 5:054077. doi: 10.1088/1748-9326/abef31.
- Weintraub, M. N., and J. P. Schimel. 2005. Nitrogen cycling and the spread of shrubs control changes in the carbon balance of Arctic tundra ecosystems. BioScience 55, no. 5: 408–15. doi:10.1641/0006-3568(2005)055[0408:NCATSO]2.0.CO;2.
- Wickham, H. 2016. Ggplot2: Elegant graphics for data analysis. New York: Springer-Verlag. https://ggplot2.tidyverse.org.
- Wilcox, E. J., D. Keim, T. de Jong, B. Walker, O. Sonnentag, A. E. Sniderhan, P. Mann, and P. Marsh. 2019. Tundra shrub expansion may amplify permafrost thaw by advancing snowmelt timing. Arctic Science 5, no. 4: 202–17. doi:10.1139/as-2018-0028.
- Yue, S., P. Pilon, and G. Cavadias. 2002. Power of the Mann–Kendall and Spearman’s rho tests for detecting monotonic trends in hydrological series. Journal of Hydrology 259, no. 1: 254–71. doi:10.1016/S0022-1694(01)00594-7.