
 ?Mathematical formulae have been encoded as MathML and are displayed in this HTML version using MathJax in order to improve their display. Uncheck the box to turn MathJax off. This feature requires Javascript. Click on a formula to zoom.
ABSTRACT
A vulnerability assessment model and indicator system for the changes in the cryosphere in the Western Sichuan Plateau are constructed based on the “exposure–sensitivity–adaptive capacity” framework. The model aims to capture the multiple characteristics of vulnerability to cryosphere changes in the region by selecting influencing factors from three dimensions: exposure, sensitivity, and adaptive capacity. Furthermore, the study explores the interrelationships among vulnerability dimensions and employs geographical detectors to analyze the driving mechanisms of vulnerability. The ultimate goal is to provide a scientific and rational basis for developing effective adaptation strategies to prevent and mitigate cryosphere-related disasters in the area. The main findings are as follows: (1) The vulnerability to cryosphere changes in the Western Sichuan Plateau exhibits a distribution pattern characterized by higher vulnerability in the west and lower vulnerability in the east. (2) There is a significant correlation between vulnerability and geographical location, characterized by two types of distribution patterns: high–high aggregation and low–low aggregation. The aggregation patterns are relatively stable but exhibit spatial heterogeneity. (3) The vulnerability to cryosphere changes in the Western Sichuan Plateau is the combined result of natural geographical conditions, socioeconomic development levels, and other factors.
Introduction
The cryosphere, as one of the most sensitive components of the Earth’s climate system, has significant impacts on global and regional climate, ecosystems, and human well-being (Fountain et al. Citation2012; Ding and Xiao Citation2019; Qin, Yao, and Ding Citation2019; Rasul and Molden Citation2019; Lin et al. Citation2020; Ding et al. Citation2021; Peng et al. Citation2021). Vulnerability to cryosphere changes refers to the susceptibility of a system to adverse impacts resulting from cryosphere changes. It represents the degree to which a system is prone to negative effects caused by cryosphere changes and is a function of the system’s exposure, sensitivity, and adaptive capacity (Yang and Zhang Citation2010; Ding and Yang Citation2019). In 2007, China pioneered exploratory research on the vulnerability of the cryosphere and its changes globally, discussing the main scientific issues related to cryosphere changes and their impacts, systematically addressing key research questions, and identifying key research directions (Ding and Yang Citation2019). Although still in its early stages, preliminary research outcomes have been achieved, primarily focusing on the following aspects:
1. Regional-scale vulnerability assessment of cryosphere changes: Studies by Yao et al. (Citation2013) have explored the impacts of cryosphere changes on regional water circulation and ecological environments in the Qinghai–Tibet Plateau region; He, Wu, and Liu (Citation2012) have quantitatively assessed the vulnerability to cryosphere changes in China, estimated future development trends, and analyzed key factors determining vulnerability.
2. Vulnerability assessment of cryosphere changes in different research subjects or systems: Yu and Zhai (Citation2020) have estimated extreme events, abrupt changes, and their impacts related to ocean and cryosphere changes and proposed corresponding response measures; K. Wang et al. (Citation2020) have reviewed and summarized the current status and trends of climate system and cryosphere research, providing insights for future systemic research.
3. Development of a research framework on vulnerability and adaptation of the cryosphere and its changes, focusing on the “impact–vulnerability–adaptation” nexus (Yang et al. Citation2015; Ding et al. Citation2020): For instance, Deng et al. (Citation2011) have studied the impacts of cryosphere changes in the Urumqi River Basin on the general public and proposed corresponding adaptation strategies. It is worth noting that research on cryosphere vulnerability and adaptation is still in its early stages, and further studies are needed to enhance our understanding. The findings and outcomes mentioned above provide valuable insights and pave the way for future research in this field.
The Western Sichuan Plateau is located in the southeastern edge of the Qinghai–Tibet Plateau, which is considered the core area of the cryosphere in China. It is also a region with relatively unique geographical conditions and relatively frequent human activities within the cryosphere. As a result, its response to climate change is more pronounced (Su, Gao, and Xiao Citation2019). The region is characterized by complex topography and significant vertical zonation of climate. Seasonal snow, permafrost, and maritime glaciers are widely distributed, making it a typical area for alpine ecosystems. In recent years, climate change has led to corresponding changes in cryospheric elements in this region. For example, Z. F. Wang et al. (Citation2023) analyzed glacier changes in the Sichuan region from 2007 to 2017 using geographical detectors. The results showed a decrease in the proportion of glaciers in the southeast direction and significant retreat of glaciers in the east direction; Zhong et al. (Citation2021) analyzed the snow cover changes in the Western Sichuan Plateau from 2001 to 2020 based on MOD10A2S data. The study revealed an overall trend of a gradual decrease in snow cover extent in the Western Sichuan Plateau. Therefore, enhancing research on the vulnerability to cryosphere changes in this region is of great practical significance for the local ecological environment and socioeconomic development.
Research on the cryosphere in the Western Sichuan Plateau has primarily focused on aspects such as snow cover and spatiotemporal variations of snow disasters (Huaming et al. Citation2015), with limited studies on its vulnerability. Therefore, this study analyzes the vulnerability to cryosphere changes in the Western Sichuan Plateau based on the criteria of exposure, sensitivity, and adaptive capacity. It explores the interrelationships among vulnerability dimensions and analyzes the driving mechanisms of vulnerability. The ultimate goal is to provide a scientific and rational basis for developing effective adaptation strategies to address cryosphere changes, as well as to prevent and mitigate cryosphere-related disasters in the Western Sichuan Plateau.
Study area
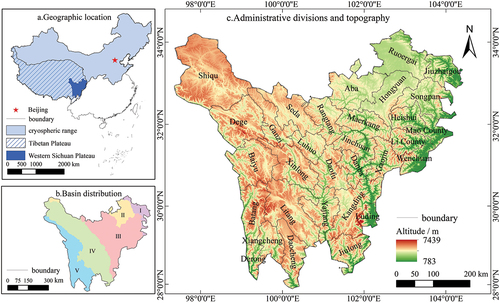
The Western Sichuan Plateau (97°21′–104°26′ E; 27°57′–34°11′ N) is located in the southeastern edge of the Qinghai–Tibet Plateau and covers parts of the Hengduan Mountains. It falls within the transitional zone of China’s first and second steps (). Administratively, it includes the Garze Tibetan Autonomous Prefecture and the Ngawa Tibetan and Qiang Autonomous Prefecture in Western Sichuan Province, with a total area of approximately 2.73 × 10⁵ km2. The average elevation in the region is above 4,000 m, and it features complex terrain and significant vertical relief, making it prone to landslides, debris flows, and other secondary geological hazards. The climate of the Western Sichuan Plateau is predominantly subtropical plateau monsoon climate. The average annual precipitation ranges from approximately 556 to 730 mm, and the mean annual temperature ranges from 9.01°C to 10.5°C (Huijun et al. Citation2020; Xiang et al. Citation2022). The annual sunshine hours range from 2,000 to 2,600 hours. Stable seasonal snow cover, seasonal permafrost, and maritime glaciers are widely distributed in the region. The number of snow-covered days per year in the northern part of the plateau can reach forty to ninety days, whereas the southern part experiences ten to forty days of snow cover. The maximum frozen depth of permafrost in the plateau’s northern region, located north of 32° N, can reach 1.0 to 2.5 m, representing long-term stable seasonal permafrost. Moving southward, the permafrost transitions into stable and southern seasonal types (Sun Citation2018). The region is home to approximately 549.12 km2 of glaciers, distributed across twenty counties, including Daocheng and Litang (Liu et al. Citation2015).
Figure 1. (a) Geographic location and (b) basin distribution in the study area: (I) Jialing River Basin, (II) Yellow River Basin, (III) Minjiang River Basin, (IV) Yalong River Basin, and (V) Jinsha River Basin). (c) Administrative divisions and topography.
Data and methods
Data
The data used in this study include digital elevation model data, glacier data, permafrost data, snow data, meteorological data, and socioeconomic data. The glacier data, permafrost data, and snow data were obtained from the National Tibetan Plateau Data Center (http://data.tpdc.ac.cn). The digital elevation model data were sourced from the Geospatial Data Cloud (http://www.gscloud.cn/). Net primary productivity (NPP) data were obtained from MOD17A3. Temperature and precipitation data were sourced from the National Meteorological Science Data Center (http://data.cma.cn). Socioeconomic data were collected from the National Bureau of Statistics of the People’s Republic of China (https://www.stats.gov.cn/), Sichuan province Bureau of Statistics (http://tjj.sc.gov.cn/), Ganzi Statistical Information NetWork (http://tjj.gzz.gov.cn/), Aba State Bureau of Statistics (https://tjj.abazhou.gov.cn/) and statistical bulletins on national economic and social development published by various counties and cities.
Evaluation methods
According to the research, the vulnerability to cryosphere changes is a function of system exposure, sensitivity, and adaptability (Ding and Yang Citation2019). Due to the different measurement units and numerical scales of the indicators in each dimension, a range standardization method was applied to normalize the positive and negative indicator data before conducting vulnerability analysis. Taking into account the field distribution of cryosphere elements in the Western Sichuan Plateau region, the analytic hierarchy process was used to determine the weights of the indicators; expert opinions were comprehensively analyzed and the weights of the corresponding indicators were adjusted to obtain the final weights of each indicator. The vulnerability index V is calculated as follows:
where is the exposure index;
is the sensitivity index;
is the adaptability index;
is the ordinal number of each type of index;
,
, and
are the number of exposure, sensitivity, and adaptability indexes, respectively;
is the weight of the ith exposure index;
is the weight of the ith sensitivity index;
is the weight of the ith adaptability index;
is the standardized value of the ith exposure index;
is the standardized value of the ith sensitivity index; and
is the standardized value of the ith adaptability index.
Indicator construction
Based on the constructed vulnerability evaluation index system of the cryosphere changes in China (Ding and Yang Citation2019), the vulnerability evaluation index system of the cryosphere changes in the Western Sichuan Plateau and its impact was constructed from the perspective of the natural environment, social economy, etc. The specific index system is shown in .
Table 1. Vulnerability assessment index system of cryosphere changes in the Western Sichuan Plateau.
Exposure refers to the position and extent to which a system is affected by changes in the cryosphere. In this study, we selected the following indicators to represent the exposure levels of glacial, snow, and permafrost elements: glacier area coverage, cumulative snow depth change rate, and annual average ground temperature change rate. Additionally, we used average elevation and average slope to indicate the exposure levels based on the natural geographic location. Sensitivity refers to the degree to which a system is affected by cryosphere changes. Considering that climate change can lead to variations in glacier area and annual average ground temperature, we chose temperature change rate and precipitation change rate to represent the sensitivity of the natural system. Furthermore, NPP reflects the initial material and energy conversion in terrestrial ecosystems; hence, we selected the NPP change rate to indicate the sensitivity of the ecological system. Adaptability refers to the sum of effective adaptive measures taken by humans in response to cryosphere changes. In this study, we mainly focused on the adaptability of the study area in the context of social and economic aspects. We selected the following indicators to measure adaptability: total output value of agriculture, forestry, animal husbandry, and fishery to reflect regional economic adaptability; per capita gross domestic product (GDP) to represent individual economic adaptability; urbanization rate to reflect the level of urbanization, where higher urbanization level indicates stronger adaptability; the year-end livestock population to reflect the development level of animal husbandry in the study area, because the region is predominantly engaged in animal husbandry; local fiscal revenue to represent the regional economic foundation; and transportation capacity to reflect the regional transportation support capability.
Spatial correlation analysis
The natural and socioeconomic elements of the Western Sichuan Plateau exhibit distinct spatial agglomeration characteristics that result in the spatial distribution of vulnerability dimensions, including exposure, sensitivity, and adaptive capacity, being correlated. The spatial distribution characteristics of each dimension greatly affect the spatial distribution pattern and spatial correlation features of vulnerability. Additionally, the spatial distribution pattern of vulnerability has an important impact on the ecological environment and socioeconomic sustainable development of the Western Sichuan Plateau. Therefore, this study utilizes spatial autocorrelation analysis to reveal the spatial correlation characteristics of vulnerability to frozen soil changes in the Western Sichuan Plateau, as well as the spatial distribution characteristics of each dimension’s dispersion or agglomeration. First, we analyze the spatial clustering of vulnerability to changes in the frozen zone of the Western Sichuan Plateau using both the global Moran’s I index and the local Moran’s I index, examining whether there is spatial clustering of vulnerability and the degree of spatial clustering differences using Geoda software (Anselin Citation1995; Hui et al. Citation2011).
The global Moran’s I index is calculated as follows:
The local Moran’s I index is calculated as follows:
where and
are the global and local Moran’s I indices, respectively;
and
are the vulnerability indices of spatial objects
and
, respectively;
is the average value of vulnerability of all spatial objects;
is the spatial weight;
is the sum of the elements of the spatial weight matrix; and
is the number of regions. The local Moran’s I index is spatially clustered to obtain the local indicators of spatial association (LISA) clustering map, which is divided into five types of aggregation: high–high aggregation, high–low aggregation, low–high aggregation, low–low aggregation, and insignificant aggregation.
To test the spatial correlation of exposure and sensitivity, exposure and adaptive capacity, and sensitivity and adaptability, the bivariate spatial autocorrelation model proposed by Anselin and Kelejian (Citation1997) was used. The formula is as follows:
where is the value of attribute
of spatial object
;
is the value of attribute
of spatial object
;
and
are the mean values of attributes
and
, respectively;
and
are the variances of attributes
and
, respectively;
is the number of spatial objects;
is the spatial weight;
represents the exposure index or sensitivity index; and
represents the sensitivity or adaptive capacity index.
Geographic detector model
The natural environmental factors, such as temperature, precipitation, and topography, as well as social and economic factors, have significant spatial variations in their impact on the vulnerability of the frozen zone in the Western Sichuan Plateau. Moreover, there are obvious interactions among these factors. Therefore, the geographic detector model proposed by J. F. Wang and Xu (Citation2017) is suitable for analyzing the spatial variations to reveal the dominant factors. In this article, “factor detection” and “interaction detection” models were selected to detect the factors influencing the spatial pattern of vulnerability to cryosphere changes in the study area. Factor detection is calculated as follows:
where is the explanatory power of the factor,
is vulnerability,
is the variance of vulnerability,
is the number of indicator factor classifications, and
refer to the vulnerability and variance of each county and city of
(
= 1, 2, …,
), respectively.
Whether there was an interaction between factors was determined using the formulas in (J. F. Wang and Xu Citation2017).
Table 2. Type of interaction detection.
Results and analysis
Spatial differentiation characteristics
The vulnerability and its dimensions in the study were classified into five levels using the natural break method in ArcGIS (Wu et al. Citation2023). Based on this classification, a spatial distribution map of vulnerability to cryosphere changes in the Western Sichuan Plateau () was generated.
Figure 2. Spatially distributed vulnerability levels of cryosphere changes in the Western Sichuan Plateau. (a) Spatial distribution of Vulnerability levels. (b) Spatial distribution of Exposure levels. (c) Spatial distribution of Sensitivity levels. (d) Spatial distribution of Adaptability levels.
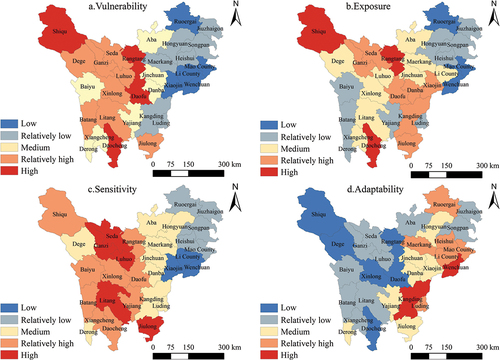
The vulnerability to cryosphere changes in the Western Sichuan Plateau exhibits a general pattern of higher vulnerability in the west and lower vulnerability in the east (). In terms of county-level distribution, Shiqu in the northwest, Rangtang and Daofu in the central region, and Daocheng in the south have high vulnerability levels, with vulnerability indices of 0.394, 0.552, 0.424, and 0.407, respectively. Areas with relatively high vulnerability are found in the northern regions, including Dege, Ganzi, Seda, Luhuo, and Xinlong, as well as in the central and southern regions, including Litang, Batang, and Jiulong, with vulnerability indices ranging from 0.288 to 0.357. Counties with moderate vulnerability are scattered and include Aba in the north; Baiyu, Jinchuan, Danba, Yajiang in the central region; and Derong and Xiangcheng in the south, with vulnerability indices ranging from 0.172 to 0.246. The eastern and northeastern parts of the plateau show a predominance of low and relatively low vulnerability, with Wenchuan being the lowest with a vulnerability index of 0.05.
As shown in , the distribution of vulnerability exposure levels to cryosphere changes in the Western Sichuan Plateau is relatively scattered. Shiqu, Rangtang, and Daocheng exhibit the highest exposure levels. The areas with lower exposure levels are relatively concentrated in the northeastern part of the plateau, including Ruoergai, Mao County, and Wenchuan. The sensitivity levels to cryosphere changes in the Western Sichuan Plateau are primarily moderate or higher, covering 80.05 percent of the total area of counties and cities in the region (). The spatial distribution of adaptation capacity levels in the vulnerability to cryosphere changes in the Western Sichuan Plateau is roughly opposite to the distribution of vulnerability levels, showing a pattern of higher capacity in the east and lower capacity in the west (). Shiqu and Dege in the northwest and Rangtang, Daofu, Xinlong, and Daocheng in the central region exhibit the lowest adaptation capacity, whereas Kangding and Wenchuan in the eastern part demonstrate the highest adaptation capacity.
In general, the Western Sichuan Plateau exhibits higher vulnerability to cryosphere changes in systems that have high exposure, high sensitivity, and low adaptation capacity. For example, areas like Shiqu in the northwest area of the plateau, which are characterized by high elevations and high exposure levels to cryosphere elements such as snow cover and frozen ground, as well as limited transportation infrastructure and relatively lower economic development, tend to have higher vulnerability. On the other hand, regions like Wenchuan and Li County in the eastern part of the plateau have lower elevations, better transportation infrastructure, and relatively higher levels of economic development, resulting in lower vulnerability.
Spatial correlation characteristics
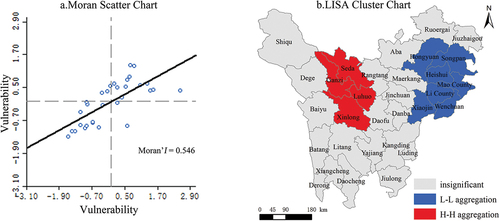
The spatial correlation results and LISA cluster map of cryosphere vulnerability in the Western Sichuan Plateau are shown in . From , it can be observed that the global Moran’s I index for vulnerability is positive (p < .01). This indicates a strong positive correlation between vulnerability and geographical location. The cryosphere vulnerability in the plateau exhibits a stable clustering pattern with spatial heterogeneity. This means that areas with similar spatial distributions tend to have similar vulnerability levels, and areas with more dispersed spatial distributions exhibit greater variations in vulnerability. shows that the vulnerability of the Western Sichuan Plateau mainly shows two patterns of high–high aggregation and low–low aggregation.
Figure 3. Spatial relationship and LISA cluster map of vulnerability to cryosphere changes in the Western Sichuan Plateau. (a) Moran Scatter Chart of Vulnerability. (b) LISA Cluster Chart of Vulnerability.
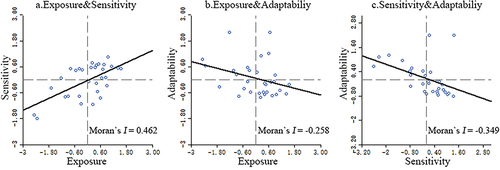
To further investigate the spatial correlation between the three dimensions of vulnerability, a bivariate spatial autocorrelation analysis was conducted. Based on the results of the spatial correlation between exposure and sensitivity (), the Moran’s I index was 0.462 (p < .01), indicating a positive correlation between the distribution of areas with high exposure and sensitivity to cryosphere changes in the Western Sichuan Plateau. This suggests that areas with high exposure to cryosphere changes are often also sensitive to these changes. shows the spatial correlation between exposure and adaptive capacity, with a Moran’s I index of −0.258 (p < .05), indicating a significant negative correlation between the two variables. This implies that areas with high exposure to cryosphere changes are often characterized by low adaptive capacity, meaning that these areas are less able to resist the impacts of cryosphere changes. displays the spatial correlation between sensitivity and adaptive capacity, with a Moran’s I index of −0.349 (p < .01), indicating a significant negative correlation between the two variables in space. Therefore, areas with high sensitivity to cryosphere changes are often characterized by low adaptive capacity.
Figure 4. Spatial relationship between dimensions of vulnerability to cryosphere changes in the Western Sichuan Plateau. (a) Moran Scatter Chart of Exposure and Sensitivity. (b) Moran Scatter Chart of Exposure and Adaptability. (c) Moran Scatter Chart of Sensitivity and Adaptability.
In summary, the areas of the Western Sichuan Plateau with high vulnerability are typically those with high exposure, high sensitivity, and low adaptive capacity. Conversely, areas with low vulnerability are more likely to have low exposure, low sensitivity, and high adaptive capacity. Due to its complex geographical environment, the economic development levels of different regions in the Western Sichuan Plateau also vary greatly, which to some extent affects the distribution pattern of vulnerability to cryosphere changes. This suggests that, under the influence of natural environmental factors with high exposure and sensitivity, improving social and economic development levels to enhance adaptive capacity and reduce vulnerability should not be underestimated. At the same time, the complex relationships between different dominant factors should be considered, and differentiated policy measures should be formulated for different regions.
Driving factors analysis
Variable selection
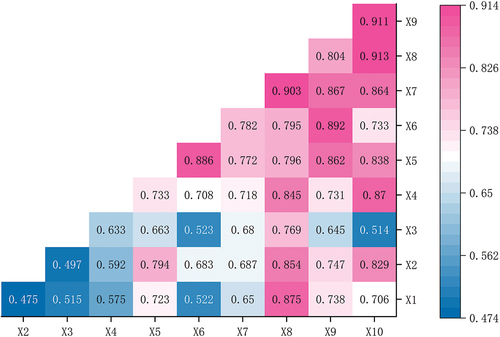
This study selected vulnerability as the dependent variable and, based on the weighted results, identified the top ten influencing factors as independent variables: transportation capacity (X1), local fiscal revenue (X2), year-end livestock inventory (X3), per capita grassland area (X4), per capita GDP (X5), total agricultural output value (X6), precipitation change rate (X7), temperature change rate (X8), altitude (X9), and cumulative snow depth change rate (X10). After standardizing each indicator, the natural break method in ArcGIS software was used to classify the factor indicators into five levels and transform them from numerical variables to categorical variables. GeoDetector was then used to analyze the impact of each indicator on vulnerability (Miao et al. Citation2023).
Explanatory power analysis of impact factors
Using GeoDetector software, a quantitative analysis was conducted on the explanatory power of the factors influencing the vulnerability of the cryosphere in the Western Sichuan Plateau at the county level. The spatial differentiation and relative importance of each indicator factor in relation to vulnerability were compared.
The results of the factor analysis () indicate that the q-value for the temperature change rate is 0.673, which has the strongest explanatory power for the vulnerability of the cryosphere, followed by the q-value for altitude at 0.550. This suggests that these two factors are the core factors influencing the vulnerability of the cryosphere in the Western Sichuan Plateau. As natural factors, temperature and altitude indicate that differences in the vulnerability of the cryosphere in the region are largely influenced by natural factors. The q-values for per capita GDP, cumulative snow depth change rate, and precipitation change rate are all above 0.4, indicating that these three factors also have a significant impact on vulnerability. The differences in per capita GDP, which represents individual economic adaptability, are also significant due to regional development and population differences, making it a major factor affecting vulnerability. The q-values for local fiscal revenue and year-end livestock inventory are both below 0.2, indicating that these two factors have a small impact on the vulnerability of the cryosphere in the Western Sichuan Plateau.
Table 3. Detection results of influencing factors on the vulnerability to cryosphere changes in the Western Sichuan Plateau.
Based on factor analysis, it can be determined that the explanatory power of each indicator factor for vulnerability has a certain degree of consistency and variability. The consistency is demonstrated by the fact that most factor explanatory powers are above 0.3, indicating that each factor has a certain impact on vulnerability. The variability is shown by the differences in the explanatory power of indicator factors for vulnerability, indicating that each factor has a different effect on vulnerability. This suggests that the impact of each factor on vulnerability is not the same.
Interaction analysis of influencing factors
The interactive detection results of the vulnerability of the frozen circle in the Western Sichuan Plateau are shown in . From the detection results, the interactive types mainly manifest as bivariate enhancement and nonlinear enhancement, indicating that the explanatory power of the interactive effects of various influencing factors is higher than that of single factors. The interactive effects between factors have an enhancing effect on the spatial differentiation of the vulnerability of the frozen circle in the Western Sichuan Plateau. Among them, the interaction between the rate of temperature change and the rate of cumulative snow depth change is the strongest, with a q(X1 ∩ X2) value of 0.913. The next strongest interactions are the interaction between altitude and the rate of cumulative snow depth change, the interaction between the rate of temperature change and the rate of precipitation change, the interaction between agricultural total output value and altitude, and the interaction between agricultural total output value and per capita GDP. Their q(X1 ∩ X2) values are all above 0.88. Therefore, it can be seen that the spatial distribution of the vulnerability of the frozen circle in the study area is not determined by a single geographical, climatic, or human factor but by the interaction of various factors.
Figure 5. Interaction detection results of influencing factors on the vulnerability to cryosphere changes in the Western Sichuan Plateau.
According to the results of the comprehensive factor analysis, the key driving factors of ecological vulnerability in the Western Sichuan Plateau are the cumulative snow depth change rate, altitude, temperature change rate, precipitation change rate, and per capita GDP. Therefore, when utilizing and developing ecological resources in the Western Sichuan Plateau and promoting socioeconomic development, the dual impact of regional natural and socioeconomic conditions should be considered, as well as the comprehensive effects of these factors on the ecological environment. It is important to develop natural resources rationally, strengthen environmental protection, and promote harmonious development between humans and nature. These measures will ensure sustainable development in the region.
Discussion
Impacts of cryosphere changes
Due to climate change and human activities, glaciers in the Western Sichuan Plateau have significantly retreated in the past decade. Many main valley glaciers have split into multiple tributary glaciers, resulting in an increase in the number of glaciers in the region. However, the overall glacier area has decreased by 52.572 km2, accounting for approximately 8.25 percent of the total glacier area (). The consequences of glacier changes, such as disaster effects, water resource effects, ecological effects, and social effects, have become increasingly prominent. Glacier degradation has led to ice avalanches, glacier lake outbursts, and, subsequently, the occurrence of glacier floods and debris flows (Yao et al. Citation2019). However, the glaciers in the Western Sichuan Plateau are relatively small in size and located in sparsely populated high-altitude mountain areas and are mostly tourist attractions. The changes in glaciers, such as the Daguo Glacier (Xie et al. Citation2021) and the Hailuogou Glacier (Zhao, Zhang, and Zhang Citation2022), mainly affect the glacier tourism industry. Due to the retreat of glaciers to higher altitudes or even complete melting, the size and accessibility of glaciers have decreased, resulting in increased costs for tourists and a decrease in the attractiveness of the landscape and the overall tourist experience. Ultimately, this will restrict the development of the glacier tourism industry in the region and lead to a decrease in regional economic income (Y. Wang et al. Citation2023).
Table 4. Changes in the number and area of glaciers in the Western Sichuan Plateau from 2007 to 2017.
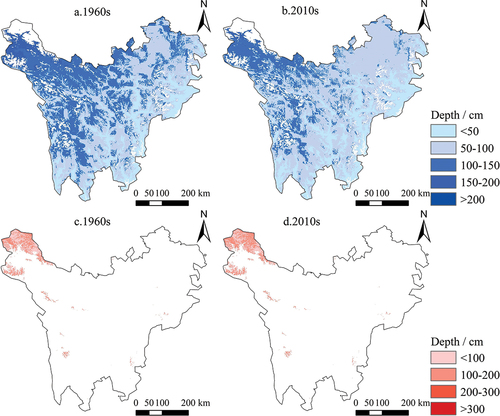
Permafrost is widely distributed in the Western Sichuan Plateau. In contrast to the concentrated distribution of permafrost in some areas of the Karakoram Mountains, other regions are characterized by seasonal frozen ground. Over the past seventy years, the average thickness of the active layer of permafrost has increased by approximately 5.54 cm, whereas the maximum freezing depth of seasonal frozen ground has decreased by approximately 13.2 cm, and the area covered by seasonal frozen ground has decreased by approximately 322 km2 (). In the high-altitude plateau areas dominated by animal husbandry, such as the Maoya Grassland in the central plateau, the Zaxikaca Grassland in the northwest, and the Ruoergai Grassland in the northeast, the freeze–thaw process has a significant impact on the region. Due to the low stability of both permafrost and seasonal frozen ground in the Western Sichuan Plateau (Ran et al. Citation2021), seasonal frozen ground freezes in winter and melts in spring and summer, causing ground uplift and subsidence, resulting in frost heaves and thermokarst pits (Jichun and Yu Citation2021). Infrastructure such as houses, sheds, and tunnels built on top of permafrost may tilt or even collapse, and roadbeds may become undulating (Yongbo, Yongjian, and Zhi Citation2015). In addition, in some high-altitude and steep river valley areas, freeze–thaw cycles of frozen ground can trigger secondary disasters such as freeze–thaw landslides and debris flows, posing a threat to farmland and residential areas in the valley and downstream (Zhanqian Citation2023).
Figure 6. Distribution and changes of various types of permafrost in the Western Sichuan Plateau: (a) maximum freezing depth of seasonal permafrost in the 1960s, (b) maximum freezing depth of seasonal permafrost in the 2010s, (c) active layer thickness of perennial permafrost in the 1960s, and (d) active layer thickness of perennial permafrost in the 2010s.
Snow, as an important component of the cryosphere, affects surface radiation balance, heat balance, and water balance processes and has a significant impact on various sectors of the national economy, especially agriculture and transportation (Hu Citation2013). The Western Sichuan Plateau is located in one of the five major pastoral areas in China, and snow has an important influence on agriculture and economic development in this region. Numerous studies have shown that snow phenology has undergone significant changes in most areas of the Western Sichuan Plateau in recent decades (X. Y. Wang et al. Citation2016; Tang et al. Citation2021), with an increase in abnormal snow conditions leading to a significant increase in the frequency of snow disasters and blizzards, with increasing trends of 0.93 and 0.51 times per decade, respectively, and the increase rate in the northern region is significantly higher than that in the southern region (Huaming et al. Citation2015). Meteorological data show that snow disasters in the Western Sichuan Plateau mostly occur in the central and northwest regions, which are the main pastoral areas, posing great challenges to the survival of livestock (Ye Citation2022). At the same time, the increasing frequency and intensity of extreme snowfall have a certain destructive effect on regional roads, power facilities, and houses, severely affecting the normal lives of people in pastoral areas (Zhou Citation2022). In addition, the changes in snow cover have had a favorable impact on the production and livelihoods of the people in the Western Sichuan region, with the early melting of seasonal snow cover and the early greening of alpine grasslands, making agricultural and pastoral activities more favorable (Ma Citation2022).
Adaptation of the system to cryosphere changes
Currently, various industries and departments have taken corresponding measures to address the comprehensive impacts of cryosphere changes on the natural and socioeconomic systems of the Western Sichuan Plateau and to jointly respond to the various impacts brought about by cryosphere changes (Kang et al. Citation2020).
To protect glaciers and slow down their melting rate, relevant departments should strengthen research and propose corresponding adaptation strategies (Salim et al. Citation2021). For example, in the Dagou Glacier Scenic Area, a method called “covering the glacier with a blanket” is used (Xu Citation2021), where a special material is placed on the glacier to reduce its ability to absorb solar radiation and slow down its melting rate. By limiting human activities, such as improving the energy efficiency of tourism products and services and promoting the consumption of low-energy tourism products and services in the Hailuogou Glacier, the impact of tourism activities on glaciers can be reduced to some extent (Shuxin et al. Citation2022). These scenic areas can develop various other tourism projects. For instance, the Dagou Glacier has proposed a group development strategy for ice and snow tourism (S. J. Wang et al. Citation2022) and colorful forest tours to meet the needs of different tourists, increase the income of the scenic area, and compensate for the decrease in tourists due to a decrease of the glacier’s attraction.
In response to the increasing occurrence of seasonal frozen soil and the intensifying freeze–thaw action, relevant departments should strengthen research on cold region engineering and adopt higher technical standards to enhance the construction of cold region projects. This includes improving the ability of transportation infrastructure such as roads, bridges, and tunnels to withstand freezing circle disasters. For example, when constructing tunnels and roads, insulation materials should be used to reduce damage to infrastructure caused by freeze–thaw cycles (Li, Li, et al. Citation2022; Li, Mu, et al. Citation2022). Exploration of the distribution of frozen soil along the route should be strengthened, and efforts should be made to avoid areas with developed frozen soil when designing the route. The impact of frozen soil can be reduced by using elevated bridges and other methods. For large areas with widespread frozen soil, measures can be taken to mitigate the effects of freeze–thaw action. For example, the Qinghai–Tibet Railway has improved the thermal stability of frozen soil by using “thermal pile foundations” to ensure the stability of the roadbed (Chen et al. Citation2013). To address the issue of thermal melting debris flows in frozen soil, monitoring should be strengthened, and an early warning system should be established to prevent secondary disasters caused by freeze–thaw action. Additionally, protective embankments and diversion projects should be constructed to reduce the harm of secondary disasters such as landslides and debris flows to agricultural and pastoral areas caused by freeze–thaw action. Furthermore, measures such as de-icing, anti-skid treatments, and enhanced engineering maintenance of roadbeds should be implemented to ensure smooth and safe traffic on frozen roads (Yuwei et al. Citation2022).
The risk of snow disaster in the Western Sichuan Plateau has had a significant impact on agriculture and animal husbandry. The meteorological department should strengthen the dynamic monitoring and early warning of the meteorological conditions in the Western Sichuan Plateau (W. Wang Citation2014), release meteorological information such as temperature drop and snowfall in a timely fashion, and determine the risk levels of freezing circle disasters in different regions. It should also collaborate with the emergency management department to establish a sound emergency management mechanism for freezing circle disasters, including disaster information collection, early warning release, postdisaster rescue, and recovery and reconstruction work. In the agricultural and animal husbandry sectors, scientific and technological guidance should be provided to farmers and herders regarding farmland, pastureland, livestock, and feed reserves, to help reduce the impact of freezing circle disasters on production (Fuchang et al. Citation2020). To mitigate the hazards of snow disasters, the local government has also taken measures to enhance the adaptability of herders. For example, in major pastoral areas, compensation is provided to villagers for livestock deaths through the purchase of relevant insurance, and funding is allocated to help herders reinforce sheds and houses. In addition, some regional governments have implemented a “relocation” policy, relocating herders from cold and frequently snow-stricken areas to environmentally friendly places, to improve the ability and adaptability of farmers and herders to cope with snow disasters.
Limitations and perspectives
However, due to the many factors that affect the vulnerability to changes in the cryosphere, the complex interactions between these factors, and the differences in indicator selection due to different regional scales and data types, further research should extend the selection of evaluation indicators and study the spatial and temporal development trends and future changes in cryosphere vulnerability at a deeper level. The Western Sichuan Plateau is part of the Hengduan Mountains in the southeastern part of the Qinghai–Tibet Plateau, where the effects and impacts of the cryosphere overlap, and evaluating and analyzing the vulnerability to changes in the cryosphere in the Western Sichuan Plateau can help the cryosphere-affected areas to develop scientific and reasonable prevention and mitigation strategies for cryosphere disasters. The impact of cryosphere changes is a complex process, with interactions and balances between positive and negative impacts. Therefore, when dealing with the various impacts of cryosphere changes, the Western Sichuan Plateau should conduct scientific assessments and planning and strengthen scientific research, monitoring and early warning, technical support, and public participation to ensure the sustainable development of the region’s ecological environmental and socioeconomic conditions.
Conclusions
This article establishes a vulnerability assessment model and indicator system based on indicators using the “exposure–sensitivity–adaptability” model, with counties and cities as the basic unit. Following the principles of indicator selection, factors that affect vulnerability were selected from three dimensions: exposure, sensitivity, and adaptability. The vulnerability assessment indicator system for changes in the cryosphere in the research area was established to explore the relationships between vulnerability and each dimension, reflecting multiple characteristics of the vulnerability to cryosphere changes in the Western Sichuan Plateau. The study also used a geographic detector to analyze the driving mechanisms of vulnerability. The main conclusions are as follows:
Overall, the vulnerability to changes in the cryosphere in the Western Sichuan Plateau shows a distribution pattern of high in the west and low in the east. Vulnerability is higher in areas with high exposure, high sensitivity, and low adaptability levels, whereas areas with low exposure, low sensitivity, and high adaptability, such as those with lower elevations, better transportation conditions, and higher economic development levels, have lower vulnerability.
There is a significant correlation between the vulnerability to changes in the cryosphere in the Western Sichuan Plateau and geographical location, and the vulnerability aggregation feature is relatively stable but has spatial heterogeneity. There are two distribution characteristics of vulnerability: high–high aggregation and low–low aggregation. Areas with high vulnerability have high exposure, high sensitivity, and low adaptability, whereas areas with low vulnerability are mostly areas with low exposure, high sensitivity, and high adaptability.
The vulnerability to changes in the cryosphere in the Western Sichuan Plateau is the result of the interaction of natural geographical conditions, social and economic development levels, and other factors. The explanatory power of each indicator factor for vulnerability has certain consistencies and differences, with the cumulative snow depth change rate, elevation, temperature change rate, precipitation change rate, and per capita GDP being key factors.
Disclosure statement
No potential conflict of interest was reported by the authors.
Additional information
Funding
References
- Anselin, L. 1995. Local indicators of spatial association—LISA. Geographical Analysis 27, no. 2: 93–14. doi:10.1111/j.1538-4632.1995.tb00338.x.
- Anselin, L., and H.H. Kelejian. 1997. Testing for spatial error autocorrelation in the presence of endogenous regressors. International Regional Science Review 20, no. 1–2: 153–82. doi:10.1177/016001769702000109.
- Che, T., and L. Dai. 2019. Remote sensing products of snow depth in Sanjiangyuan (1980-2020). National Tibetan Plateau / Third Pole Environment Data Center. https://doi.org/10.11888/Snow.tpdc.271231.
- Chen, Z.Y., G.Y. Li, Q.H. Yu, Y.H. Mu, and L. Guo. 2013. Study of the thermal stability of cast in-place pile foundations of the Qinghai-Tibet DC transmission project in permafrost regions. Journal of Glaciology and Geocryology 35, no. 5: 1209–18.
- Deng, M.Z., H.G. Zhang, W.Y. Mao, and Y. Wang. 2011. Public perception on the cryosphere changes and selections of adaptation measures in Ürümqi River Basin. Climate Change Research 7, no. 1: 65–72. doi:10.3724/SP.J.1248.2011.00149.
- Ding, Y.J., C. Mu, T. Wu, G. Hu, D. Zou, D. Wang, W. Li, and X. Wu. 2021. Increasing cryospheric hazards in a warming climate. Earth-Science Reviews 213: 103500.
- Ding, Y.J., and C.D.D. Xiao. 2019. Cryospheric changes and their impacts. Beijing: Science Press.
- Ding, Y.J., and J.P. Yang. 2019. Research on vulnerability and adaptation of Chinese cryosphere change. Beijing: Science Press.
- Ding, Y.J., J.P. Yang, Y.P. Fang, and S. J. Wang. 2020. Adaptation research of cryosphere change. Journal of Glaciology and Geocryology 42, no. 1: 11–22.
- Fountain, A.G., J.L. Campbell, E.A.G. Schuur, S.E. StammerJohn, M.W. Williams, and H.W. Ducklow. 2012. The disappearing cryosphere: Impacts and ecosystem responses to rapid cryosphere loss. BioScience 62, no. 4: 405–15. doi:10.1525/bio.2012.62.4.11.
- Fuchang, Z., Z. Qiang, L. Fenggui, C. Qiong, C. Yongping, and Z. Zemin. 2020. Site selection of forage storehouse in high risk areas of snow disaster in Qinghai-Tibet Plateau. Transactions of the Chinese Society of Agricultural Engineering 36, no. 13: 272–9.
- He, Y., Y. Wu, and Q. Liu. 2012. Vulnerability assessment of areas affected by Chinese cryospheric changes in future climate change scenarios. Chinese Science Bulletin 57, no. 36: 4784–90.
- Hu, J.R. 2013. Snow and its disaster control in China. Beijing: China Environment Press.
- Huaming, D., Y. Junping, Y. Rong, and Y. Daniel. 2015. Temporal and spatial distribution of snow disaster and risk evaluation in Western Sichuan Plateau. Bulletin of Soil and Water Conservation 35, no. 3: 261–6.
- Huijun, X., Z. Tingbin, Y. Guihua, H. Dong, Z. Xiaobing, L. Jingji, B. Xiaojuan, and M. Jiaqing. 2020. Dynamic characteristics of NDVI values and its response to climatic factors in Western Sichuan Plateau. Bulletin of Soil and Water Conservation 40, no. 4: 286–94.
- Hui, L.I., W. Yunpeng, L.I. Yan, W. Xingfang, and T. Liang. 2011. A spatial autocorrelation analysis of land use change in Pearl River Delta. Ecology and Environment 20, no. 12: 1879–85.
- Jichun, W.U., and S. Yu. 2021. Interaction effect of frost mounds and embankment in section Duogerong Basin along Gonghe-Yushu Highway. Journal of Glaciology and Geocryology 43, no. 2: 453–62.
- Kang, S.C., W.Q. Guo, X.Y. Zhong, and M. Xu. 2020. Changes in the mountain cryosphere and their impacts and adaptation measures. Climate Change Research 16, no. 2: 143–52.
- Li, L.J., D. Li, X. Zhu, K. Zhang, and Y. Mu. 2022. Freeze-thaw resistance of thermal insulating materials used in cold regions engineering: A state-of-the-art review. GeoFluids 2022: 1–11. doi:10.1155/2022/9015055.
- Li, L.J., Y.H. Mu, F. Ming, X.M. Zhu, K. Zhang, and X. Pang. 2022. Laboratory tests on impacts of cyclic freeze-thaw on properties of thermal insulation materials used in cold regions engineering. Journal of Glaciology and Geocryology 44, no. 2: 693–707. doi:10.7522/j.issn.1000-0240.2022.0069.
- Lin, H.X., J.C. Huang, C.D. Xiao, X.X. Qi, and Y.Q. Chen. 2020. Theories and methods on comprehensive regionalization of cryospheric services. Acta Geographica Sinica 75, no. 3: 631–46. doi:10.11821/dlxb202003014.
- Liu, S., W. Guo, and J. Xu. 2012. The second glacier inventory dataset of China (version 1.0) (2006-2011). National Tibetan Plateau / Third Pole Environment Data Center. https://doi.org/10.3972/glacier.001.2013.db.
- Liu, S.Y., X.J. Yao, W.Q. Guo, J. Xu, D. Shangguan, J. Wei, W. Bao, and L. Wu. 2015. The contemporary glaciers in China based on the second Chinese glacier inventory. Acta Geographica Sinica 70, no. 1: 3–16.
- Ma, Y. 2022. The response of spring phenology to seasonal snow cover in Tibetan Plateau. Lanzhou: Lanzhou University.
- Miao, X., J. Y. Li, Y. M. Liu, and X. Y. Song. 2023. Evaluation and attribution analysis of ecological vulnerability in Ordos City. Journal of Northwest Forestry University 38, no. 1: 168–73.
- Peng, X., T. Zhang, O.W. Frauenfeld, R. Du, H. Jin, and C. Mu. 2021. A holistic assessment of 1979–2016 global cryospheric extent. Earth’s Future 9, no. 8. doi:10.1029/2020EF001969.
- Qin, D.H., T.D. Yao, and Y.J. Ding. 2019. Introduction to cryosphere science. Revised ed. Beijing: Science Press.
- Ran, Y.H., X. Li, G.D. Cheng, Z. Nan, J. Che, Y. Sheng, Q. Wu, et al. 2021. Mapping the permafrost stability on the Tibetan Plateau for 2005–2015. Science China Earth Sciences 51, no. 2: 183–200.
- Ran, Y., X. Li, T. Che, B. Wang, and G. Cheng. 2022. Current state and past changes in frozen ground at the Third Pole. National Tibetan Plateau / Third Pole Environment Data Center. doi:10.11888/Cryos.tpdc.272790.
- Rasul, G., and D. Molden. 2019. The global social and economic consequences of mountain cryospheric change. Frontiers in Environmental Science 7. doi:10.3389/fenvs.2019.00091.
- Salim, E., L. Ravanel, P. Deline, and C. Gauchon. 2021. A review of melting ice adaptation strategies in the glacier tourism context. Scandinavian Journal of Hospitality and Tourism 21, no. 2: 229–46. doi:10.1080/15022250.2021.1879670.
- Shuxin, W., T. Chunping, D. Jiankuo, T. Zi, L. Chenyan, and W. Yarong. 2022. A responsible tourism system at glacier tourism sites: Reducing the impacts of tourism activities on glaciers. Journal of Resources and Ecology 13, no. 4: 697–707. doi:10.5814/j.1674-764x.2022.04.015.
- Su, B., X.J. Gao, and C.D. Xiao. 2019. Interpretation of IPCC SR1.5 on cryosphere change and its impacts. Climate Change Research 15, no. 4: 395–404.
- Sun, M.Y. 2018. Study on Freeze-thaw cycles of subgrade in seasonally frozen soil region of West Sichuan Plateau. Chengdu: Southwest University of Science and Technology.
- Tang, Z.G., G. Deng, G.J. Hu, H. Zhang, H. Pan, and G. Sang. 2021. Spatiotemporal dynamics of snow phenology in the High Mountain Asia and its response to climate change. Journal of Glaciology and Geocryology 43, no. 5: 1400–11.
- Wang, W. 2014. Snow cover monitoring and early warning of snow-caused disaster based on remote sensing and GIS technologies in pastoral areas of the Tibetan Plateau. Lanzhou: Lanzhou University.
- Wang, Z.F., S.J. Fan, Y.J. Wang, X.Q. He, and Y.L. Zeng. 2023. Research on influencing factors of glacier area change in Sichuan based on geographic detectors. Journal of Geomatics 47, no. 2: 97–101.
- Wang, X.Y., S.Y. Wang, H. Yin, and Y. Peng. 2016. Snow phenology variability in the Qinghai-Tibetan Plateau and its response to climate change during 2002–2012. Journal of Geo-Information Science 18, no. 11: 1573–9.
- Wang, J.F., and C.D. Xu. 2017. Geodetector: Principle and prospective. Acta Geographica Sinica 72, no. 1: 116–34.
- Wang, S.J., Z.S. Yang, X.G. Ma, L. Feng, S.H. Huang, and F. Zhang. 2022. On group development of glacier, snow and colorful forest tourism resources and strategies for improving the quality and efficiency in Western Sichuan Plateau-A case study of Dagu Snow Mountain Scenic area. Journal of Sichuan Tourism University 25, no. 5: 45–50.
- Wang, Y., J. Yang, F. Tang, Q. Ge, Q. He, and X. Dai. 2023. Analysis of the reciprocal feedback between glacier tourism development and regional economic growth in Hailuogou. Land 12, no. 1: 24. doi:10.3390/land12010024.
- Wang, K., T.J. Zhang, C.C. Mou, X. Zhong, X. Peng, B. Cao, L. Lu, L. Zheng, X. Wu, and J. Liu. 2020. From the third pole to the arctic: Changes and impacts of the climate and cryosphere. Journal of Glaciology and Geocryology 42, no. 1: 104–23.
- Wu, S., B. Tian, S. J. Gu, and Y. C. Hu. 2023. Spatial-temporal evolution of ecological vulnerability in Beijing-Tianjin-Hebei region based on PSRM Model. Environmental Science 44, no. 10: 5630–40. doi:10.13227/j.hjkx.202210269.
- Xiang, M., C. Wang, Y. Tan, J. Xang, L. Duan, Y. Fang, W. Li, Y. Shu, and M. Liu. 2022. Spatio-temporal evolution and driving factors of carbon storage in the Western Sichuan Plateau. Scientific Reports 12, no. 1: 8114.
- Xie, Y.D., F.T. Wang, S.H. Huang, and Z. Canwen. 2021. Test research on slowing down glacier melting by artificial intervention: A case study of Dagu Glacier. Journal of Glaciology and Geocryology 43, no. 6: 1878–87.
- Xu, D.L. 2021. Covering the Dagu Glacier. Sichuan Daily, October 26.
- Yang, J.P., Y.J. Ding, Y.P. Fang, and D. Qin. 2015. Research frame of vulnerability and adaptation for the cryosphere and its changes. Advances in Earth Science 30, no. 5: 517–29.
- Yang, J.P., and T.J. Zhang. 2010. An overview of cryospheric vulnerability and its assessment methods in China. Journal of Glaciology and Geocryology 32, no. 6: 1084–96.
- Yao, T.D., D.H. Qin, Y.P. Shen, L. Zhao, N. Wang, and A.X. Lu. 2013. Cryospheric changes and their impacts on regional water cycle and ecological conditions in the Qinghai-Tibetan Plateau. Chinese Journal of Nature 35, no. 3: 179–86.
- Yao, T.D., W.S. Yu, G.J. Wu, B. Xu, W. Yang, H. Zhao, W. Wang, et al. 2019. Glacier anomalies and relevant disaster risks on the Tibetan Plateau and surroundings. Chinese Science Bulletin 64, no. 27: 2770–82. doi:10.1360/TB-2019-0246.
- Ye, Q. 2022. Natural disasters and ecological vulnerability assessment in the eastern edge of the Qinghai-Tibet Plateau. Shanghai: East China Normal University.
- Yongbo, T., B. Yongjian, and S. Zhi. 2015. Damage types and hazards effects from freezing-thawing process in Plateau of Western Sichuan Province. Bulletin of Soil and Water Conservation 35, no. 2: 241–5.
- Yuwei, Y.U. W.X. Chen, J.L. Guo, L. Li, and J.Y. Tang. 2022. Reliability analysis of subgrade settlement of Qinghai-Tibet railway under the coupling effect of temperature and vibration. Journal of Railway Science and Engineering 19, no. 2: 376–83.
- Yu, R., and P.M. Zhai. 2020. Ocean and cryosphere change related extreme events, abrupt change and its impact and risk. Climate Change Research 16, no. 2: 194–202.
- Zhanqian, Y. 2023. Stability and cause analysis of landslide in permafrost region of Qinghai-Tibet Plateau. Metallurgical Collections 8, no. 2: 11–13.
- Zhao, D., Z.G. Zhang, and Q.P. Zhang. 2022. Remote sensing monitoring of Hailuogou Glacier change from 1974 to 2020. Journal of Glaciology and Geocryology 45, no. 4: 1276–1287.
- Zhong, D.J., M.X. Sun, Y. Zhang, W. Yu, and C.J. Yang. 2021. Spatio-temporal variation and influencing factors of snow cover in West Sichuan plateau from 2001 to 2020. Journal of Arid Land Resources and Environment 35, no. 11: 111–18.
- Zhou, S.L.M. 2022. Dentification of vulnerability and diagnosis of leading factors of snow disaster in Qinghai-Tibet Plateau. Xining: Qinghai Normal University.