
Abstract
This study examines an association between two important and historical administrative characteristics of civil service systems (i.e., professional and impartial public administration) and national level innovation outputs. Scholars have examined the influence of macrolevel factors, such as the general level of human capital, culture, and social capital, on national rates of innovative activity. However, we still have limited understanding of the relationship between the administrative characteristics of government and national levels of innovative activity in a cross-national setting. This article hypothesizes that countries with highly professional and impartial public administration tend to have higher national level innovation outputs (i.e., knowledge and technology, creative outputs). From utilizing cross-national data from the Quality of Government Institute Expert Survey and Global Innovation Index from over 100 economies, findings show that national levels of innovation outputs are significantly higher in countries that have higher levels of professional and impartial public administration. The results suggest the importance of professional and impartial administration for national level innovative activity.
Innovation brings about various positive impacts on nation competitiveness (Cantwell, Citation2005), economic development (Carlino, Citation2001; Verspagen, Citation2005), and productivity (Fagerberg & Godinho, Citation2005; Mortensen & Bloch, Citation2005). Previous studies also show that innovation can also reduce the unemployment rate (Pianta, Citation2006), and knowledge generation and innovation is one of the driving forces for national economic performance (Richardson, Audretsch, Aldridge, & Nadella, Citation2016; Rinne, Steel, & Fairweather, Citation2012). Previous research also shows that innovation can increase organizational performance (Park, Lee, & Kim, Citation2016). In this article, we focus on innovation outputs at the national level, which are the results of innovative activities by actors within the nation. National level of innovation outputs can be assessed by a wider spectrum of innovative activity, ranging from patent application, utility model application, new business entries, trademark application, royalty and license fees receipts, information and communications technology (ICT) model creation, and creative goods exports (Cornell University, INSEAD, & WIPO, 2014). More specifically, national level of innovation outputs can be knowledge and technology outputs including knowledge creation (e.g., patent application), knowledge impact (e.g., ISO 9001 quality certificates), knowledge diffusion (e.g., high tech exports), creative outputs including intangible assets (e.g., business model creation), creative goods and services (e.g., creative goods exports) and online creativity (e.g., video uploads on YouTube).
Past research has examined the determinants of cross-national or regional variations in the rates of innovation and innovative activity. Such macrofactors include culture (e.g., Hofstede-factors), social capital, corruption, education level, and various governance indicators including government effectiveness, regulatory quality, corruption control, and political structure.1 This study examines an understudied link between administrative characteristics of policy implementing bodies and national level innovative activity. Some consider bureaucratic control and its particular characteristics as an obstacle to innovation. Such criticisms mainly come from the New Public Management (NPM) and National Performance Review (NPR) perspectives (Damanpour, Citation1996; Dougherty & Corse, Citation1995; Osborne & Gaebler, Citation1992; Osborne & Plastrik, Citation1997; Peters, Citation2010; Wynen & Verhoest, Citation2016). However, results of recent empirical studies show that Weber’s model of public bureaucracy (i.e., politically neutral decision making and impartial exercise of public authority) plays a key role in various national level indicators such as levels of corruption, socioeconomic development, entrepreneurship, scientific productivity, and policy implementation, which may also be associated with levels of innovative activity (e.g., Aucoin, Citation2012; Boräng, Nistotskaya, & Xezonakis, Citation2017; Charron, Dahlström, & Lapuente, Citation2016; Cornell, Citation2014; Cornell & Grimes, Citation2015; Dahlström & Lapuente, Citation2017; Evans & Rauch, Citation1999; Fernández-Carro & Lapuente-Giné, Citation2016; Lodge & Gill, Citation2011; Nistotskaya & Cingolani, Citation2016; Rauch & Evans, Citation2000; Rothstein & Teorell, Citation2008). In addition, research shows that institutional quality matters for private investments in the public-private partnership market (Baker, Citation2016).
Despite such recent scholarly interests in and reappraisals of bureaucracy (Dahlström & Lapuente, Citation2017; Evans & Rauch, Citation1999; Miller, Citation2000; Olsen, Citation2006; Rauch & Evans, Citation2000; Rothstein & Teorell, Citation2008; Schuster, Citation2016; Sundell, Citation2014), the relationship between administrative characteristics and innovative activity is understudied. This article focuses on this relatively overlooked link by conducting a cross-national study of 108 countries. In particular, this study focuses on two specific characteristics of the administrative body: professional and impartial public administration. Professional administration is free from political control in terms of recruitment and promotion. Impartiality indicates the impartial exercise of power.
The dependent variable of this article is national level innovative activity. Unlike previous studies, which tend to focus on a limited aspect of innovation, this study utilizes indicators of innovative activity that are more comprehensive, by using the Global Innovation Index (GII) (Cornell University, INSEAD, & WIPO, Citation2016). We focus on national level innovation outputs: specifically (1) knowledge and technology outputs (e.g., patent applications, scientific and technical articles, number of new businesses, and high-tech exports); and (2) creative outputs (e.g., organizational model creation, creative goods exports, global entertainment and media output, national feature film production, and trademark applications).
We argue that administrative characteristics are important explanatory factors for cross-national variations in innovative activity. In particular, professional civil services free from political control are associated with higher levels of innovative activity (H1). Such positive association comes through low levels of political interference in public administration and the existence of more competent, committed, and stable civil servants hired and promoted through meritocratic recruitment. Likewise, we argue that impartial public administration also tends to be associated with higher innovative activity (H2) because it reduces fear for businesses and other societal actors. We test these propositions using a cross-national data set of administrative characteristics from the Quality of Government Institute (QoG) Expert Survey (Dahlström et al., Citation2015) and the Global Innovation Index (GII) (Cornell University et al., Citation2016). Findings suggest that there is a strong and positive association between administrative characteristics and higher values of national level innovative activity, when controlling for other confounding factors.
This study contributes to the existing literature in at least three ways. First, this study contributes to recent empirical studies of bureaucracies by examining an understudied link between administrative characteristics and national level innovative activity. Second, this study contributes to the innovation literature by focusing on both tangible and intangible aspects of innovation outputs rather than an overly narrow aspect of innovation (e.g., patent applications); furthermore, it contributes to the innovation literature by analyzing more objective innovation measures, rather than subjective measurements such as employee perceptions of innovative behavior and attitude. Third, this study contributes to the increased focus on contextual factors in public management in a cross-national setting (Meier, Rutherford, & Avellaneda, Citation2017; O’Toole & Meier, Citation2015; Yang, Citation2009) and the recent debate over statelessness in the public administration and management literature, bringing the “neglected” state factor back in the analysis (Evans, Rueschemeyer, & Skocpol, Citation1985; Milward et al., Citation2016; Roberts, Citation2018).
This article first presents the theoretical framework for this study. The second section offers the hypotheses tested in this study, while highlighting how administrative characteristics are associated with innovation outputs at the nation level. The third section explains the data and methods of this study, followed by a fourth section containing results and analysis. Finally, this article ends with discussion, conclusions, and limitations.
Theory and hypotheses
Professional public administration
We focus on two core elements of Weberian bureaucracy: professional and impartial public administration. Both administrative characteristics are mostly concerned with the rule of law. While professional administration is concerned with the level of political influence in the recruitment system (Dahlström, Lapuente, & Teorell, Citation2010), impartial administration is about procedural norms in the exercise of government power (Rothstein & Teorell, Citation2008). Professional administration refers to the degree of meritocracy and politicization in the employment system, characterized by merit-based and internal recruitment senior officials rather than political appointees or political network-based recruitment (Dahlström, Lapuente, & Teorell, Citation2012b). Higher levels of professionalism indicate more professionally oriented and politically neutral public administration than politicized administration. The degree of meritocratic recruitment differs across countries (Dahlström et al., Citation2010; Schillemans & van Twist, Citation2016). The recent human resource management reforms in many countries have also contributed to diversify the actual recruitment and promotion practices (Lægreid & Wise, Citation2015) (see in the Appendix.)
We suggest two plausible explanations regarding an association between professional public administration and national level innovative activity. First, meritocratic civil service systems tend to be associated with less corruption, and citizens have more trust when there is less corruption in government (Dahlström, Lapuente, & Teorell, Citation2012a; Fukuyama, Citation1995), which reduces transaction costs for innovative activity (Anokhin & Schulze, Citation2009; DiRienzo & Das, Citation2015). Public employees in more professional bureaucracies tend to be insulated from patronage and political interests (Dahlström et al., Citation2012a; Miller, Citation2000), which reduces corruption levels. Higher levels of corruption reduce citizens’ trust in government procedure, raise transaction costs, and often lead to misallocation of government resources, together disincentivizing innovative activity (Anokhin & Schulze, Citation2009; DiRienzo & Das, Citation2015). Private actors are more comfortable investing in innovation in countries with a professional bureaucracy, because business actors are less likely to resort to bribery, and do not fear the private use of public power. Furthermore, such a business environment contributes to attract more foreign direct investment, which will lead to competition and thus innovation (Fukuyama, Citation1995). However, countries with highly politicized, unprofessional, and biased bureaucracies tend to have more corruption as well as less foreign direct investment and trust (Neshkova & Kostadinova, Citation2012).
Second, governments are more likely to recruit and retain competent and skillful bureaucrats in a professional bureaucracy than they do in a politicized one. Professional bureaucracy can “recruit the best possible personnel.” Therefore, “merit recruitment is the logical means of filling positions with the best qualified personnel” (Peters, Citation2010, p. 83). Such individuals with higher skills are likely to be more motivated to be innovative than are those who are in politicized administrative structures; they might be more likely to learn about new tools and ideas, take a long-term perspective, and more appropriately allocate government resources for innovation. Van der Wal (Citation2017) claims that under professional, dynamic, and ethical bureaucracies, public officials, particularly public managers, promote innovative activity not only in their organizations, but also in society. In contrast, lack of professional public administration reduces chances for the hiring of employees who are knowledgeable and expert in policy areas. Because employment is at the discretion of politicians, politicized bureaucracies tend to be unstable (Cornell, Citation2014) which in turn can be expected to have a negative link with innovation. Accordingly:
H1: Professional public administration is positively associated with national level innovation outputs.
Impartial public administration
Impartial public administration is mainly about procedural norms among public servants. It refers to the impartial exercise of government power and authority (Rothstein & Teorell, Citation2008). Weber states that bureaucracy needs to be impartial, and bureaucrats should be appointed and function as “personally free and subject to authority only with respect to their impersonal official obligations” (1968, p. 333). Citizens should “be treated impartially in the administration of public affairs,” and public servants should “not act in ways that advantage or disadvantage the partisan-political interests of any political party, including the governing party or parties” (Aucoin, Citation2012, p. 179). Impartial administration can assure the government’s “credible commitment” to private actors, insulating public officials from patronage politics (Miller, Citation2000). It also provides consistency and the generalizability of rules and applications, thereby increasing fairness and justice (Peters, Citation2010). These qualities in turn encourage private actors to invest their resources in innovative activity with less fear or uncertainty. In fact, impartiality of public administration can increase private actors’ incentives for innovation by using policy tools, such as legal and administrative regulations and R&D programs, leading to an increase in the overall innovation outputs (Smith, Citation2005). To give examples from entrepreneurship and small business, Nistotskaya and Cingolani (Citation2016) argue that meritocratic recruitment and tenure protection of public officials assure impartiality and stability in the implementation of rules for entrepreneurs. Their work demonstrates a link between meritocratic recruitment and both entrepreneurship and individual choices to engage in new businesses (Nistotskaya, Charron, and Lapuente, Citation2015).
Furthermore, since the late 1980s, public services in general and public procurement in particular has moved from supply-side (e.g., from government regulation) to demand-side approaches (e.g., ideas emanating from citizens, firms, and public organizations) (Petersen, Lember, Scherrer, & Ågren, Citation2016). Research suggests that demand-side approaches can boost innovation outputs in society because demand-side approaches increase communication, interaction and mutual learning, dialogue, diversity, cooperation, and competition among suppliers and buyers, all of which lead innovation in the society (Edquist & Zabala-Iturriagagoitia, Citation2012). In this regard, when bureaucracies are professional and impartial, private and social actors feel freer to ask for more government support for innovation, which encourages more interaction and more innovative activity. Taken together, these insights and findings from the existing literature lead us to hypothesize:
H2: Impartial public administration is positively associated with national level innovation outputs.
Innovation measurement and innovation output
How to measure innovation is an ongoing debate in innovation literature (Arundel & Huber, Citation2013; Bloch & Bugge, Citation2013; Demircioglu & Audretsch, Citation2017b; Meissner, Citation2015; Meissner, Polt, & Vonortas, Citation2017; OECD, Citation2005; Smith, Citation2006). Thus, scholars have not reached agreement as to the best way to measure national level innovation performance. One of the shortcomings of previous studies is that they tend to measure innovation in a relatively restrictive way such as patents or expenditures on R&D. These indicators provide a very limited focus, are relevant to only inventions, and focus too much on business activity (e.g., Shane, Citation1993; Waarts & Van Everdingen, Citation2005). In fact, patent or trademark applications measure only inventions or product innovation, rather than innovative activity and outputs more broadly (Demircioglu & Audretsch, Citation2017b). Instead of focusing a few specific innovation indicators, our study examines a broader range of innovation-related activity both by private and public actors.
We focus on the output side of innovation rather than the input side. Innovation outputs measure the outcomes of innovative activities, while innovation inputs look at factors that enable innovative activity such as institutions (e.g., regulatory environment), human capital and research (e.g., Research & Development), infrastructure (e.g., ICTs), market sophistication (e.g., credit and investment), and business sophistication (e.g., knowledge workers) (Dutta, Lanvin, & Wunsch-Vincent, Citation2014, p. 46). Our interest is not innovation inputs but outputs, because innovation output is a common measure used by most innovation studies (Rinne et al., Citation2012; Smith, Citation2005). Furthermore, innovation input measures tend to be highly correlated to or be a part of commonly used national level control variables such as educational level, government expenditure on R&D, and innovation-related infrastructure. In addition, knowledge and technology output “covers all those variables that are traditionally thought to be the fruits of inventions and/or innovations” (p. 49), while “[t]he role of creativity for innovation is still largely underappreciated in innovation measurement and policy debates” (p. 50) (Dutta et al., Citation2014). We believe that using comprehensive innovation indicators allows us to capture both traditional and less tangible innovation outputs.
Research design
Data collection
Systematic cross-national studies that incorporate administrative characteristics are still limited (Egeberg, Citation2012; Fitzpatrick et al., Citation2011; Sundell, Citation2014). This is partly due to the shortage of comparable cross-national data for public bureaucracy (Fukuyama, Citation2013; Olsen, Citation2006; Sundell, Citation2014). However, the recent development of a unique cross-national data set provides tremendous opportunities to test empirically the relationship between variations in administrative characteristics and socioeconomic outcomes.
We utilize data from the Quality of Government (QoG) Institute Expert Survey II (Dahlström et al., Citation2015), which is a novel cross-national data set of characteristics of public administration collected from nation expert surveys. This survey provides a quantitative assessment of Weberian bureaucracy, which has been neglected in the past (Dahlström et al., Citation2010). The survey was designed based on pioneering work of Evans and Rauch on mapping the structure of bureaucracy in 35 less-developed countries (Evans & Rauch, Citation1999; Rauch & Evans, Citation2000). A group of researchers at the QoG Institute conducted the first version of the survey in 2008–2012, which led to the first Expert Survey data set (Teorell, Dahlström, & Dahlberg, Citation2011). The Expert Survey II was carried out in 2014. This survey collected data from 1,294 nation experts, covering 159 countries. The survey asks for expert perceptions of the current status and characteristics of a nation’s public bureaucracy. The survey questions are mainly centered on administrative characteristics, such as recruitment and career systems, replacement, compensation, policy making and implementation, gender representation, and transparency. The validity of the data has been reinforced by its use in many articles published in highly ranked journals, and its reliability has been examined by previous studies (e.g., Sundell, Citation2014, p. 445).
The main dependent variable is the nation level of innovation outputs, which are obtained from the GII database (Cornell University et al., Citation2014). The GII is a leading reference on innovation at the nation level (Rinne et al., Citation2012). It ranks the innovation performance of countries and economies around the world. The GII project was launched by INSEAD (Institut Européen d’Administration des Affaires) in 2007. The 2014 report covers 143 economies around the world. Data contained in the report were gathered from various existing statistical data. Published annually, the latest version (as of this writing) was released in 2016. The dependent variables are obtained from the online database of the GII (Cornell University et al., Citation2016). We utilized data in the 2014 report for the dependent variables and the 2013 report for control variables.
The data set contains two aspects of innovation: innovation input and innovation output. The innovation input index captures various national factors that enable innovative activity, including institutions, human capital and research, infrastructure, market sophistication, and business sophistication. Innovation output looks at the results of innovative activity, focusing on knowledge and technology outputs and creative outputs. Given the purpose of our research, we focus on innovation outputs. Several academic researchers on innovation have utilized the GII data (Crespo & Crespo, Citation2016; Meissner, Citation2015; Rinne et al., Citation2012; Sohn, Kim, & Jeon, Citation2016; Zhan, Bendapudi, & Hong, Citation2015). We also utilize the QoG Standard Dataset 2017 (Teorell et al., Citation2017)2 and the GII report 2013 (Cornell University et al., Citation2016) for control variables. The independent variables come from the 2014 QoG Expert Survey II, while the dependent variable is obtained from the 2014 GII.
Dependent variables
The dependent variable is the overall level of innovation output in each nation as scored by the GII. Specifically, we look at: (1) knowledge and technology output; and (2) creative output. In each area of innovation, an output score is calculated. GII divides each innovation output score into three subcomponents. The knowledge and technology output score’s subcomponents are: (1) knowledge creation; (2) knowledge impact; and (3) knowledge diffusion. Each subcomponent is composed of four or five individual indicators (see in the Appendix). Each subcomponent score is calculated as the weighted average of its individual indicators. Then, the knowledge and technology output score is calculated as the weighted average of its subcomponent score. The resulting score ranges from 11.2 to 60.9 in the 108 countries in our sample.3 The creative output category consists of three subcomponents: (1) intangible assets; (2) creative goods and services; and (3) online creativity. The creative output score is calculated in a similar way. The creative output score in our sample ranges from 0.6 to 66.1.4 See figures and for the distrubution of each score.
Independent variables
The independent variable is administrative characteristics of civil service. We use original data from the QoG Expert Survey Dataset II to capture these attributes. The first independent variable is professional administration. The data set contains an index of professional administration constructed from the following four questions: (1) “When recruiting public sector employees, the skills and merits of the applicants decide who gets the job”; (2) “When recruiting public sector employees, the political connections of the applicants decide who gets the job”; (3) “The top political leadership hires and fires senior public officials”; (4) “Senior public officials are recruited from within the ranks of the public sector.” Respondents are asked to select their response from 1 (hardly ever) to 7 (almost always). The data set reverses the scale of the second and third questions; therefore, higher values mean more professionalism. The professional public administration index is constructed by using the mean value for each expert’s responses to the four questions.5 Higher values in the index indicate more professionally oriented bureaucrats rather than politically oriented ones.
The second independent variable is impartial public administration. We rely on the index of impartiality contained in the data set. This index measures the degree of impartiality of bureaucracies in decision making. Higher values mean higher impartial exercise of power.6 The index is constructed based on the mean values of the following five survey items: (1) “Firms that provide the most favorable kickbacks to senior officials are awarded public procurement contracts in favor of firms making the lowest bid”; (2) “When deciding how to implement policies in individual cases, public sector employees treat some groups in society unfairly”; (3) “When granting licenses to start up private firms, public sector employees favor applicants with whom they have strong personal contacts”; (4) “Generally speaking, how often would you say that public sector employees today, in your chosen nation, act impartially when deciding how to implement a policy in an individual case?”; and (5) “Hypothetically, let’s say that a typical public sector employee was given the task to distribute an amount equivalent to 1,000 USD per capita to the needy poor in your country. According to your judgement, please state the percentage that would reach: The needy poor.”7 The cross-nation variations in the above two measurements are presented in and in the Appendix.
Control variables
This study controls for other factors that are expected to be correlated to national level innovation outputs. A small sample size does not allow us to include a large number of controls. Therefore, we limit the number of controls to five important factors. We control for: (1) GDP per capita (Current Prices) (ln); (2) GDP growth (%); (3) degree of democracy at the national level; (4) government fractionalization; and (5) number of researchers per million population. The first four variables are obtained from the QoG Standrad Dataset (Teorell et al., Citation2017), and the last variable is from GII report 2013 (Cornell University et al., Citation2016).
We control for GDP per capita and GDP growth, because previous research shows that these variables affect innovation at the national level (Fagerberg & Srholec, Citation2008; Lee, Mudambi, Cano-Kollmann, Oh, & Oh, Citation2016; Wong, Ho, & Autio, Citation2005). Degree of democracy at the national level and government fractionalization may affect the nation level of innovation. As Acemoglu and Robinson (Citation2006) argue, national elites may hamper innovation, because it may erode the advantage of the incumbent political elites and increase chances of their replacement. When political competition is limited, elites may be unwilling to initiate changes in the economy or other institutions. We use a simple dichotomous democracy measurement as well as fractionalization in government.8 The government fractionalization measures “[t]he probability that two deputies picked at random from among the government parties will be of different parties” (Dahlberg, Holmberg, Bo, Khomenko, & Svensson, Citation2017b, p.52).
Because of the high correlation to our independent variables and other control variables, such as GDP per capita, we do not include control variables that are related to input aspects of innovation and resources and infrastructure for innovation, such as government expenditure on R&D, quality of scientific research institutions, and university-industry collaboration in R&D. For instance, Wong et al. (Citation2005) state that some scholars have used either input measures (e.g., R& D expenditures) or output measures (e.g., number of innovations), but not both in the same model. Likewise, Lee et al. (Citation2016) find that innovation input (R&D) and output are highly correlated, as seen in the case of Japan, which is ranked highly for both measures.
The summary statistics of the variables used in our study are reported in . The correlation matrix is reported in . We conducted collinearity diagnostics using VIF based on our main models with two samples (all countries and OECD). The highest variance inflation factor (VIF) score for the independent and control variables in all of the models is 3.41 (GDP per capita). This means that the models do not have problems in terms of multicollinearity. For the purpose of a further robustness check, we ran an analysis for the same model without the variable causing high correlation.
Table 1. Descriptive Statistics.
Table 2. Correlation Matrix.
Empirical strategy
Given the cross-sectional nature of our dataset, our purpose is not to make causal arguments but to identify an empirical association between them. Recall that the dependent variables are interval variables, which are innovation output scores. Given the nature of the dependent variable, we employed ordinary least squares (OLS) regression analysis. The independent variables are two administrative attributes: professional and impartial public administration. Since correlations among the independent variables are high, we were not able to include two independent variables in a single model. Thus, we test the following three models for each of our two independent variables. The first model (Models 1 and 4) investigates the bivariate relationship between administrative characteristics and innovation outputs. The second model (Models 2 and 5) includes control variables that may affect the dependent variables. This tests alternative explanations for the effects on innovative activity. Control variables, including GDP per capita, GDP growth, and democracy measure, are included. The third model (Models 3 and 6) includes further control variables, government fractionalization index and researcher headcounts per population (in million) to show the robustness of our analysis. The fractionalization index was included as an additional control for political competitiveness. We used the researcher headcount variable as an indicator of innovation infrastructure. We ran the same set of models for each of the two dependent variables.
We tested our hypotheses in two samples. One uses the global nation samples, and the other uses only OECD member countries. We split samples and conducted two separate analyses to examine if the association between administrative characteristics and national level innovative activity differs depending on levels of economic development and other unobservable factors. While the OECD samples are relatively homogenous regarding their economic levels, the full range of nation samples is more diverse.
To demonstrate the robustness of our results, we conducted the following robustness strategy. First, we estimated Huber-White sandwich estimators in all main models, responding to issues of heteroscedasticity. Heteroscedasticity-robust standard errors are robust in the presence of heteroscedasticity of unknown form (Wooldridge, Citation2009). Second, we reran all models for each independent variable with a jackknife estimator in order to address the concern of influential observations and skewed distributions of variables in the sample. The jackknife estimator is obtained from the resampling technique, which is similar to a bootstrap, to estimate a bias-reduced estimator (Shao & Tu, Citation1995). Third, we reran the same models without the GDP per capita variable, which is highly correlated to most of our independent variables. There is a possibility that the effects of bureaucratic variables owe to their high correlation to the GDP variable, which is highly associated with innovative activity. Collinearity diagnostics, as shown in VIF values, pose no serious difficulties. However, as a further robustness check, we estimated the same models without GDP per capita to determine whether we obtain similar results with and without the presence of the GDP variable. Results of the robustness check are reported in the Appendix. Fourth, we ran the same models using an OECD nation dummy rather than conducting two separate analyses for all samples and OECD nation samples. Finally, we ran the same models using a single factor variable for two different dependent variables. This tests whether we obtain similar results when we combine two different measurements for innovative activity (i.e., knowledge and technology outputs and creative outputs) as two dependent variables are highly correlated (correlation coefficients are 0.68, with p < 0.0001).
Analysis and results
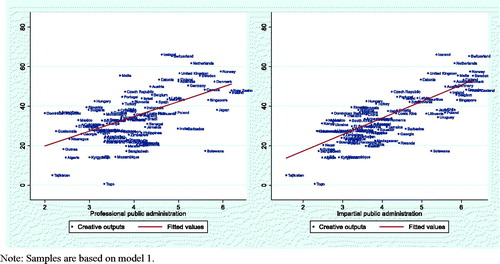
and show a bivariate relationship between administrative characteristics and national levels of innovation outputs. We present these figures mainly to show how these two factors are associated. As shown from these figures, countries with higher levels of professional and impartial public administration tend to record higher levels of innovative activity measured by knowledge and technology outputs as well as creative outputs.
Figure 1. Administrative characteristics, knowledge and technology outputs.
Note: Samples are based on Model 1.
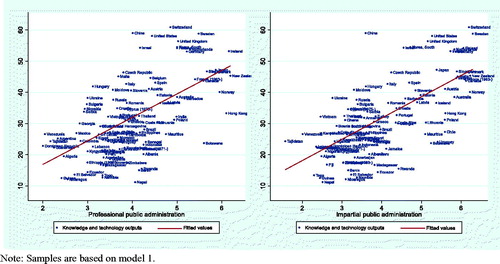
Figure 2. Administrative characteristics and creative outputs.
Note: Samples are based on Model 1.
Knowledge and technology outputs
All nation samples
Having presented scatterplots of the correlation between independent and dependent variables, we now present the results of regression analysis for all nation samples in . As seen from the table, professional and impartial variables consistently have a strong association with the knowledge and technology outputs score (p < 0.01). In the professional model (Models 1–3), the professional administration variable is positive and statistically significant (p < 0.01). Nation levels of innovation should be correlated to economic development and democracy. Higher levels of developed economies tend to have more and higher quality resources and infrastructure for innovation, such as financial resources, good research institutions, and qualified researchers in both the private and public sectors. Therefore, controlling for GDP captures these factors as well. When we add GDP per capita, GDP growth, and democracy measure variables (Model 2), the professional coefficient of public administration is still positive and statistically significant (p < 0.01). In Model 3, we add two further control variables: government fractionalization and number of researchers per million population. The independent variable is still positive and significant (p < 0.01) after controlling for these additional factors.
Table 3. Administrative Characteristics and Knowledge and Technology Outputs Score, Results of OLS Regression Analysis (all nation samples).
In Models 4–6, we test the association between impartial public administration and knowledge and technology outputs. Here, results show a strong association between these two variables. In Model 4, bureaucratic impartiality shows a positive and significant link with innovation outputs (p < 0.01). The direction of the coefficient of the independent variable does not change and reaches statistical significance (p < 0.01 and p < 0.05) in Models 5–6, which include additional control variables. These results suggest countries with higher values of impartial public administration are likely to score higher in knowledge and technology outputs, controlling for confounding factors.
in the Appendix report results of the same model estimations with jackknifed estimates as well as those without GDP per capita. We reran the same models with the jackknifed estimator responding to the concern for influential observation. We also reran the models without GDP per capita to address the concern about the high correlation between this variable and independent variables. Results with jackknifed estimations are almost identical to those in our regular models in terms of direction of coefficients and statistical significance (see ). Coefficients of bureaucratic variables show the same direction, and their statistical significance does not change in our models without GDP per capita, as expected (see ). To summarize the results of the models using all nation samples, results of OLS regression analysis show that professional and impartial public administration are positively associated with innovation measured by technology and knowledge outputs. Bureaucracies with either of these characteristics tend to have higher levels of innovation as a nation, controlling for other factors.
OECD nation samples
reports estimation results of models with only OECD member countries. Recall that we conducted a separate analysis using only OECD nation samples to see if the results change in more developed settings. Professional and impartial bureaucracy are positive and significant (p < 0.01) in our first model (Models 1 and 4). This is the same result as the models with all nation samples. However, these variables lost statistical significance in Models 2–3 and 5–6, which are more restricted. Results suggest that two administrative characteristics are not linked with knowledge and technology outputs among OECD nation samples.
Table 4. Administrative Characteristics and Knowledge and Technology Outputs Score, Results of OLS Regression Analysis (OECD nation samples).
We conducted the same set of robustness checks for OECD nation analysis, namely models with jackknifed estimators, models without the GDP per capita variable, and models using an OECD dummy for all samples. Models with jackknifed estimates show almost identical results with our main models in terms of direction and statistical significance of coefficients of the independent variables (). This confirms the robustness of our results. In models without GDP per capita (), professional bureaucracy is positive and statistically significant (p < 0.01) in all models (Models 1–3). The same goes for impartial bureaucracy (Models 4–6). These results are in contrast to the main models, which show a lack of statistical significant effects for administrative characteristics (). However, this inconsistency is mainly because GDP/capita is highly correlated to professional and impartial administration variables, even in the OECD nation samples. Dropping the GDP/capita variable increases the statistical significance of the independent variables. Finally, reports results of all models when including an interaction term between an OECD dummy and each independent variable rather than conducting separate analysis for OECD nation samples. Results show that the interaction terms are not significant in all models, suggesting that being an OECD member nation does not moderate the relationship between administrative characteristics and knowledge and technology outputs.
Creative outputs
All nation samples
Next, we look at the link between administrative attributes and innovative activity measured by creative outputs in our global sample. Recall that the dependent variable is the creative outputs score, which assesses nation levels of intangible assets, creative goods and services, and online creativity (see in the Appendix). Results of the main models show that professional public administration is positive and statistically significant in Models 1–2 (p < 0.01) (). When we add further control variables to the model, its coefficient is still positive, but its significance drops to p < 0.1 (Model 3). Therefore, whether there is a significant empirical link between professional bureaucracy and creative outputs is uncertain. In Models 4–6, we test how bureaucratic impartiality is associated with innovation. Coefficients of impartiality are positive and significant consistently across all three models (p < 0.01). This means that public administrations, which have more impartiality in decision making, tend to have higher levels of innovative activity.
Table 5. Administrative Characteristics and Creativity Outputs Score, Results of OLS Regression Analysis (all nation samples).
As a robustness check, we repeated the same procedure that we performed for the first dependent variable. Models with jackknifed estimates show almost identical results with respect to bureaucratic impartiality (see in the Appendix). Results of models without GDP per capita also show similar results with our main models (). Impartial bureaucracy is positive and statistically significant (p < 0.01) in Models 5–6. This confirms the robustness of our results. To summarize our analysis of all samples, results suggest that bureaucratic impartiality tends to have a positive influence on innovation operationalized by creative outputs.
OECD nation samples
Next, we look at the results of the same models, but with only the OECD member countries. reports results of OLS regression analysis on creative outputs. Unlike the result from the global sample analysis (), impartial public administration is no longer significant in the most restricted model (Model 6) even though it is significant (p < 0.1) in Model 5. in the Appendix show results of robustness check models, following the same procedure for the knowledge and technology outputs dependent variable. Results suggest that impartial public administration is no longer statistically significant (). Models without GDP/capita show that impartial public administration is positive but only with p < 0.1. Thus, these results demonstrate robustness of lack of statistically significant results in the OECD nation samples.
Table 6. Administrative Characteristics and Creativity Outputs Score, Results of OLS Regression Analysis (OECD nation samples).
Finally, we conduct an analysis using a single variable that sums two dependent variables. Knowledge and technology outputs and creative outputs scores are highly correlated (Cronbach’s α = 0.81). Therefore, we test if we obtain similar results when using a combined dependent variable. in the Appendix shows results of Models 1–6 when using a combined dependent variable. Results confirm the validity of our empirical findings.
Discussion and conclusions
Although there is an increasing number of studies on innovation, analysis for most previous studies occurs at the individual and organizational level (Arundel & Huber, Citation2013; Bloch & Bugge, Citation2013; Demircioglu & Audretsch, Citation2017a; OECD, Citation2005). Although there have been several cross-national studies that examine factors affecting innovation across countries, these studies mostly focus on the effects of national culture on innovation. We still have a very limited empirical understanding of how administrative characteristics are associated with innovative activity. To fill this gap, this cross-national study has empirically examined this understudied link.
Based on previous bureaucracy and innovation literature, we hypothesized that there was an empirical link between administrative attributes and national level innovation outputs. In particular, we examined professional and impartial public administration. The former captures the autonomy of public officials from political control in terms of recruitment and career of civil servants. The latter shows the degree of impartial exercise of power by the administrative body. We argued that both attributes are positively associated with innovative activity. A low degree of political influence in public sector personnel systems encourages societal actors to invest in innovative activity with less fear or uncertainty. Meritocratic recruitment also attracts and retains public officials with more expertise and skills than politicized recruitment systems. Officials with relevant expertise and skills recruited and promoted based on merit are more likely to play significant roles as promoters of innovative activity in society than those in politicized recruitment systems. In impartial bureaucracies, bureaucrats are expected to implement policies with fairness. This, in turn, creates trust among private and nonprofit actors, which positively affects innovation outputs. In addition, a high level of neutrality in administrative decision making deters bureaucrats from corruption. Such conditions should help private and nonprofit actors to be more innovative. Previous social innovation studies support the idea that administrative characteristics encourage successful and sustainable innovation. (Borzaga & Bodini, Citation2014; Mulgan, Citation2006; Mulgan, Tucker, Ali, & Sanders, Citation2007). In addition, government innovation, social innovation, and business innovation are highly and closely related with each other, so they can positively affect each other. Therefore, fostering public and private sector innovation can also lead to social innovation.
The analysis demonstrates that administrative designs matter for the variation in national levels of innovative activity. When using all nation samples, results show that countries with higher levels of professional and impartial public administration are likely to have higher knowledge and technology outputs. When we restrict our samples to OECD member countries, we find that these administrative characteristics are no longer as significant. With respect to the creative outputs, we demonstrate that impartiality is positively correlated to innovation in our global sample analysis, confirming our impartiality hypothesis. When we use OECD samples, we do not find significant relationships between any of the administrative variables and creative outputs. The above results are consistent with findings from previous empirical studies that show a strong empirical link between professional and impartial bureaucracies and social outcomes. This study contributes to previous studies by testing the relationship between administrative characteristics and innovation outputs. This study also has policy implications. Results imply that moving from a professional and impartial bureaucracy to an unprofessional and partial one undermines innovation outputs. Future study should investigate how such gradual shifts in administrative characteristics undermine innovation. This study also adds value to the debate over how to measure innovation. Unlike previous studies which focus on a very limited aspect of innovation, this study examines a broader and more representative range of innovation-related activities both by private and public sector actors. Future research may investigate how and why other organizational or cultural factors affect such broader innovation measures.
It is important to recognize the limitations of this research. First, given the cross-national nature of our dataset, we do not claim a causal relationship. Assessing independent impacts of administrative attributes on innovative activity is challenging since administrative attributes correlate with other factors that influence innovation such as levels of economic development, public expenditure on R&D, and infrastructure. Furthermore, administrative characteristics do not frequently change over time, which also makes causal analysis difficult. Therefore, given the current status of literature and data availability, our aim is to suggest a statistical correlation between administrative attributes and innovative activity. Our analysis shows results of a snapshot at a given time period, without considering factors that change across time (Evans, Citation2002).
Second, we did our best to incorporate various control factors into our analysis with the limited sample size. However, we cannot completely rule out the possibility that other unobservable national level factors affect the administrative attributes–innovative activity relationship. Third, although the comprehensive innovation indicators that we have used have many advantages compared to narrower innovation measurements, such broad indicators also have some limitations. For instance, the indicators we use also include some variables that are not significantly related to innovation, such as video uploads on YouTube and Wikipedia edits. Nevertheless, as seen in the Appendix, such variables are only a small part of the overall output scores. Fourth, the relationship between administrative attributes and innovative activity has a hierarchical nature. Various societal actors are engaged in such activity within the context provided by bureaucracy, such as less politicized implementation of laws and policies and impartial exercise of public authority. Therefore, in order to assess the impact of bureaucratic attributes on innovation, a hierarchical model would be more appropriate than a nonhierarchical model. These weaknesses should be compensated further by testing the external validity of the results by conducting subnational studies, in which researchers could account for more variables as well as collect and analyze hierarchical and time series data of administrative characteristics and more novel ways of measuring innovation outcomes.
With awareness of the above limitations, our study nonetheless contributes to the understanding of the bureaucratic attributes–innovative activity relationship. Large-scale data collection on comparative bureaucratic behavior is still in its infancy, and there is a shortage of quantitative comparative research (Jeannot, Van de Walle, & Hammerschmid, Citation2018; Van de Walle, Hammerschmid, Oprisor, & Stimac, Citation2016; Wynen & Verhoest, Citation2016). Future study should undertake the above tasks as data become available.
Notes
Additional information
Funding
Notes on contributors
Kohei Suzuki
Kohei Suzuki, The Quality of Government Institute, Department of Political Science, University of Gothenburg, Sweden. [email protected]
Mehmet Akif Demircioglu
Mehmet Akif Demircioglu, Lee Kuan Yew School of Public Policy, National University of Singapore. [email protected].
Notes
1 See, for example, national culture (Kaasa, Citation2017; Kaasa & Vadi, Citation2010; Rinne et al., Citation2012; Shane Citation1993; Waarts & Van Everdingen, Citation2005); social capital (Aragón Amonarriz, Iturrioz, Narvaiza, & Parrilli (Citation2017); Kaasa, Parts, & Kaldaru, Citation2012); corruption (DiRienzo & Das, Citation2015); economic development (Raghupathi & Raghupathi, Citation2017); education level (Varsakelis, Citation2006); various governance indicators (Broberg, McKelvie, Short, Ketchen, & Wan, Citation2013; Rodríguez-Pose & Di Cataldo, Citation2014; Wang, Citation2013).
2 As for the data year of control variables from Teorell et al., (Citation2017), the dataset mainly uses data from 2013. If data for 2013 are missing, data for 2014 are included. When no data exist for 2014, data for 2012 are included.
3 Number of samples is based on Model 1, with the knowledge and technology outputs as a dependent variable.
4 Number of samples is based on Model 1, with creative outputs as a dependent variable.
5 Please see the QoG Expert Survey 2015 Codebook (Dahlström et al., Citation2015).
6 Impartiality is defined as “[w]hen implementing laws and policies, government officials shall not take into consideration anything about the citizen/case that is not beforehand stipulated in the policy or the law” (Rothstein & Teorell, Citation2008, p.170).
7 Please see the QoG Expert Survey 2015 Codebook (Dahlström et al., Citation2015).
8 We tested the mean of the Freedom House and Polity scales, which ranges from 0 to 10, contained in the QoG Basic Dataset 2017 (Dahlberg, Holmberg, Bo, Khomenko, & Svensson, Citation2017a). However, the variable is highly correlated to bureaucratic impartiality (pairwise correlation coefficient is 0.61). Therefore, we decided to use a dichotomous variable for democracy (the highest correlation coefficient, which is one with impartiality is 0.46).
References
- Acemoglu, D., & Robinson, J. A. (2006). Economic backwardness in political perspective. American political science review, 100(01), 115–131.
- Anokhin, S., & Schulze, W. S. (2009). Entrepreneurship, innovation, and corruption. Journal of Business Venturing, 24(5), 465–476.
- Aragón Amonarriz, C., Iturrioz, C., Narvaiza, L., & Parrilli, M. D. (2017). The role of social capital in regional innovation systems: Creative social capital and its institutionalization process. Papers in Regional Science. doi:10.1111/pirs.12329
- Arundel, A., & Huber, D. (2013). From too little to too much innovation? Issues in measuring innovation in the public sector. Structural change and economic dynamics, 27, 146–159.
- Aucoin, P. (2012). New political governance in Westminster systems: Impartial public administration and management performance at risk. Governance, 25(2), 177–199.
- Baker, N. B. (2016). Transaction costs in public–private partnerships: The weight of institutional quality in developing countries revisited. Public Performance & Management Review, 40(2), 431–455. doi:10.1080/15309576.2016.1244092
- Bloch, C., & Bugge, M. M. (2013). Public sector innovation—From theory to measurement. Structural change and economic dynamics, 27, 133–145.
- Boräng, F., Nistotskaya, M., & Xezonakis, G. (2017). The quality of government determinants of support for democracy. Journal of Public Affairs, 17(1–2), e1643.
- Borzaga, C., & Bodini, R. (2014). What to make of social innovation? Towards a framework for policy development. Social Policy and Society, 13(3), 411–421.
- Broberg, J. C., McKelvie, A., Short, J. C., Ketchen, D. J., & Wan, W. P. (2013). Political institutional structure influences on innovative activity. Journal of Business Research, 66(12), 2574–2580.
- Cantwell, J. (2005). Innovation and competitiveness (pp. 543–567): Nueva York, Oxford University Press.
- Carlino, G. A. (2001). Knowledge spillovers: cities’ role in the new economy. Business Review Q, 4, 17–24.
- Charron, N., Dahlström, C., & Lapuente, V. (2016). Measuring meritocracy in the public sector in Europe: a new national and sub-national indicator. European Journal on Criminal Policy and Research, 22(3), 499–523.
- Cornell University, INSEAD, & WIPO. (2014). The Global Innovation Index 2014: The Human Factor In Innovation Retrieved from https://www.globalinnovationindex.org/userfiles/file/reportpdf/GII-2014-v5.pdf
- Cornell University, INSEAD, & WIPO. (2016). The Global Innovation Index. Retrieved from https://www.globalinnovationindex.org/analysis-indicator
- Cornell, A. (2014). Why bureaucratic stability matters for the implementation of democratic governance programs. Governance, 27(2), 191–214.
- Cornell, A., & Grimes, M. (2015). Institutions as incentives for civic action: Bureaucratic structures, civil society, and disruptive protests. The Journal of Politics, 77(3), 664–678.
- Crespo, N. F., & Crespo, C. F. (2016). Global innovation index: Moving beyond the absolute value of ranking with a fuzzy-set analysis. Journal of Business Research, 69(11), 5265–5271.
- Dahlberg, S., Holmberg, S., Bo, R., Khomenko, A., & Svensson, R. (2017a). The Quality of Government Basic Dataset, version Jan17. Retrieved from: http://qog.pol.gu.se/data/datadownloads/qogbasicdata
- Dahlberg, S., Holmberg, S., Bo, R., Khomenko, A., & Svensson, R. (2017b). The Quality of Government Basic Dataset, version Jan17: Codebook. Retrieved from: http://qog.pol.gu.se/data/datadownloads/qogbasicdata
- Dahlström, C., & Lapuente, V. (2017). Organizing Leviathan: Politicians, Bureaucrats, and the Making of Good Government. Cambridge, UK: Cambridge University Press.
- Dahlström, C., Lapuente, V., & Teorell, J. (2010). Dimensions of bureaucracy. A cross-national dataset on the structure and behavior of public administration. QoG Working Paper Series, 13, 3–59.
- Dahlström, C., Lapuente, V., & Teorell, J. (2012a). The merit of meritocratization: Politics, bureaucracy, and the institutional deterrents of corruption. Political Research Quarterly, 65(3), 656–668.
- Dahlström, C., Lapuente, V., & Teorell, J. (2012b). Public administration around the world. In S. Holmberg & B. Rothstein (Eds.), Good Government: The Relevance of Political Science (40–67). Cheltenham, UK: Edward Elgar Publishing.
- Dahlström, C., Teorell, J., Dahlberg, S., Hartmann, F., Lindberg, A., & Nistotskaya, M. (2015). The QoG expert survey dataset II. Gothenburg, Sweden: Quality of Government Institute.
- Damanpour, F. (1996). Bureaucracy and innovation revisited: Effects of contingency factors, industrial sectors, and innovation characteristics. The Journal of High Technology Management Research, 7(2), 149–173.
- Demircioglu, M. A., & Audretsch, D. B. (2017a). Conditions for innovation in public sector organizations. Research policy, 46(9), 1681–1691.
- Demircioglu, M. A., & Audretsch, D. B. (2017b). Public sector innovation: the effect of universities. The Journal of Technology Transfer, 1–19.
- DiRienzo, C., & Das, J. (2015). Innovation and role of corruption and diversity: A cross-country study. International Journal of Cross Cultural Management, 15(1), 51–72.
- Dougherty, D., & Corse, S. M. (1995). When it comes to product innovation, what is so bad about bureaucracy? The Journal of High Technology Management Research, 6(1), 55–76.
- Dutta, S., Lanvin, B., & Wunsch-Vincent, S. (2014). The Global Innovation Index 2014: WIPO.
- Edquist, C., & Zabala-Iturriagagoitia, J. M. (2012). Public Procurement for Innovation as mission-oriented innovation policy. Research policy, 41(10), 1757–1769.
- Egeberg, M. (2012). How Bureaucratic Structure Matters: An Organizational Perspective. In B. G. Peters & J. Pierre (Eds.), The SAGE handbook of public administration (pp. 157–168). London: SAGE Publications Ltd.
- Evans, M. K. (2002). Practical business forecasting. Oxford, UK: John Wiley & Sons.
- Evans, P., & Rauch, J. E. (1999). Bureaucracy and growth: A cross-national analysis of the effects of “Weberian” state structures on economic growth. American Sociological Review, 64(5), 748–765.
- Evans, P. B., Rueschemeyer, D., & Skocpol, T. (1985). Bringing the state back in. Cambridge, UK: Cambridge University Press.
- Fagerberg, J., & Godinho, M. M. (2005). Innovation and catching-up. The Oxford Handbook of Innovation. Oxford University Press, New York, 514–543.
- Fagerberg, J., & Srholec, M. (2008). National innovation systems, capabilities and economic development. Research policy, 37(9), 1417–1435.
- Fernández-Carro, R., & Lapuente-Giné, V. (2016). The Emperor’s clothes and the Pied Piper: Bureaucracy and scientific productivity. Science and Public Policy, 43(4), 546–561.
- Fitzpatrick, J., Goggin, M., Heikkila, T., Klingner, D., Machado, J., & Martell, C. (2011). A new look at comparative public administration: Trends in research and an agenda for the future. Public Administration Review, 71(6), 821–830.
- Fukuyama, F. (1995). Trust: The social virtues and the creation of prosperity. New York, NY: Free Press Paperbacks.
- Fukuyama, F. (2013). What is governance? Governance, 26(3), 347–368.
- Jeannot, G., Van de Walle, S., & Hammerschmid, G. (2018). Homogeneous national management policies or autonomous choices by administrative units? Inter-and intra-country management tools use variations in European central government administrations. Public Performance & Management Review, 1–22.
- Kaasa, A. (2017). Culture and innovation: Evidence from the European union and neighbouring countries. Tijdschrift voor economische en sociale geografie, 108(1), 109–128. doi:10.1111/tesg.12194
- Kaasa, A., Parts, E., & Kaldaru, H. (2012). The role of human and social capital for innovation in catching-up economies. In E. G. Carayannis, U. Varblane, & T. Roolaht (Eds.), Innovation Systems in Small Catching-Up Economies: New Perspectives on Practice and Policy (pp. 259–276). New York, NY: Springer New York.
- Kaasa, A., & Vadi, M. (2010). How does culture contribute to innovation? Evidence from European countries. Economics of innovation and new technology, 19(7), 583–604.
- Lægreid, P., & Wise, L. R. (2015). Transitions in civil service systems: Robustness and flexibility in human resource management. In F. M. van der Meer, J. C. N. Raadschelders & T. A. J. Toonen (eds), Comparative Civil Service Systems in the 21st Century (pp. 203–222). New York, NY: Palgrave.
- Lee, A., Mudambi, R., Cano-Kollmann, M., Oh, C. H., & Oh, C. H. (2016). An analysis of Japan’s connectivity to the global innovation system. Multinational Business Review, 24(4).
- Lodge, M., & Gill, D. (2011). Toward a new era of administrative reform? The myth of post‐NPM in New Zealand. Governance, 24(1), 141–166.
- Meier, K. J., Rutherford, A., & Avellaneda, C. N. (Eds.). (2017). Comparative Public Management: Why National, Environmental, and Organizational Context Matters. Washington, D.C.: Georgetown University Press.
- Meissner, D. (2015). Measuring Innovation-A Discussion of Innovation Indicators at the National Level.
- Meissner, D., Polt, W., & Vonortas, N. S. (2017). Towards a broad understanding of innovation and its importance for innovation policy. The Journal of Technology Transfer, 42(5), 1184–1211.
- Miller, G. (2000). Above politics: Credible commitment and efficiency in the design of public agencies. Journal of Public Administration Research and Theory, 10(2), 289–328. doi:10.1093/oxfordjournals.jpart.a024271
- Milward, B., Jensen, L., Roberts, A., Dussauge‐Laguna, M. I., Junjan, V., Torenvlied, R., … Durant, R. (2016). Is public management neglecting the state? Governance, 29(3), 311–334.
- Mortensen, P. S., & Bloch, C. W. (2005). Oslo Manual: Guidelines for Collecting and Interpreting Innovation Data (3rd ed.). Paris: OECD Publishing.
- Mulgan, G. (2006). The process of social innovation. Innovations: technology, governance, globalization, 1(2), 145–162.
- Mulgan, G., Tucker, S., Ali, R., & Sanders, B. (2007). Social innovation: what it is, why it matters and how it can be accelerated.
- Neshkova, M. I., & Kostadinova, T. (2012). The effectiveness of administrative reform in new democracies. Public Administration Review, 72(3), 324–333.
- Nistotskaya, M., Charron, N., & Lapuente, V. (2015). The wealth of regions: quality of government and SMEs in 172 European regions. Environment and Planning C: Government and Policy, 33(5), 1125–1155.
- Nistotskaya, M., & Cingolani, L. (2016). Bureaucratic structure, regulatory quality, and entrepreneurship in a comparative perspective: Cross-sectional and panel data evidence. Journal of Public Administration Research and Theory, 26(3), 519–534.
- O’Toole, L. J., & Meier, K. J. (2015). Public management, context, and performance: In quest of a more general theory. Journal of Public Administration Research and Theory, 25(1), 237–256.
- OECD. (2005). Oslo Manual: Guidelines for Collecting and Interpreting Innovation Data, 3rd Edition Retrieved from http://dx.doi.org/10.1787/9789264013100-en
- Olsen, J. P. (2006). Maybe it is time to rediscover bureaucracy. Journal of Public Administration Research and Theory, 16(1), 1–24.
- Osborne, D., & Gaebler, T. (1992). Reinventing government: How the entrepreneurial spirit is transforming the public sector: Reading, mass. Reading, MA: Addison-Wesley.
- Osborne, D., & Plastrik, P. (1997). Banishing Bureaucracy: The Five Strategies for Reinventing Government: ERIC.
- Park, J., Lee, K.-H., & Kim, P. S. (2016). Participative management and perceived organizational performance: The moderating effects of innovative organizational culture. Public Performance & Management Review, 39(2), 316–336.
- Peters, B. G. (2010). The Politics of Bureaucracy–an introduction to comparative public administration (6 utgåvan). New York, NY: Routledge.
- Petersen, O. H., Lember, V., Scherrer, W., & Ågren, R. (2016). 10 The Role of Private Actors in Public Sector Innovation Enhancing Public Innovation by Transforming Public Governance (pp. 197–214). New York, NY: Cambridge University Press.
- Pianta, M. (2006). Innovation and Employment. In J. Fagerberg & D. C. Mowery (Eds.), The Oxford handbook of innovation. New York, NY: Oxford university press.
- Raghupathi, V., & Raghupathi, W. (2017). Innovation at country-level: association between economic development and patents. Journal of Innovation and Entrepreneurship, 6(1), 4.
- Rauch, J. E., & Evans, P. B. (2000). Bureaucratic structure and bureaucratic performance in less developed countries. Journal of public economics, 75(1), 49–71.
- Richardson, A., Audretsch, D. B., Aldridge, T., & Nadella, V. K. (2016). Radical and Incremental Innovation and the Role of University Scientist Essays in Public Sector Entrepreneurship (pp. 131–207). Switzerland: Springer.
- Rinne, T., Steel, G. D., & Fairweather, J. (2012). Hofstede and Shane revisited: The role of power distance and individualism in national-level innovation success. Cross-cultural research, 46(2), 91–108.
- Roberts, A. (2018). The aims of public administration: Reviving the classical view. Perspectives on Public Management and Governance, 1(1), 73–85. doi:10.1093/ppmgov/gvx003
- Rodríguez-Pose, A., & Di Cataldo, M. (2014). Quality of government and innovative performance in the regions of Europe. Journal of Economic Geography, 15(4), 673–706.
- Rothstein, B., & Teorell, J. (2008). What is quality of government? A theory of impartial government institutions. Governance, 21(2), 165–190.
- Schillemans, T., & van Twist, M. (2016). Coping with complexity: Internal audit and complex governance. Public Performance & Management Review, 40(2), 257–280. doi:10.1080/15309576.2016.1197133
- Schuster, C. (2016). What causes patronage reform? It depends on the type of civil service reform. Public Administration, 94(4), 1094–1104.
- Shane, S. (1993). Cultural influences on national rates of innovation. Journal of Business Venturing, 8(1), 59–73.
- Shao, J., & Tu, D. (1995). The jackknife and bootstrap. New York: Springer.
- Smith, K. (2005). Economic infrastructures and innovation systems. In C. Edquist (Ed.), Systems of innovation: Technologies, institutions and organisations (pp. 86–106). New York, NY: Routledge.
- Smith, K. H. (2006). Measuring Innovation. In F. Jan & C. M. David (Eds.), The Oxford Handbook of Innovation. New York, NY: Oxford UniversityPress.
- Sohn, S. Y., Kim, D. H., & Jeon, S. Y. (2016). Re-evaluation of global innovation index based on a structural equation model. Technology Analysis & Strategic Management, 28(4), 492–505.
- Sundell, A. (2014). Are formal civil service examinations the most meritocratic way to recruit civil servants? Not in all countries. Public Administration, 92(2), 440–457.
- Teorell, J., Dahlberg, S., Holmberg, S., Rothstein, B., Khomenko, A., & Svensson, R. (2017). The Quality of Government Standard Dataset, version Jan17. Retrieved from: http://qog.pol.gu.se/data/datadownloads/qogstandarddata
- Teorell, J., Dahlström, C., & Dahlberg, S. (2011). The QoG Expert Survey Dataset. University of Gothenburg: The Quality of Government Institute.
- Van de Walle, S., Hammerschmid, G., Oprisor, A., & Stimac, V. (2016). Comparative Research in Public Administration and the Contribution of the COCOPS Top Executive Survey. Public Administration Reforms in Europe: The View from the Top, 12.
- van der Wal, Z. (2017). The 21st Century Public Manager. London: Macmillan Education UK.
- Varsakelis, N. C. (2006). Education, political institutions and innovative activity: A cross-country empirical investigation. Research policy, 35(7), 1083–1090.
- Verspagen, B. (2005). Innovation and economic growth. In J. Fagerberg & D. C. Mowery (Eds.), Oxford Handbook of Innovation. New York, NY: Oxford University Press.
- Waarts, E., & Van Everdingen, Y. (2005). The influence of national culture on the adoption status of innovations: An Empirical Study of Firms Across Europe. European Management Journal, 23(6), 601–610.
- Wang, C. (2013). Can institutions explain cross country differences in innovative activity? Journal of Macroeconomics, 37, 128–145.
- Wong, P. K., Ho, Y. P., & Autio, E. (2005). Entrepreneurship, innovation and economic growth: Evidence from GEM data. Small business economics, 24(3), 335–350.
- Wooldridge, J. M. (2009). Introductory econometrics: a modern approach. Australia: South-Western Cengage Learning.
- Wynen, J., & Verhoest, K. (2016). Internal performance-based steering in public sector organizations: Examining the effect of organizational autonomy and external result control. Public Performance & Management Review, 39(3), 535–559.
- Yang, K. (2009). American public administration: Are we prepared for the challenges? Public Performance & Management Review, 32(4), 579–584.
- Zhan, S., Bendapudi, N., & Hong, Y. Y. (2015). Re‐examining diversity as a double‐edged sword for innovation process. Journal of Organizational Behavior, 36(7), 1026–1049.
Appendix
Figure A1. Percent summary of the knowledge and technology outputs scores.
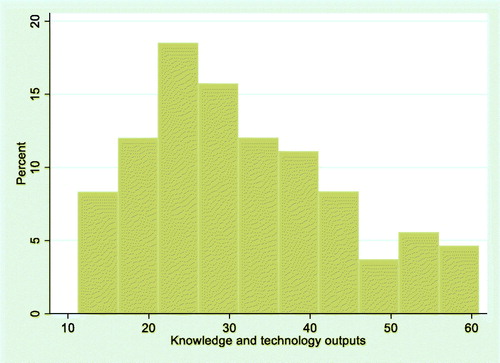
Figure A2. Percent summary of the creative outputs score.
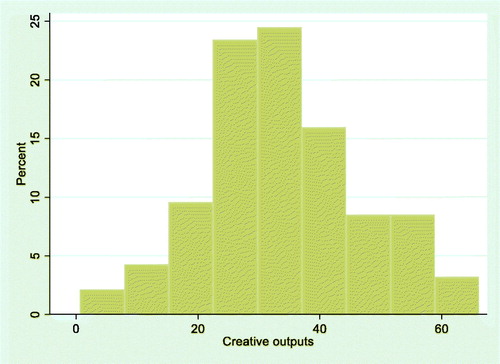
Figure A3. Variations in professional public administration.
Note: A total of 108 countries in Model 1 are included in the above figure.
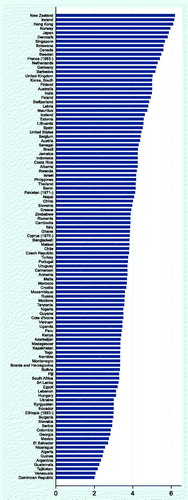
Figure A4. Variations in impartial public administration.
Note: A total of 107 countries in Model 4 are included in the above figure.
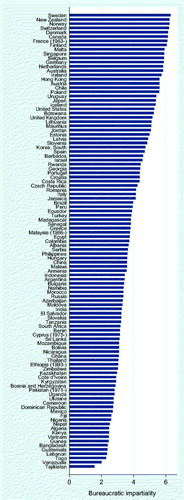
Table A1. List of Indicators Included in the Dependent Variables.
Table A2. Administrative Characteristics and Knowledge and Technology Outputs Score, Results of OLS Regression Analysis (all samples, jackknifed estimates).
Table A3. Administrative Characteristics and Knowledge and Technology Outputs Score, Results of OLS Regression Analysis (all samples, without GDP per capita).
Table A4. Administrative Characteristics and Knowledge and Technology Outputs Score, Results of OLS Regression Analysis (OECD samples, jackknifed estimates).
Table A5. Administrative Characteristics and Knowledge and Technology Outputs Score, Results of OLS Regression Analysis (OECD samples, without GDP per capita).
Table A6. Administrative Characteristics and Knowledge and Technology Outputs Score, Results of OLS Regression Analysis (all samples with OECD dummy).
Table A7. Administrative Characteristics and Creative Outputs Score, Results of OLS Regression Analysis (all samples, jackknifed estimates).
Table A8. Administrative Characteristics and Creative Outputs Score, Results of OLS Regression Analysis (all samples, without GDP per capita).
Table A9. Administrative Characteristics and Creative Outputs Score, Results of OLS Regression Analysis (OECD samples, jackknifed estimates).
Table A10. Administrative Characteristics and Creative Outputs Score, Results of OLS Regression Analysis (OECD samples, without GDP per capita).
Table A11. Administrative Characteristics and Creative Outputs Score, Results of OLS Regression Analysis (all samples with OECD dummy).
Table A12. Administrative Characteristics and Combined Innovative Outputs Score, Results of OLS Regression Analysis (all nation samples).