
Abstract
Based on good experience with Raman systems in general and the µRA systems in particular, we try to expand the capabilities and possible applications of Raman spectroscopy. A central aspect is the excitation wavelength since signal intensity and fluorescence background depend on that. Besides the common 532-nm laser (green), we used a 660-nm (red) and 405-nm (blue) laser, hence the name µRA-RGB. All three systems share the same basic principle (fiber coupling between laser, Raman head, and spectrometer) and only differ because of necessary adjustments for the excitation wavelength used, like the laser edge filter. As the original µRA system has already proved its capability to simultaneously detect all six hydrogen isotopologues, this first RGB study was limited to H2, D2, and equilibrated mixtures of both. With one of Tritium Laboratory Karlsruhe’s proven LARA systems connected to the same gas mixing loop system, comparing the µRA systems against it was possible. This paper shows the results of the measurement campaign comparing all three µRA systems (405-, 532-, 660-nm excitation wavelengths) and the comparison to the well-established large Raman systems (LARA, 532 nm).
I. INTRODUCTION
The previously described µRA systemCitation1 has proved its capabilities und usefulness for more than 1 year after being integrated into different facilities of the Tritium Laboratory Karlsruhe (TLK) infrastructure.Citation2 While adapting a new concept of complete fiber coupling and highly integrated optics, compared to the older large Raman (LARA) systems,Citation3 the classical excitation wavelength of 532 nm remained unchanged. Having the advantage of already knowing what to expect in terms of Raman spectrum for all six hydrogen isotopologues, the question whether or not a deviating excitation wavelength would be beneficial is still open.
While shorter wavelengths (blue) will lead to a gain in Raman intensity in general, a higher level of fluorescence in optical elements (lenses, windows, fibers) also will be produced, obscuring the Raman signal.Citation4 Going to a longer excitation wavelength (red), fluorescence should be reduced, but Raman intensity will be as well. The overall question and motivation for the measurements presented in this paper are: Is a green laser already the optimal tradeoff or can we improve µRA? With the possibility given by the µRA setup of using the same optical elements (windows, lenses, fibers, adjusted spectrometers, and filters), a high degree of comparability was ensured to test three different excitation wavelengths (405, 532, and 660 nm) with otherwise unchanged conditions.
Connecting all three µRA systems together with an available LARA system to a H2/D2 gas mixing loop, cross testing to determine the achievable level of detection (LoD) of each system for H2, D2, and HD was possible. With the proven reliability of the µRA components and the full tritium compatibility of all the µRA systems, these results can be transferred to tritiated molecules (HT, DT, and T2).
II. HARDWARE DESCRIPTION
All the µRA systems follow the same design by combining a compact laser module with a highly integrated spectrometer/detector combination. The gas interface consists of a DN16CF flange with window (vacuum seal) and focusing lens. All other optics (e.g., laser line filter) are housed in a directly attached Raman head. The µRA system uses λ-beam laser modules (RGB Lasersystems), spectrometers of the QE-Pro line (OceanInsight), and a Raman head/window combination (Spectra Solutions Inc.). The laser/head (excitation side) are coupled by a single 100-µm fiber, and the head/spectrometer (collection side) are coupled by seven 100-µm fibers (six-around-1 round to linear arrangement). A detailed description of the µRA system can be found in CitationRef. 1. summarizes the differences for the systems using a red (µRA-red) or a blue (µRA-blue) laser module in comparison to the µRA-green system.
TABLE I Summary of Specifications for All Three µRA Systems
III. EXPERIMENTAL PROCEDURE
All three µRA systems were connected via a manifold to a scroll pump for evacuation of the system (<0.05 mbar) and to a pressure sensor (MKS 902B piezo, gas species–independent, 0.1 to 1000 mbar). Additionally, the manifold was connected to a common gas supply. This ensured that all three µRA systems were supplied with identical gases or gas mixtures. Single gases (H2 and D2) were supplied via Linde MiniCan bottles (purity 5.0), while gases for measurements of mixtures (H2/HD/D2) were supplied via the RACOON system at TLK (CitationRef. 5). The RACOON system was used because it is already connected to a gas supply, providing a safe interface for H2/D2 as well pressure instrumentation and a catalyst for proper HD production. For single gas measurements, the common vacuum manifold was evacuated and filled to the desired pressure from a MiniCan bottle. The series of measurements started with the highest pressure set point, and the gas was pumped down for each lower set point. For measurements with (H2/HD/D2) mixtures, the common vacuum manifold was filled via the RACOON loop to the highest pressure and pumped down for lower pressure set points. At each pressure set point, measurements with all three µRA systems were performed prior to further pumping down.
For comparison between the µRA and LARA, we used the system connected to the RACOON loop. LARA uses a 2-W, 532-nm laser (Laser Quantum, gem2W), high throughput spectrometer (Princeton Instruments, Acton SP-2750), and a separate, large active area detector (Princeton Instruments, Pixis 400B). Besides the different hardware, LARA uses a 90-deg Raman setup with free space optics, while the µRA relies on a fiber-coupled 180-deg Raman geometry.
IV. MEASUREMENTS
With the setup and procedure described in Secs. II and III, we first determined the background of each system to further subtract this from a spectrum. As background, we refer to a spectrum with the laser switched on, but the sample volume evacuated. What remains is mainly the fluorescence signal of the fibers, optics, and the window, as well as reflections/fluorescence on the inner walls of the sample volume. Background measurements were taken with the exact same settings as any other measurement. After accumulating approximately 5 days of spectra, these were averaged to smoothen fluctuations, large events caused by cosmic rays, etc. The resulting spectrum for each of the three systems is shown in .
Fig. 1. Background spectra of all three µRA systems. The spectra displayed represent an averaged signal from approximately 5 days of measurement with 1 spectrum/min showing mainly the fluorescence signal of the optical path and reflections and fluorescence inside the sample volume. The position of relevant hydrogen isotope Raman signals is indicated.
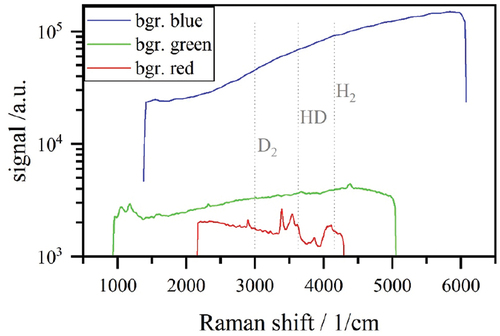
With these measurements, the expectedCitation4 increase in fluorescence signal when decreasing the excitation wavelength was confirmed. For µRA-red, we found the background spectrum to contain a distinct structure around 3500 cm−1, which is related to the surface of the stainless steel sample volume but not further investigated for this work. This structure will limit the sensitivity (LoD) of the system significantly as is shown later. µRA green and µRA-blue both did not exhibit any significant structure in the background spectrum, but have in general a stronger background level, and therefore noise.
Following the background measurements, characterization measurements for each of the three µRA systems were started. A pressure series usually started at 500 mbar [H2 or D2 or (H2/HD/D2) mixtures] with stepwise evacuation to 100, 50, 25, 10, 5, and 2.5 mbar. At each step, a series of 60 spectra (Raman measurements) were taken with an acquisition time of 3 × 20 s (in spectrometer averaging for more stable signal output) with each of the three connected µRA systems.
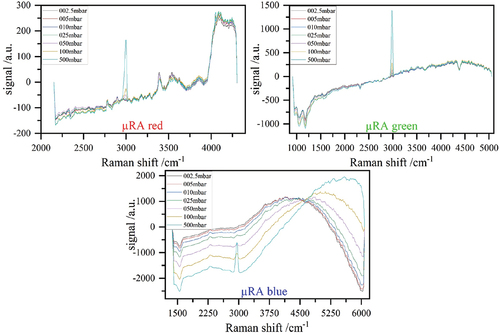
From these measurements, all parameters for a complete characterization of each µRA system were obtained. As an example, the spectra of each system (with the background signal subtracted for better visibility of the Raman signals) responding to a decreasing D2 pressure are shown in . The larger fluctuation of the fluorescence background for the blue laser is not fully understood at this point and is still subject to further investigation. Possible sources might be an unstable laser source or the formation of defects (color centers) in the excitation fiber.
Fig. 2. Response of each µRA system (red, green, and blue) to a varying D2 pressure in the sample volume. Background is subtracted for better visibility of the Raman signal.
As a first step for characterization, the signal-to-noise ratio (SNR) of each system was determined for all hydrogen isotopologues (H2, D2, and HD). The SNR is defined as the signal at a certain pressure divided by the 1σ noise of the empty (background) measurement (SNR = signalpressure/noiseempty). All three µRA systems showed a good linearity, which made it possible to easily extract partial pressures from the Raman signal assuming there was only H/D/T in the gas sample. An example of such a linearity plot is given in for measurements with H2. By applying a linear fit function and setting the SNR ≥ 3, a lower LoD could be determined, as shown in . A SNR ≥ 3 ultimately corresponds to a 3σ uncertainty level, hence a clear signal from the Raman measurements with little probability of being caused by random noise.
Fig. 3. SNR of all three µRA systems as a function of pressure showing a good linear response for all systems.
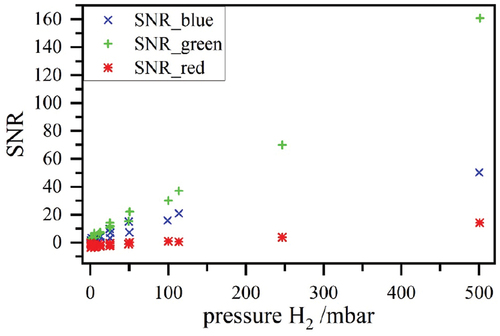
Fig. 4. LoD derived for a SNR ≥ 3 for all three µRA systems. For µRA-red, the structure in the background signal () limits the LoD, especially for H2.
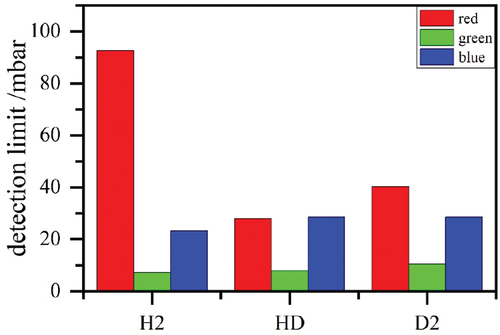
From it can be concluded that the µRA-green system is best suited for the determination of all six hydrogen isotopologues with the given hardware and geometry, providing the best tradeoff between the fluorescence background and Raman signal of all three systems. The structure-rich background signal of µRA-red had a negative influence on the LoD, especially for H2, while the µRA-blue system was basically limited in LoD by the large fluorescence background induced by the shorter laser wavelength. Similar to µRA-green, the µRA-blue system showed a more constant LoD despite a strong increase in the background signal in the region of the signal of H2/HD/D2.
As explained in Sec. III, one of TLK’s large Raman systemsCitation3 (LARA) was readily attached to the same gas mixing loop µRA used for measurements of equilibrated H2/HD/D2 gas samples enabling a comparison between µRA and LARA. For comparability, we limited the measurements to µRA-green using the same laser wavelength as LARA.
A summary in terms of LoD is given in . Using the same laser power (µRA laser at maximum power of 0.2 W, LARA laser limited to 0.2-W output power), µRA achieved a better (= lower) LoD. With its 90-deg Raman setup, LARA suppressed the fluorescence background effectively, but needed a sophisticated alignment of two independent light paths at the submillimeter level for best performance, while µRA’s 180-deg arrangement was more robust but fluorescence had to be taken care of.
Fig. 5. Comparison of µRA-green with the the LARA system.
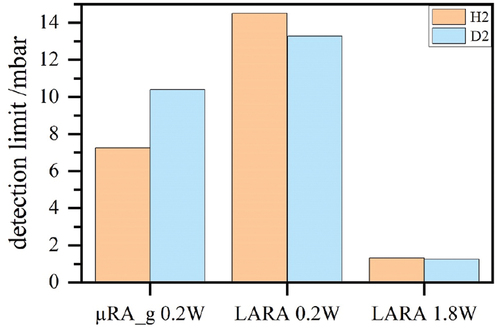
As can be deduced from the results obtained, µRA managed to push the LoD by a factor of 2 for H2 and 1.3 for D2. Only by utilizing its full laser power of 1.8 W could LARA significantly push the LoD. A further improvement could be expected when using a laser with even higher output, and LARA is in operation at TLK with up to 5 W. Currently, µRA is limited to 0.2-W laser power by the laser module, but all optical elements could be operated with up to 2-W laser power.
V. CONCLUSION AND SUMMARY
In this study we compared the influence of different laser excitation wavelengths (405, 532, and 660 nm) on the fluorescence background and Raman signal for the µRA system. For this, we used H2 and D2 and equilibrated H2/HD/D2 gas mixtures in a pressure range from 2.5 up to 500 mbar. All three systems showed their usability, but the already in use µRA-green (532-nm laser) proved to present the best tradeoff between fluorescence background and Raman signal intensity.
Encouraged by the results, we did a short comparative study between µRA-green and the well-established LARA system at the TLK. It was found that the 180-deg fiber-coupled geometry of the µRA seems to be favorable in terms of a lower LoD compared to the 90-deg free-space optics geometry of the LARA. Despite the much better performing hardware used by the LARA system, the µRA managed to provide a significantly lower LoD in a much more compact setup and without the need for time-consuming alignment when both systems were operated with the same laser power. For higher laser power, LARA has a clear advantage. From this, the next step to further enhance the µRA-green system is to replace the current 0.2-W laser with a 2-W module, which will be easy thanks to the fiber coupling but possibly will have limiting effects like (but not limited to) fluorescence in the excitation fiber, which will have to be considered and investigated thoroughly.
For both the other µRA systems under investigation (405- and 660-nm laser wave length), the results seem to be a mixed bag. While the intensity of the Raman signal increased with shorter laser wavelengths, so did the fluorescence background, lead to an inferior LoD. Here, the use of fibers optimized for shorter wavelengths might reduce the background signal and enhance the LoD. Going to longer laser wavelengths, background was dramatically reduced, but the Raman signal of the hydrogen isotopologues was mixed up with a laser-induced photoluminescence signal originating most likely from the stainless steel surface of the sampling cell. Here, the future use of appropriate coatings or cell materials might help to enhance the LoD.
Disclosure Statement
No potential conflict of interest was reported by the authors.
Additional information
Funding
References
- F. PRIESTER et al., “µRA—A New Compact Easy-to-Use Raman System for All Hydrogen Isotopologues,” Sensors, 22, 3952, 3952 (2022); https://doi.org/10.3390/s22103952.
- L. DÖRR et al., “The Closed Tritium Cycle of the Tritium Laboratory Karlsruhe,” Fusion Sci. Technol., 48, 262 (2005); https://doi.org/10.13182/FST05-A924.
- M. SCHLÖSSER et al., “Raman Spectroscopy at the Tritium Laboratory Karlsruhe,” Fusion Sci. Technol., 67, 3, 555 (2015); https://doi.org/10.13182/FST14-T78.
- D. TUSCHEL, “Selecting an Excitation Wavelength for Raman Spectroscopy,” Spectroscopy, 31-, 3, 14 (2016).
- R. GRÖßLE, “DAS TapIR Experiment–IR–Absorptionsspektren Flüssiger Wasserstoffisotopologe,” PhD Thesis, Karlsruhe Institute of Technology, Tritium Laboratory Karlsruhe (2015) (in German); https://doi.org/10.5445/IR/1000055643.