
 ?Mathematical formulae have been encoded as MathML and are displayed in this HTML version using MathJax in order to improve their display. Uncheck the box to turn MathJax off. This feature requires Javascript. Click on a formula to zoom.
Abstract
The mechanical interactions of C-(N-)A-S-H (Calcium-sodium-aluminum-silicate-hydrate) gel with slag and fly ash inclusions in alkali-activated materials (AAM) are quantified through image-supported grid nanoindentation. Nonuniform distributions of indent-specific indentation properties reveal that the elasticity-related domain is up to 130 times the contact indentation depth, while the hardness-related domain, in turn, is by a factor of two to three smaller. These rather large domains are consistent with the slag/fly-ash inclusions being much stiffer and harder than the surrounding C-(N-)A-S-H gel. Corresponding Hashin-Shtirkman bounds for the overall AAM stiffness consistently frame ultrasonic data characterizing this homogenized material scale. This confirms our new testing protocol.
1. Introduction
Clinker-free alternative binders, made from industrial by-products such as ground granulated blast furnace slags (from steel production) or fly ash (from coal combustion) are a viable alternative to CO2-intensive Portland cements for concrete production [Citation1, Citation2]. They are inherently rich in reactive calcium-silicates and/or alumino-silicates. After mixing with alkaline solutions, they form a calcium-silicate-hydrate gel, potentially incorporating alumina and sodium into the gel nanostructure [Citation3, Citation4]. This C-(N-)A-S-H gel acts as “glue” to bind the remaining constituents (unreacted precursor particles, crystalline reaction products, fine and coarse aggregates), so that it is the interplay of these constituents, which governs the overall material properties. The quest for optimizing the latter motivates micromechanical testing activities targeting at the mechanical properties of the individual material constituents.
In this context, nanoindentation testing has turned out as particularly interesting [Citation5–20]. The evaluation of corresponding load-displacement curves is based on a seminal paper of Oliver and Pharr from 1992 [Citation21], resting itself on the landmark contributions of Boussinesq [Citation22] and Sneddon [Citation23]. More specifically, Oliver and Pharr [Citation21] proposed a new method to determine elastic and hardness properties from a nonflat indenter acting on a semi-infinite, homogeneous, elasto-plastic half-space. The so-called “Oliver-Pharr-solution” has gained extreme popularity, resulting in more than 20,000 citations since its publication. Interestingly, it also provided promising results for cases where the tested half-space was not made up by one material only, but where it consisted of different (pseudohomogeneous) sub-domains with elastic properties differing from each other. The latter results were gained from large grids of nanoindentations performed on the surfaces of the aforementioned half-spaces; and tests on cementitious materials played a very important role in this context [Citation6, Citation24–27]. While early data evaluation techniques were based on statistical analyses only, it soon became clear that combination with additional techniques and corresponding data, and in particular so with microscopy, is advisable when it comes to the interpretation of grid nanoindentation results [Citation8, Citation9]. Such approaches have also been applied to clinker-free alternative binders such as alkali-activated materials (AAMs) [Citation12–16, Citation18, Citation20]. They evidence the mechanical importance of fly ash, slag, or metakaolin particles whose stiffness is, by a factor of five to ten, larger than that of the corresponding hydrate gels [Citation14, Citation18].
However, one-to-one mapping of imaging data onto nanoindentation data has its own limitations, as a recent paper of Ma et al. [Citation18] shows very clearly (see , a reproduction of of Ma et al. [Citation18]): Indents all lying clearly within a fly-ash inclusion exhibit quite different modulus values, ranging from 88.9 GPa measured more closely to the boundary of the inclusion, to more than 100 GPa measured toward the center of the inclusion. This indicates very clearly that the mere position of an indent within a homogeneous subdomain seen in the microscopic image does not guarantee the measurement of equally homogeneous, or uniform, modulus values. This shifts the focus toward identification of the indentations for which the Oliver-Pharr solution is actually applicable. In the center of the fly-ash grain seen in , elastic modulus values of 100.1, 102.1, 102.7, and 106.0 GPa are recorded, proposing an average fly ash-related elastic modulus of 102.7 GPa. The indentations more off the center deliver significantly lower modulus values, and this indicates that the assumption of an infinitely large half-space, a governing characteristic of the Oliver-Pharr solution, is not valid any more: the indentations do not merely “feel” the fly-ash material with some 100 GPa stiffness, but also part of the surrounding gel material with a stiffness of around 10 to 20 GPa, according to the data of Ma et al. [Citation18]. This identification of “true‘’ modulus values, i.e. those which are not “contaminated” by “composite half-spaces” is the focus of the present paper, reflecting several of the interesting features of the aforementioned study of Ma et al., while making some modifications and additions as well: We produce large indentation grids across the aforementioned “composite half-spaces”; and as in Ma et al. [Citation18], we use a displacement-driven protocol, rather than the more customary prescription of indentation forces [Citation14, Citation15, Citation17]. This leads to indents all having the same size. At the same time, we invest into roughness reductions by a factor of ten with respect to the data given in Thomas et al. [Citation20], allowing us to reach much shallower indentations, with a correspondingly higher resolution of local stiffness distributions. As these very small indentations are not visible in the microscope, larger “landmark indentations” are set so as to assign the indentation data to the microscopic images. Based on this, we study indentation force and indentation stiffness variations within one and the same of the quasi-homogeneous sub-areas seen in the microscopic images; such as slag grains, fly-ash grains, or hydrated gel matrices. Homogeneous distributions indicate the relevance of the Oliver-Pharr solution, hence giving access to “true modulus” values. The latter are independently checked through a combination of ultrasonic testing and micromechanical theory.
Figure 1. Nanoindentation modulus map (in GPa) mapped on scanning electron microscopic image of seven-day-old alkali-activated fly ash mix tested by Ma et al. [Citation18]; electron micrograph reprinted from “Construction and Building Materials”, 147, Y. Ma, G. Ye, J. Hu, “Micro-mechanical properties of alkali-activated fly ash evaluated by nanoindentation”, 407-416, Copyright (2017), with permission from Elsevier.
![Figure 1. Nanoindentation modulus map (in GPa) mapped on scanning electron microscopic image of seven-day-old alkali-activated fly ash mix tested by Ma et al. [Citation18]; electron micrograph reprinted from “Construction and Building Materials”, 147, Y. Ma, G. Ye, J. Hu, “Micro-mechanical properties of alkali-activated fly ash evaluated by nanoindentation”, 407-416, Copyright (2017), with permission from Elsevier.](/cms/asset/8c156c8f-092e-4f49-b9db-2474cc851881/umcm_a_1941450_f0001_c.jpg)
2. Materials and methods
2.1. Materials, mixtures, and casting
In the present study, ground granulated blast furnace slag with a density of 2.92 g cm– 3 and fly-ash with a density of 2.32 g cm– 3 were used as the binder material, whereby the mass fractions of slag and fly ash amounted to 50% each. Their chemical composition was determined by X-ray fluorescence spectroscopy (XRF) and is shown in . The activator solution was prepared with two types of alkalis: sodium hydroxide and sodium silicate. More precisely, sodium hydroxide pellets (99% purity) were mixed with deionized water at a molarity of 8 M. After 24 h, the sodium hydroxide solution had cooled down, and it was mixed with a sodium silicate solution (consisting of 28.50% SiO2, 18.00% Na2O, and 53.50% water) at a molar SiO2/Na2O ratio of 1.44. The activator solution and the binder were mixed at solution-to-binder ratios s/b of 0.55 in a laboratory mixer.
Table 1. Mass percentage of the chemical components of slag and fly-ash.
One cubic specimen with a side length of 5 cm was cast in metal molds and stored in a climate chamber at and 70% RH. The sample was de-molded after several days and wrapped in a plastic foil, but still kept in the climate chamber until testing. The material age at testing was 6 months. Additional hydration during the two week long testing period can be neglected as the hydration rate is very small at this age.
2.2. Sample preparation for microscopy and indentation
As for microscopic imaging and nanoindentation, one small cubic sample measuring 1 cm × 1 cm × 1 cm was extracted by means of a diamond band saw (EXAKT, USA) from the middle section of the 5 cm cubic specimen. Subsequently, the sample was embedded into a 2-component Epoxi Fix resin (Struers, Denmark). In two sessions lasting 10 min each, air bubbles in the resin close to the specimen’s surface were extracted through a desiccator connected to a pneumatic pump. This avoided any type of carbonation taking place during the solidification phase of the resin. Finally, the embedded sample was cut, by means of an Isomet low speed saw with an attached cubic boron nitride blade (Buehler, USA), into two halves measuring 1 cm × 1 cm × 0.5 cm. Then, the two halves, constituting the actual samples to be tested by nanoindentation, were attached to a microscope slide with the before-mentioned resin.
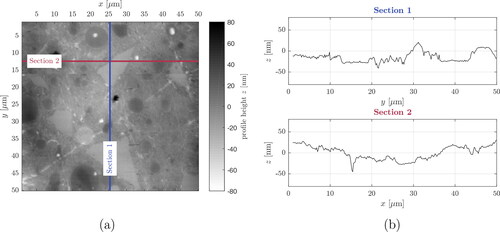
Next, the surfaces of the samples were first leveled by means of an ultra-miller with an attached rotating diamond tip (Leica, Germany). The leveled surfaces of the samples were further polished by means of a circular polishing system with 3500 mm diameter MD-Dac pads (Struers, Denmark) and 3 micron, 1 micron, and 0.25 micron particle-sized diamond based suspensions (Buehler, USA). The surface roughness was determined by means of the scanning probe microscopy (SPM) mode of the Hysitron Triboindenter TI900, see the topography depicted in , and quantified based on the root-mean-squared (RMS) roughness Rq, defined as
(1)
(1)
with z being the profile height at the position given by coordinates x and y, with
being the average profile height, and with
microns being the side length of the area of profile measurements. The Rq roughness of our sample amounted to 16 nm (average of five SPM measurements at different locations, such as the one shown in ), thus being an order of magnitude smaller than in indentation campaigns on comparable materials [Citation20].
Figure 2. Topography image with as measured with the scanning probe microscope (SPM): (a) 2 D plot of the tested area measuring 50 µm × 50 µm, (b) roughness profiles along the sections indicated in (a), note different scales in vertical and horizontal directions.
2.3. Light microscopy imaging and image analyzes
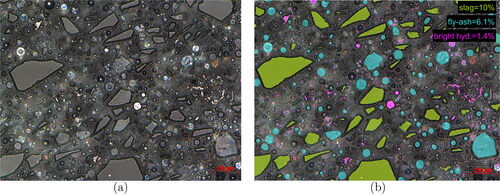
The polished surfaces were examined by means of a Zeiss Axio Imager Z1m light microscope (Carl Zeiss, Germany), and images were acquired by means of a Zeiss AxioCam MRc5 camera, as seen in . Image analysis was performed as follows: Fly ash grains are identified manually, as rounded or spherical inclusions with some micro-porosity inside, see the lightblue areas in . Un-reacted slag grains were identified by manually picking a small region inside the inclusion, and then semi-automatically letting the region extend until a different color is found, see the lightgreen areas in . The bright hydrates, which probably represent aluminum-rich reaction products, are isolated by means of global gray-level thresholding (gray levels above 0.9), see the magenta areas in . The remaining regions are considered as C-(N-)A-S-H gel regions.
Figure 3. Image from light microscopy (500 fold magnification): (a) original and (b) analyzed with region mapping and area fractions in percent.
2.4. Nanoindentation
2.4.1. Length scales of nanoindentation tests
Nanoindentation testing involves a number of important length scales which need to be considered in order to arrive at physically reasonable results for elastic and hardness properties of the investigated material system. They are depicted in , which illustrates
Figure 4. Length scales governing the nanoindentation of AAM.
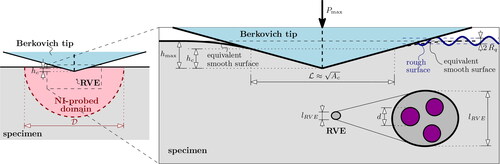
the contact depth hc,
the projected area of contact at peak load, Ac,
the size of the representative volume element (RVE),
associated with the tested elastic and hardness properties
the size of the NI-probed half-space-like domain
the (root mean square) surface roughness Rq.
The relations between these lengths can be derived from the classical separation of scales requirement of continuum (micro-) mechanics, stating that the characteristic length of an RVE needs to be much smaller than the structural length scale and much larger than the length scale of micro-heterogeneities d inside the RVE; see EquationEq. (1)
(1)
(1) of Zaoui [Citation28] or Eq. (2.10) of Hashin [Citation29]:
(2)
(2)
More quantitatively, Drugan and Willis [Citation30] have shown on the basis of ergodicity arguments and ensemble averaging that d and need to be only separated by a relatively small factor of 2 to 3
(3)
(3)
and a systematic ultrasonic testing campaign [Citation31] has evidenced that
and
need to be separated by a factor of about 10,
(4)
(4)
In the present problem, can be associated to the characteristic length of the Berkovich-indenter-related projected contact area, reading mathematically as
(5)
(5)
which yields an interesting relation between the RVE-size and the size of the projected area,
(6)
(6)
For a Berkovich indenter, the projected area is related to the contact depth hc by [Citation21]
(7)
(7)
EquationEqs. (4)–(7) allow one to link the contact depth and the RVE size,
(8)
(8)
Here, we make the interesting observation that combination of EquationEq. (8)(8)
(8) with EquationEq. (3)
(3)
(3) yields
(9)
(9)
Eventually, it is very important to relate the RVE-size to the maximum surface roughness allowing for physically reasonable elasticity and hardness measurements: Experimental investigations have shown that the roughness needs to be limited (at least) by half of the the contact indentation depth,
(10)
(10)
In more detail, Donnelly et al. [Citation32] explicitly give values ranging from 1.7 to 2.8, for the (minimum) ratio between the contact depth hc and the RMS-measured roughness Rq; and of [Citation27] shows converged results for 100 nm roughness at 240 nm indentation depth; the latter being, by definition (see Figure 19 of Oliver and Pharr [Citation21]), somewhat larger than the contact indentation depth. Then, comparison of EquationEqs. (10)(10)
(10) and Equation(8)
(8)
(8) yields the very plausible result that the RVE size also dictates the maximally admissible roughness Rq, through
(11)
(11)
We anticipate that our tests delivered contact indentation depths of nm; so that upon recalling Rq = 16 nm (see Section 2.2), the roughness criterion (10) is fulfilled.
A comparatively open question is the size of the actually probed half-space While yet another, repeatedly used “rule-of-thumb” [Citation33] speaks of ten times the indentation depth, this open question is actually one of the focuses of the present paper.
2.4.2. Nanoindentation protocol
Nanoindentation was performed in displacement-controlled mode with using a Hysitron Triboindenter TI900 with a Berkovich diamond tip. The indenter was placed in a room with a controlled temperature of 20 centigrades. The indenter chamber was controlled at a relative humidity of 90%, in order to avoid drying which potentially causes (micro-)cracking. Moreover, the chamber was saturated with nitrogen gas, in order to avoid carbonation at the surface. A trapezoidal load history is prescribed, defined through linear loading/unloading phases lasting 10 seconds, and a 5 seconds holding phase at the maximum indentation depth. Nanoindentation was carried out on grids of
imprints. Two grids were realized, yielding 2,178 individual indents.
2.4.3. Evaluation of load-displacement curves
All 2,178 individual force-displacement (P-h) diagrams were evaluated based on the Oliver-Pharr-Method [Citation21]. Considering purely elastic unloading of an isotropic elastic half-space at the beginning of the (nonlinear) unloading branch, with S defining the initial slope, the indentation modulus (or reduced modulus) Er reads as [Citation21]
(12)
(12)
with
being the geometric correction factor for the Berkovich tip [Citation34] with Ac being the projected contact area at peak load
see EquationEq. (7)
(7)
(7) , whereby the contact depth, hc, is related to the measured maximum indentation depth
through [Citation21]
(13)
(13)
with
being the geometric constant for a Berkovich tip [Citation21]. Notably, the indentation modulus accounts for elastic deformations in both the indented material and the indenter itself, i.e.,
(14)
(14)
with E being the sought elastic modulus of the material, with ν being the material’s Poisson’s ratio, and with
GPa as well as
being the elastic properties of the diamond indenter [Citation21]. In addition to the modulus, the indentation hardness is gathered from P-h diagrams and is defined as [Citation21]
(15)
(15)
2.4.4. Mapping of indentation properties on microscopy images
We aim at mapping the nanoindentation results on the microscopic images obtained from the external light microscope. 60 nm imprints are not visible in the light microscope. As a remedy, “landmark” imprints with forces of 10 mN (=maximum force of the indenter) were made along two orthogonal directions aligned with the testing grid, starting in the epoxy surrounding the sample and ending at the corner of the testing grid. The distance between two aligned landmarks amounted to 20 microns, allowing us to easily follow the lines, and thus locate the position of the testing grid. The two orthogonal lines of landmark imprints also allowed us to rectify the camera images.
2.5. Ultrasound testing
Ultrasound tests were performed in order to determine the macroscopic elastic stiffness of the material. Therefore, samples with smooth surfaces are needed. Accordingly, the rough surface of each of the cubic samples with 5 cm side length, i.e. that which was not in contact with the mold, was “cut off”, by a diamond saw (EXAKT, USA), from the rest of the sample. The resulting rest measured roughly and exhibited very-close-to-perfect coplanar surfaces. The precise dimensions of the cuboid samples were measured by means of a digital sliding caliper. Dividing the sample mass by its volume yields the mass density, amounting to
g cm– 3.
The ultrasound test setup consists of a pulse receiver (5077PR, OlympusNDT), an oscilloscope (Waverunner 62Xi, Lecroy), and ultrasonic transducers, see [Citation31, Citation35] for details. Honey was used as a coupling medium between sample and transducers. Transversal ultrasonic pulses with frequencies were sent from one transducer (acting as sender) to the transducer on the opposing cuboid face (acting as receiver). The time of flight through the sample was accessed by the oscilloscope and divided by the travel distance (=specimen dimension in wave travel direction) to quantify the ultrasonic wave velocities. Given that the transversal wave transducers also emit a (relatively weak) longitudinal signal, longitudinal (vl) and transversal wave velocities (vt) could be measured simultaneously. In order to avoid transducer-induced near field corruption [Citation36], a delay line in form of a 5 cm high aluminum cylinder was installed between sample and transducer [Citation31].
Ultrasound waves test the material at length scales which are significantly smaller than the wave length [Citation28]. Given our interest in determining the macroscopic stiffness, i.e. the stiffness of an RVE of AAM paste, the tested material volume needs to be large enough to host the unreacted slag (and fly ash) grains with characteristic diameters see . RVEs of AAM paste are, according to the scale separation rule discussed in Section 2.4.1 roughly three times larger than the size of the grain, i.e., they amount to
Ultrasound wavelengths λ are determined by dividing the ultrasound velocities (longitudinal and transversal, respectively) by the ultrasound frequencies f, reading as
(16)
(16)
The wave lengths are larger than 0.8 mm in all tests, which satisfies the scale separation requirement [Citation31]
Additionally, the wave length also ensures bulk wave propagation in all cases, see the empirical criteria established by Kohlhauser and Hellmich [Citation31].
2.6. Linking nanoindentation to ultrasound: homogenization theory based on Hashin-Shtrikman bounds
Nanoindentation tests with 60 nm indentation depth refer to (maximum) RVE lengths of 30 nm, see EquationEq. (7)(7)
(7) . Ultrasound tests with wave lengths larger than 0.8 mm in turn refer to RVEs with a size of several hundred of micrometers. To bridge these different length scales, we use homogenization theory. Given the complex morphology of the AAM paste, we apply Hashin-Shtrikman’s variational principles in linear elasticity [Citation37] to compute the smallest upper and the highest lower bound for the homogenized elastic modulus of the composite, from the phase moduli and phase volume fractions. This way, we can validate whether the nanoindention-related modulus and the ultrasound-related modulus are consistent. The formula set for quantifying the Hashin-Shtrikman bounds is briefly recalled next.
Consider a multi-phase RVE consisting of n isotropic phases. The phases’ bulk moduli are denoted by and the shear moduli by
Then, the highest lower bound (k–) and the lowest upper bound (k+) of the homogenized RVE bulk modulus
(
) read as [Citation37]
(17)
(17)
(18)
(18)
whereby auxiliary values α1, αn, as well as A1 and An read as
(19)
(19)
(20)
(20)
(21)
(21)
In EquationEqs. (20)(20)
(20) and Equation(21)
(21)
(21) , fi denotes the volume fraction of phase i, with
Shear modulus bounds (
), in turn, read as [Citation37]
(22)
(22)
(23)
(23)
whereby auxiliary values β1, βn, as well as B1 and Bn read as
(24)
(24)
(25)
(25)
(26)
(26)
3. Results and discussions
3.1. Indentation property distributions - elasticity and hardness of unreacted slag and C-(N-)A-S-H gel
Herein, we correlate the indentation properties of all 2,178 indents with their locations on the microscopic image of the microstructure. Relying on the landmark imprints introduced in Section 2.4.4, indenter positions are mapped onto the microscopic images, see . The microscopic images are processed according to the analysis method described in Section 2.3, to identify the phase regions of unreacted slag, unreacted fly-ash, bright reaction products, and of C-(N-)A-S-H gel, see . Differences between the desired and the realized positions of the indents are caused by the resolution of the positioning system of the X-Y-stage of the indenter. With a resolution of 0.5 μm and a spacing between the indents of 2 μm, outliers with a spacing of 1.5 or 2.5 μm are easily visible, even if there are only about 40 of them in a grid of more than 1000 indents. The indentation property maps, see for the modulus maps and for the hardness maps, resolve the mechanical features of microstructure and reflect the phase maps. Large gradients of indentation properties correlate virtually perfectly with the phase boundaries between slag/fly ash and the C-(N-)A-S-H gel, see . This underlines the accuracy of our landmark indent-based mapping technique. Large indentation moduli () and large indentation hardnesses (
) clearly fall inside the regions of unreacted slag/fly ash grains. Notably, indentation properties related to the C-(N-)A-S-H gel phase increase—on average—as they approach the grain-gel interface. Indentation properties related to slag or fly-ash grains decrease—on average—as they approach the grain-gel interface.
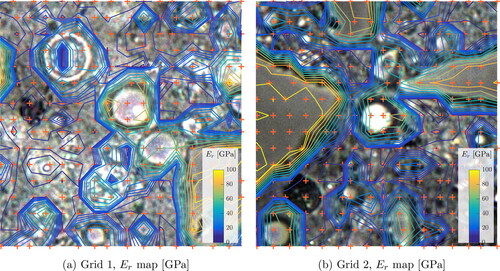
Figure 5. (a,e) Positions of 33 × 33 indents inside a large area, mapped onto the light microscopic images; (b,f) phase domains of slag grains (green), fly ash grains (blue), bright hydrates (magenta), and C-(N-)A-S-H gel (red), respectively, mapped onto light microscopic images; (c,g) maps of indentation modulus Er; and (d,h) maps of indentation hardness H; top row refers to Grid 1, bottom row to Grid 2.
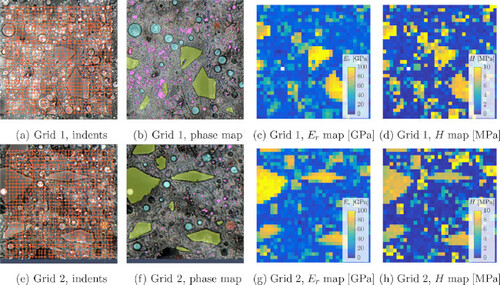
Figure 6. Zoom into map of indentation modulus Er: contour lines overlaid on light microscopic image, for (a) Grid 1 showing indents inside and around fly ash grains, and (b) Grid 2 showing indents inside and around slag grains.
To further explore and quantify these dependencies and to obtain trustworthy indentation properties of all phases, we rely on image analysis. In this context, we quantify, for each of the 2,178 indents, the distance to the grain-gel boundary. Therefore, the minimum boundary distance is introduced as the distance of an indent to its closest boundary, see . This way, we can study the evolution of the indentation modulus of slag, fly ash, and C-(N-)A-S-H with respect to the minimum boundary distance, see .
Figure 7. Definition of minimum boundary distance Schematic image showing 3 × 3 indents mapped onto the microstructure and resulting relation between indentation modulus Er and minimum boundary distance
indents inside slag are depicted in green, indents inside C-(N-)A-S-H are depicted in red.
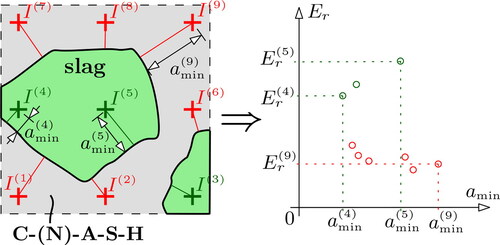
Figure 8. Image analysis-derived distribution of phase-specific indentation modulus Er (a,c), and hardness H (b,d), as functions of the minimum distance of the corresponding indents from a phase boundary; points refer to individual indents, solid lines to moving averages over a truncated sliding window of 11 neighboring values in slag, or of 31 neighboring values in C-(N-)A-S-H gel; gray points for C-(N-)A-S-H gel are considered outliers, see text).
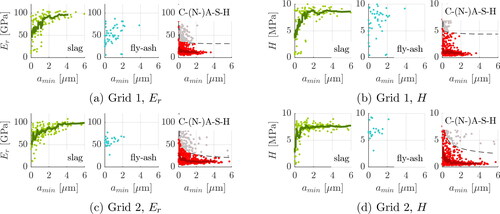
Both indentation modulus and hardness of the inclusions (slag, fly-ash) increase significantly with increasing boundary distance, particularly obvious in the details shown in . As for C-(N-)A-S-H gel, in turn, modulus and hardness decrease with increasing boundary distance. This clearly demonstrates that nanoindentation tests in soft matrix-hard inclusion materials with modulus/hardness contrasts of roughly one order of magnitude are very prone to errors related to boundary effects. We note that the boundary distance refers to the surface which is indented, and as such does not reflect phase changes in the third dimension. This is reflected by a large scatter in modulus and hardness data when plotted over the boundary distance. In order to smoothen the scatter in the indentation data, we quantify a moving average and a moving standard deviation, respectively, of the NI-measured modulus and hardness values. For these moving quantities, the aforementioned values are ordered with respect to the distance of the corresponding indent from the closest boundary. In the case of slag, the corresponding sliding window comprises 11 values (from which averages and standard deviations are computed). The limited number of indents in the fly ash phase, together with the increased scatter due to the hollow shell morphology [see the top left grain in ], does not allow for a more detailed boundary effect analysis in the proximity of fly ash grains - hence, we resort to the properties given by Ma et al. [Citation18], as given already in the Introduction section. The moving averaging process described above is also applied to the gel indentation results; however with a sliding window size of 31 values. Outliers, indicated as gray points in , are all C-(N-)A-S-H gel indents with indentation properties larger than the sum of the moving average and the moving standard deviation, see the dashed black line in . As for the remaining points (depicted in red in ), yet another moving average is calculated and considered representative for the C-(N-)A-S-H gel for further analysis. Very remarkably, the two test grids provide very similar (averaged) distributions of modulus and hardness values in the vicinity of the phase boundaries, both as concerns slag and C-(N-)A-S-H properties, see .
Figure 9. Image analysis-derived distribution of moving averages of indentation modulus Er (a,c), and hardness H (b,d), measured on slag grains (a,b) and C-(N-)A-S-H gel (c,d); as functions of the minimum distance of the corresponding indents from a phase boundary; brighter line refers to Grid 1, darker line to Grid 2, dashed line to the plateau values.
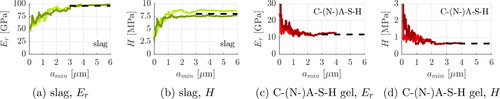
Plateau values of indentation properties of the phases are quantified by averaging all points (irrespective of the test grid) with boundary distances μm. This way, the boundary effects are removed entirely, and the quantified plateau values are considered as intrinsic to the phase itself. The modulus and hardness distributions observed in the two test grids are very similar to each other, and this underlines that the microscopy-guided evaluation of indentation property maps is a robust and reliable method for removing artifacts related to inhomogeneous half-spaces. As for the C-(N-)A-S-H gel, mean and standard deviation of the indentation modulus and the indentation hardness amount to
and
see . Slag properties, in turn, amount to
and
It is illustrative to compare the latter numbers to values given in the literature: statistical analysis of grid nanoindentation results yields moduli ranging from 67 to 80 GPa [Citation15, Citation20] and hardness values of around 6 MPa [Citation20]. By means of coupling quantitative energy dispersion spectroscopy with nanoindentation, Wilson et al. [Citation11] was able to isolate indents in regions where unreacted slag grains are located, see also Wilson et al. [Citation38] for the introduction of the method. The corresponding modulus inside slag regions amounts to 91 GPa and the hardness amounts to 7.8 MPa. The latter values are much closer to the properties of unreacted slag determined herein (see ), as compared to the results from purely statistical analysis [Citation15, Citation20]. Concerning fly ash, the distribution of measured indentation properties in the vicinity of the phase boundary indicates that the indentation modulus and hardnesses are very similar to the ones of slag, see . However, due to their small sizes inhibiting the emergence of a plateau region of data, phase-specific properties of fly ash and bright hydrates cannot be determined.
Table 2. Indentation modulus Er and indentation hardness H from image-guided evaluation of indentation property maps.
3.2. Confirmation of nanoindentation-probed elastic properties—micromechanical upscaling to the ultrasound-probed AAM-level
We consider that an RVE of AAM paste is composed of four isotropic elastic phases, C-(N-)A-S-H gel, unreacted slag, unreacted fly ash, and bright-colored hydrates, as identified from image analyses in and . The phase volume fractions fj of slag (fs), fly ash (ff), bright hydrates (fb) are set equal to the area fractions obtained from image analyses given in . The C-(N-)A-S-H gel volume is considered to occupy the remaining volume, see . The elastic moduli of slag and C-(N-)A-S-H gel are derived from the indentation moduli (see ) according to EquationEq. (12)
(12)
(12) , with Poisson ratios given in . The elastic moduli of fly ash and bright hydrates are taken as 105 MPa, motivated by image-based nanoindentation tests of Ma et al. [Citation18], see . This choice is further supported by bottom-up stiffness homogenization of fly ash based on its constituents glass, mullite, and quartz [Citation39], and by successful micromechanics modeling of alkali-activated fly ash systems [Citation40], while statistical nanoindentation testing again leads to smaller moduli of roughly 73 GPa [Citation14, Citation16].
Table 3. Elastic phase constants Ei and νr as well as phase volume fractions fr used for homogenization.
For the material constituents given in , the lower and upper Hashin-Shtrikman bounds according to EquationEqs. (17)–(26) read as
(27)
(27)
yielding the following bounds for the stiffness components C1111
(28)
(28)
These bounds can be transformed into bounds for the longitudinal (vl) and transversal (vt) wave velocities, respectively, reading as [Citation41, Citation42]
(29)
(29)
These bounds beautifully frame the ultrasonically tested wave velocities, reading as
(30)
(30)
giving further confidence into the elastic properties as tested in .
3.3. Sizes of nanoindentation-probed domains
After successful validation of the indentation results, we now quantify the size of the domains probed by the indenter, based on the distributions of the indentation properties as functions of the minimum distance between indent and phase boundary ( and ).
We start with discussing the distribution of properties measured in the slag phase. The indent-specific elastic properties become invariant with space ( GPa) once a minimum distance of
from the boundary is reached, see . Hence, the modulus-related NI-probed domain size
inside the stiff slag grains amounts to
(31)
(31)
with
as the ratio between NI-probed domain and contact indentation depth. Notably, this ratio is by one order of magnitude larger than Buckle’s 1/10 rule [Citation33] would suggest. A similar, albeit less pronounced effect is known from computations concerning hard layers on soft substrates [Citation43–47]. The present, even stronger effect probably arises from “replacement” of a hard layer which is infinitely extended in two dimensions, by a finite hard inclusion representing a material phase. The slag’s indentation hardness, in turn, reaches a plateau for
MPa, already at boundary distances
of 1 to 1.5 microns, see . The hardness-related factor
is therefore between one third and one half of the modulus-related factor
i.e.
and
The difference between modulus and hardness-related probed volumes is also supported by the fly ash indents, see , as fly ash and slag modulus and hardness hardness change very similarly with increasing boundary distance.
As for the C-(N-)A-S-H gel phase, the mechanical properties clearly decrease with increasing boundary distance (to any of the inclusion phases), see and . The increased scatter in the property distributions of the gel results most likely from small inclusions with high indentation properties, which are located in the selected area, despite our best effort to exclude all of them. The modulus plateau is reached at boundary distances of approximately 1 micron, the hardness plateau probably slightly earlier. Conclusively, the indenter-probed domain in the C-(N-)A-S-H gel phase measures only one third of that measured in the slag phase. The underlying reason is that we quantified this domain in terms of the minimum distance of an indent from a phase boundary, In case of slag, this distance is of the order of the average of boundary distances over all directions, due to the size and the convex shape of the slag inclusions. This is fundamentally different in the C-(N-)A-S-H gel matrix, where an indent at minimum distance to one boundary is, as rule, much more distant from all other boundaries met in other directions. We conclude that in addition to stiffness contrast and phase shape, also microstructural morphology matters.
4. Conclusions
By means of grid nanoindentation tests on ultra-smooth surfaces of hardened alkali-activated slag-fly ash mixes, the micromechanical properties of unreacted slag, unreacted fly ash, and the surrounding C-(N-)A-S-H gel are quantified. Slag (and fly ash) grains are almost one order of magnitude stiffer and more than one order of magnitude harder than the C-(N-)A-S-H gel. This contrast in mechanical properties implies challenges in the assessment of the individual phase properties from a purely statistical evaluation of the grid indentation results. Namely, the measured nanoindentation response is very often a mix of grain and matrix properties, even for indentation depths as shallow as 60 nm.
As a remedy, we perform systematic image-guided evaluation by means of mapping the indentation properties on microscopic images. This way, indentation properties of slag and fly ash grains are shown to significantly increase with increasing boundary distance, while C-(N-)A-S-H gel properties decrease. Phase-intrinsic indentation properties of slag and C-(N-)A-S-H gel can be quantified as the plateau values reached at large enough boundary distances.
We validate the elastic phase stiffness derived from nanoindentation by means of ultrasound tests characterizing the macroscopic AAM. Homogenization theory based on Hashin-Shtrikman bounds is employed to upscale the nanoindentation moduli to bounds for the ultrasonic wave velocities for AAM paste. These bounds frame the ultrasonic test data, which confirms the new test protocol.
Finally, the distance required for reaching the plateau allows for quantification of the indenter-probed volumes. The characteristic size of these volumes is by up to a factor of 130 larger than the contact indentation depth, and thus one order of magnitude larger than Buckle’s widely referenced 1/10 rule [Citation33] implies. However, we need to bear in mind that Buckle’s rule was formulated for “truly” infinite half-spaces, i.e., such consisting of only one type of material, and not for the “composite half-spaces” studied in the context of AAM and cementitious materials in general. Thus, we conclude that large stiffness/hardness contrast between the phases together with the convex inclusion shape are the source of the discrepancy. This experimentally evidenced phenomenon has been somehow anticipated by many numerical [Citation43–45] or (semi-)analytical approaches [Citation46, Citation47] showing that Buckle’s rule of thumb loses its relevance once composite solids, such as two-layered domains with (very) hard layers on soft substrates, are investigated. Remarkably, the indenter-probed volume related to the hardness derivation is by a factor of two to three smaller than the one for stiffness assessment.
In this context, we may again resort to the starting point of our study: It was the traditional Oliver-Pharr half-space problem depicted in . This is the problem for which the ubiquitously used formulae of EquationEqs.(12)-(15) have been originally derived. In such a half-space problem, the largest finite structural length is the “diameter” of the indenter, as given by EquationEq. (5)(5)
(5) . This length, together with well-known separation-of-scales conditions, see EquationEqs. (3)
(3)
(3) and Equation(4)
(4)
(4) and with “diameter-over-depth” ratios defined by EquationEqs. (5)
(5)
(5) and Equation(7)
(7)
(7) , gives access to relations between indentation depth and RVE size. The question how these scales relate to the size of the micromechanical phases, such as slag and CNASH gel, is then tested on a purely experimental basis, by looking for similar values along grids spanning over the inclusions, see and . This introduces an additional level of experimental identification of half-space size, when compared to the customary approach [Citation24] of “choosing” the micromechanical phase size as structural length in the half-space problem. In this sense, we explicitly consider that all the classical formulae for the indentation half-space problem are, by the mere definition of this problem, not related to micromechanical phase size.
Acknowledgments
The authors thank to Stéphanie Staquet and her team from Université libre de Bruxelles for providing the mixes and the fruitful discussions in the framework of the Interact project (see interact.ulb.be for details).
Additional information
Funding
References
- C. Shi, D. Roy, and P. Krivenko, Alkali-Activated Cements and Concretes, CRC Press, London, UK, 2003.
- E. Gartner, Industrially interesting approaches to” low-CO2” cements, Cem. Concr. Res., vol. 34, no. 9, pp. 1489–1498, 2004. DOI: 10.1016/j.cemconres.2004.01.021.
- S. A. Bernal, , J. L. Provis, B. Walkley, R. S. Nicolas, J. D. Gehman, D. G. Brice, A. R. Kilcullen, P. Duxson, and J. S.J. van Deventer, Gel nanostructure in alkali-activated binders based on slag and fly ash, and effects of accelerated carbonation, Cem. Concr. Res., vol. 53, pp. 127–144, 2013. DOI: 10.1016/j.cemconres.2013.06.007.
- J. L. Provis, Geopolymers and other alkali activated materials: Why, how, and what? Mater, Mater. Struct., vol. 47, no. 1/2, pp. 11–25, 2014. DOI: 10.1617/s11527-013-0211-5.
- G. Constantinides, F.-J. Ulm, and K. Van Vliet, On the use of nanoindentation for cementitious materials, Mat. Struct., vol. 36, no. 3, pp. 191–196, 2003. DOI: 10.1007/BF02479557.
- G. Constantinides and F.-J. Ulm, The effect of two types of {C}-{S}-{H} on the elasticity of cement-based materials: Results from nanoindentation and micromechanical modeling, Cem. Concr. Res., vol. 34, no. 1, pp. 67–80, 2004. DOI: 10.1016/S0008-8846(03)00230-8.
- J. Němeček, Creep effects in nanoindentation of hydrated phases of cement pastes, Mater. Charact., vol. 60, no. 9, pp. 1028–1034, 2009. DOI: 10.1016/j.matchar.2009.04.008.
- J. J. Chen, L. Sorelli, M. Vandamme, F.-J. Ulm, and G. Chanvillard, A coupled nanoindentation/SEM-EDS study on low water/cement ratio portland cement paste: Evidence for C-S-H/Ca(OH)2 nanocomposites, J. Am. Ceram. Soc., vol. 93, no. 5, pp. 1484–1493, 2010. DOI: 10.1111/j.1551-2916.2009.03599.x.
- P. Lura, P. Trtik, and B. Münch, Validity of recent approaches for statistical nanoindentation of cement pastes, Cem. Concr. Compos., vol. 33, no. 4, pp. 457–465, 2011. DOI: 10.1016/j.cemconcomp.2011.01.006.
- M. Vandamme and F.-J. Ulm, Nanoindentation investigation of creep properties of calcium silicate hydrates, Cem. Concr. Res., vol. 52, pp. 38–52, 2013. DOI: 10.1016/j.cemconres.2013.05.006.
- W. Wilson, L. Sorelli, and A. Tagnit-Hamou, Unveiling micro-chemo-mechanical properties of C–(A)–S–H and other phases in blended-cement pastes, Cem. Concr. Res., vol. 107, pp. 317–336, 2018. DOI: 10.1016/j.cemconres.2018.02.010.
- J. Němeček, V. Šmilauer, and L. Kopecký, Characterization of Alkali-Activated Fly-Ash by Nanoindentation. In: Z. Bittnar, P. J. M. Bartos, J. Němeček, V. Šmilauer, and J. Zeman (eds.), Nanotechnol. Constr., Vol. 3. Springer, Berlin, Heidelberg, 2009.
- J. Němeček, V. Šmilauer, L. Kopecký, and J. Němečková, Nanoindentation of alkali-activated fly ash, Transp. Res. Rec., vol. 2141, no. 2141, pp. 36–40, 2010. DOI: 10.3141/2141-07.
- J. Němeček, V. Šmilauer, and L. Kopecký, Nanoindentation characteristics of alkali-activated aluminosilicate materials, Cem. Concr. Compos., vol. 33, no. 2, pp. 163–170, 2011. DOI: 10.1016/j.cemconcomp.2010.10.005.
- B. S. Gebregziabiher and S. Peethamparan, Characterization of alkali activated slag gel using nano-indentation. In Third International Conference on Sustainable Construction Materials and Technologies, August 18 - August 21 2013, Kyoto Research Park, Kyoto, Japan.
- S. Das, P. Yang, S. S. Singh, J. C.E. Mertens, X. Xiao, N. Chawla, and N. Neithalath, Effective properties of a fly ash geopolymer: Synergistic application of X-ray synchrotron tomography, nanoindentation, and homogenization models, Cem. Concr. Res., vol. 78, pp. 252–262, 2015. DOI: 10.1016/j.cemconres.2015.08.004.
- H. Lee, V. Vimonsatit, and P. Chindaprasirt, Mechanical and micromechanical properties of alkali activated fly-ash cement based on nano-indentation, Constr. Build. Mater., vol. 107, pp. 95–102, 2016. DOI: 10.1016/j.conbuildmat.2015.12.013.
- Y. Ma, G. Ye, and J. Hu, Micro-mechanical properties of alkali-activated fly ash evaluated by nanoindentation, Constr. Build. Mater., vol. 147, pp. 407–416, 2017. DOI: 10.1016/j.conbuildmat.2017.04.176.
- H. Lee, V. Vimonsatit, P. Chindaprasirt, T. Ngo, and P. Mendis, Creep properties of cement and alkali activated fly ash materials using nanoindentation technique, Constr. Build. Mater., vol. 168, pp. 547–555, 2018. DOI: 10.1016/j.conbuildmat.2018.02.166.
- R. J. Thomas, B. S. Gebregziabiher, A. Giffin, and S. Peethamparan, Micromechanical properties of alkali-activated slag cement binders, Cem. Concr. Compos., vol. 90, pp. 241–256, 2018. DOI: 10.1016/j.cemconcomp.2018.04.003.
- W. C. Oliver, and G. M. Pharr, An improved Method for determining hardness and elastic modulus using load and displacement sensing indentation experiments, J. Mater. Res., vol. 7, no. 6, pp. 1564–1583, 1992. DOI: 10.1557/JMR.1992.1564.
- J. Boussinesq, Application Des Potentiels à L’étude de L’équilibre et du Mouvement Des Solides Élastiques [Application of Potentials to the Study of the Equilibrium and Motion of Elastic Solids], Gauthier-Villars, Paris, 1885.
- I. N. Sneddon, The relation between load and penetration in the axisymmetric boussinesq problem for a punch of arbitrary profile, Int. J. Eng. Sci., vol. 3, no. 1, pp. 47–57, 1965. DOI: 10.1016/0020-7225(65)90019-4.
- G. Constantinides, K. S. Ravi Chandran, F.-J. Ulm, and K. J. Van Vliet, Grid indentation analysis of composite microstructure and mechanics: Principles and validation, Mater. Sci. Eng. A., vol. 430, no. 1/2, pp. 189–202, 2006. DOI: 10.1016/j.msea.2006.05.125.
- G. Constantinides, and F.-J. Ulm, The nanogranular nature of C-S-H, J. Mech. Phys. Solids., vol. 55, no. 1, pp. 64–90, 2007. DOI: 10.1016/j.jmps.2006.06.003.
- W. Zhu, J. J. Hughes, N. Bićanić, and C. J. Pearce, Nanoindentation mapping of mechanical properties of cement paste and natural rocks, Mater. Charact., vol. 58, no. 11/12, pp. 1189–1198, 2007. ISSN 1044-5803. DOI: 10.1016/j.matchar.2007.05.018.
- M. Miller, C. Bobko, M. Vandamme, and F.-J. Ulm, Surface roughness criteria for cement paste nanoindentation, Cem. Concr. Res., vol. 38, no. 4, pp. 467–476, 2008. DOI: 10.1016/j.cemconres.2007.11.014.
- A. Zaoui, Continuum micromechanics: Survey, J. Eng. Mech., vol. 128, no. 8, pp. 808–816, 2002. [Database] DOI: 10.1061/(ASCE)0733-9399(2002)128:8(808).
- Z. Hashin, Analysis of composite materials – a survey, J. Appl. Mech., vol. 50, no. 3, pp. 481–505, 1983. DOI: 10.1115/1.3167081.
- W. J. Drugan, and J. R. Willis, A micromechanics-based nonlocal constitutive equation and estimates of representative volume element size for elastic composites, J. Mech. Phys. Solids., vol. 44, no. 4, pp. 497–524, 1996. DOI: 10.1016/0022-5096(96)00007-5.
- C. Kohlhauser and C. Hellmich, Ultrasonic contact pulse transmission for elastic wave velocity and stiffness determination: Influence of specimen geometry and porosity, Eng. Struct., vol. 47, pp. 115–133, 2013. DOI: 10.1016/j.engstruct.2012.10.027.
- E. Donnelly, S. P. Baker, A. L. Boskey, and M. C. H. Van Der Meulen, Effects of surface roughness and maximum load on the mechanical properties of cancellous bone measured by nanoindentation, J. Biomed. Mater. Res. A., vol. 77, no. 2, pp. 426–435, 2006. DOI: 10.1002/jbm.a.30633.
- H. Buckle, Use of hardness test to determine other material properties. In: J.H. Westbrook and H. Conrad (eds.), Sci. hardness Test. its Res. Appl. American Society for Metals, Metal Park OH, 1973.
- A. C. Fischer-Cripps, Nanoindentation, Third Edition, Springer, Heidelberg, Germany, 2011.
- C. Kohlhauser, C. Hellmich, C. Vitale-Brovarone, A. R. Boccaccini, A. Rota, and J. Eberhardsteiner, Ultrasonic characterisation of porous biomaterials across different frequencies, Strain., vol. 45, no. 1, pp. 34–44, 2009. DOI: 10.1111/j.1475-1305.2008.00417.x.
- J. L. Williams , Ultrasonic wave propagation in cancellous and cortical bone: Prediction of some experimental results by Biot's theory, J. Acoust. Soc. Am., vol. 91, no. 2, pp. 1106–1112, 1992. DOI: 10.1121/1.402637.
- Z. Hashin and S. Shtrikman, A variational approach to the theory of the elastic behaviour of multiphase materials, J. Mech. Phys. Solids., vol. 11, no. 2, pp. 127–140, 1963. DOI: 10.1016/0022-5096(63)90060-7.
- W. Wilson, L. Sorelli, and A. Tagnit-Hamou, Automated coupling of NanoIndentation and Quantitative Energy-Dispersive Spectroscopy (NI-QEDS): A comprehensive method to disclose the micro-chemo-mechanical properties of cement pastes, Cem. Concr. Res., vol. 103, no. May, pp. 49–65, 2018. DOI: 10.1016/j.cemconres.2017.08.016.
- T. Matsunaga, J. K. Kim, S. Hardcastle, and P. K. Rohatgi, Crystallinity and selected properties of fly ash particles, Mater. Sci. Eng. A., vol. 325, no. 1/2, pp. 333–343, 2002. DOI: 10.1016/S0921-5093(01)01466-6.
- P. Šmilauer, V. Hlaváček, F. Škvára, R. Šulc, L. Kopecký, and J. Němeček, Micromechanical multiscale model for alkali activation of fly ash and metakaolin, J. Mater. Sci., vol. 46, no. 20, pp. 6545–6555, 2011. ISSN 0022-2461. DOI: 10.1007/s10853-011-5601-x.
- J. M. Carcione, Wave Fields in Real Media: Wave Propagation in Anisotropic, Anelastic, Porous and Electromagnetic Media, Elsevier Science, Amsterdam, The Netherlands, 2007.
- F. I. Fedorov, Theory of Elastic Waves in Crystals, Springer US, New York, US, 2013.
- R. B. King, Elastic analysis of some punch problems for a layered medium, Int. J. Solids Struct., vol. 23, no. 12, pp. 1657–1664, 1987. DOI: 10.1016/0020-7683(87)90116-8.
- X. Chen and J. J. Vlassak, Numerical study on the measurement of thin film mechanical properties by means of nanoindentation, J. Mater. Res., vol. 16, no. 10, pp. 2974–2982, 2001. ISSN 0884-2914. DOI: 10.1557/JMR.2001.0408.
- A. Perriot and E. Barthel, Elastic contact to a coated half-space: Effective elastic modulus and real penetration, J. Mater. Res., vol. 19, no. 2, pp. 600–608, 2004. ISSN 0884-2914. DOI: 10.1557/jmr.2004.19.2.600.
- J. Li, and T. W. Chou, Elastic field of a thin-film/substrate system under an axisymmetric loading, Int. J. Solids Struct., vol. 34, no. 35/36, pp. 4463–4478, 1997. ISSN 0020-7683. DOI: 10.1016/S0020-7683(97)00053-X.
- H. Gao, C.-H. Chiu, and J. Lee, Elastic contact versus indentation modeling of multi-layered materials, Int. J. Solids Struct., vol. 29, no. 20, pp. 2471–2492, 1992. DOI: 10.1016/0020-7683(92)90004-D.