
ABSTRACT
Multiple myeloma (MM) continues to claim the lives of a majority of patients. MM cancer stem cells (CSCs) have been demonstrated to sustain tumor growth. Due to their ability to self-renew and to express detoxifying enzymes and efflux transporters, MM-CSCs are rendered highly resistant to conventional therapies. Therefore, managing MM-CSCs characteristics could have profound clinical implications. Bruceantin (BCT) is a natural product previously demonstrated to inhibit the growth of MM in RPMI 8226 cells-inoculated mouse xenograft models, and to cause regression in already established tumors. The objectives of the present study were to test the inhibitory effects of BCT on MM-CSCs growth derived from a human primary tumor, and to explore a mechanism of action underlying these effects. BCT exhibited potent antiproliferative activity in MM-CSCs starting at 25 nM. BCT induced cell cycle arrest, cell death and apoptosis in MM-CSCs as well as inhibited cell migration and angiogenesis in vitro. Using a qPCR screen, it was found that the gene expression of a number of Notch pathway members was altered. Pretreatment of MM-CSCs with the γ-secretase inhibitor RO4929097, a Notch pathway inhibitor, reversed BCT-induced effects on MM-CSCs proliferation. In this study, BCT was shown to be an effective agent in controlling the proliferation, viability and migration of MM-CSCs as well as angiogenesis in vitro. The effect on MM-CSCs proliferation may be mediated by the Notch pathway. These results warrant further investigation of BCT in a broader set of human-derived MM-CSCs and with in vivo models representative of MM.
Abbreviations
| MM | = | multiple myeloma |
| BCT | = | bruceantin |
| CSCs | = | cancer stem cells |
| MM-CSCs | = | multiple myeloma cancer stem cells |
| BTZ | = | bortezomib |
| RO | = | RO4929097 |
| EH | = | ethidium homodimer |
| NSCs | = | normal haematopoietic stem cells |
| HUVECs | = | human umbilical vein endothelial cells |
| VEGF | = | vascular endothelial growth factor |
| ANOVA | = | analysis of variance |
Introduction
Bruceantin (BCT) is a quassinoid isolated from Brucea species ().Citation1 BCT and its close analog, brusatol, have been demonstrated to exhibit an array of biological activities, including anti-inflammatory and anti-neoplastic activities in vitro and in vivo.Citation2-4 Remarkably, BCT has shown potent cytotoxic effects with a panel of leukemia and lymphoma cell lines, but not with normal peripheral human lymphocytes. In HeLa cervical cancer cells, BCT irreversibly inhibited protein synthesis and moderately inhibited DNA synthesis.Citation5 Brusatol was found responsible for promoting HL-60 leukemic cell differentiation by inducing the activation of NF-κB through its translocation into the nucleus.Citation6 Brusatol appeared to induce terminal differentiation in a variety of leukemic cell lines possibly through down-regulation of c-MYC protein expression.Citation3 Furthermore, BCT induced cell death in several multiple myeloma (MM) cell lines including U266, H929 and RPMI 8226.Citation2
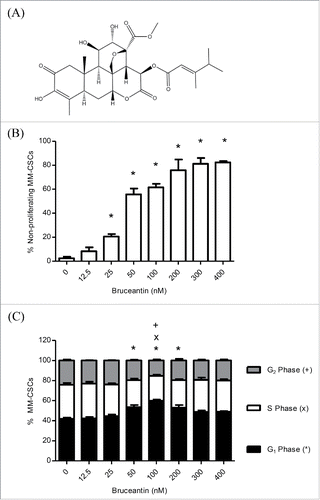
Figure 1. Effect of BCT on MM-CSCs proliferation and cell cycle distribution. Chemical structure of BCT (A). MM-CSCs were treated with vehicle control or increasing concentrations of BCT for 24 h. Cells were stained with VPD450 for proliferation assays (B), or fixed, permeabilized and treated with the FxCycle DNA stain for cell cycle analyses (C). Cell proliferation and DNA content were quantified by flow cytometry (at least 10,000 cells counted) as described in Materials and Methods. The percentage of MM-CSCs in each cell cycle phase was calculated using the Attune software provided by the manufacturer (C). Results represent the means ± SEM of at least 3 independent experiments. Percentage of non-proliferating MM-CSCs (*), MM-CSCs in G1 phase (*), S phase (x) or G2 phase (+) significantly different from control values as determined by a one-way ANOVA, followed by Bonferroni multiple comparison test (p < 0.05).
MM is a devastating hematological malignancy with a median survival time of 3 years.Citation2 Despite the development of numerous novel pharmacological strategies, MM accounts for nearly 12,000 deaths per year in the United States.Citation2 This has been attributed to the presence of the rare “cancer stem cell” population. Cancer stem cells (CSCs) have been implicated in virtually all malignancies, including both hematological and solid tumors.Citation7,8 CSCs are characterized by self-renewal, differentiation potential, resistance and migratory abilities.Citation9-11 These properties render CSCs capable of regenerating the entire tumor when inoculated in immunodeficient mice.Citation9
Matsui and colleagues shed some light on the identity of MM-CSCs.Citation7 The vast majority of malignant plasma cells found in both MM cell lines and clinical samples express the cell surface antigen syndecan-1 (also known as CD138), the expression of which is limited to terminally differentiated plasma cells. In comparison to CD138+ cells, a small population of CD138− cells, from both myeloma cell lines and clinical MM samples, were highly resistant to conventional MM therapies and exhibited greater clonogenic potential both in vitro and in NOD/SCID mice.Citation7 The results provided by Matsui and colleagues demonstrated that MM “cancer stem cells” existed and indeed exhibited the ability to rejuvenate MM tumor. However, compounds that combat CSCs remain unknown, and the identification of such compounds is urgently needed as it may significantly improve the prognosis of MM patients.
Using the RPMI 8226 cells-SCID mouse xenograft model, BCT prevented tumor growth, and resulted in a significant regression and apoptosis in pre-established tumors. No overt toxicity was observed after BCT treatment in this model.Citation2 This, combined with the fact that the tumorigenic potential in the RPMI 8226 cells is attributed to the presence of the rare MM-CSCs population, but not to the bulk cells, suggests that BCT may exert activity against MM-CSCs.Citation12,13
Given the growing importance of MM-CSCs and their profound clinical implications, as well as the supposition that BCT may act on MM-CSCs, it was of interest to study the impact of BCT on MM-CSCs. To address these questions, specific experiments were designed to determine the impact of BCT on: 1) the proliferation/viability of MM-CSCs, 2) the migration of MM-CSCs, 3) angiogenesis, and 4) the possible mechanism of action by which BCT exerts antiproliferative effects in MM-CSCs.
Results
BCT inhibits the proliferation of MM-CSCs and induces cell cycle arrest
The effect of BCT on the growth of MM-CSCs was examined using the MTT assay. A 72 h treatment with BCT inhibited MM-CSCs growth in a dose-dependent manner with an IC50 value of 77.0 ± 4.9 nM. As bortezomib (BTZ) has been demonstrated to reduce the fraction of RPMI-8226- and AMO1-derived cancer stem cells,Citation14 it was used as positive control for this assay, and an IC50 value of 8.9 ± 1.1 nM for BTZ was found in MM-CSCs.
To obtain a more informed evaluation of the effects of BCT on cell proliferation, flow cytometric analysis using VPD450 staining was employed. A 24 h treatment with BCT inhibited cell proliferation in a dose-dependent manner (). Vehicle control-treated MM-CSCs displayed a negligible percentage of non-proliferating cells of 2.4 ± 1.2%, and a significant reduction of proliferation was observed at doses as low as 25 nM. The percentage of non-proliferating MM-CSCs was further increased to reach a plateau starting at 200 nM.
The effect of BCT on cell cycle distribution was evaluated by analyzing the DNA content of MM-CSCs treated with BCT for 24 h using the DNA specific FxCycle violet stain. The amount of cells in the G1 phase was significantly increased from 42.0 ± 1.1% in vehicle control to 53.4 ± 2.2, 59.8 ± 1.2, and 53.0 ± 2.6% at 50, 100 and 200 nM BCT, respectively. This increase was no longer observed at doses higher than 200 nM (). In the S and G2 phases, a significant decrease was observed at 100 nM BCT (24.9 ± 1.1 and 15.3 ± 1.1%) in comparison to the vehicle control (33.9 ± 1.8 and 24.2 ± 1.1%), respectively (). In addition, a cellular count was performed at the time of treatment (T = 0 h) and 24 h after the addition of BCT (Fig. S1). Results indicated that starting at 100 nM, the cell count was similar to that at T = 0 h. This combined to the cell cycle distribution suggested that treatment with BCT led to an accumulation of MM-CSCs in the G1 phase at moderate doses (50, 100 and 200 nM). At higher doses (300 and 400 nM), it appears as if BCT halted the progression through the cell cycle, rather than causing an accumulation in a certain cell cycle phase.
BCT induces MM-CSCs death and apoptosis
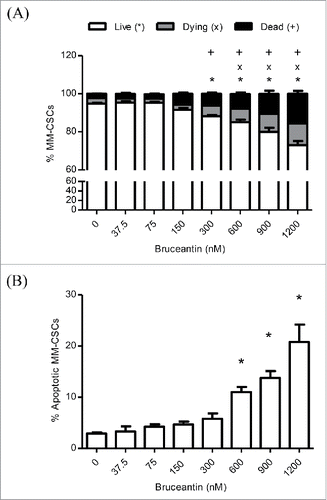
The effects of BCT on the viability and mortality of MM-CSCs was then examined using the calcein/ethidium homodimer (EH) flow cytometric staining as described in Materials and Methods. It was found that a 24 h BCT treatment caused a significant reduction in the amount of viable cells (calcein+ EH-), as well as a significant increase in the amount of dying (calcein+ EH+) and dead (calcein+ EH-) MM-CSCs in a dose-dependent manner (). After assessing the extent of cell death in MM-CSCs in response to BCT, annexin V/PI staining was used to assess whether or not MM-CSCs were undergoing apoptotic cell death in response to BCT treatment. The proportion of annexin V+ MM-CSCs augmented significantly starting at 600 nM (), indicating that BCT induced apoptosis after a 24 h treatment in a dose-dependent manner. Taken together, these results suggest that BCT is cytotoxic to MM-CSCs starting at 600 nM.
Figure 2. Effect of BCT on MM-CSCs viability. MM-CSCs were treated with vehicle control or increasing concentrations of BCT for 24 h, and then stained with calcein AM/ethidium homodimer for cell viability/death (A), or annexin V/propidium iodide for apoptosis (B). As described in Materials and Methods, live/dead and apoptotic cells were quantified by flow cytometry (at least 10,000 cells were counted), and the percentage of live, dying, dead, or apoptotic cells was determined using the software provided by the flow cytometer manufacturer. Results represent the means ± SEM of at least 3 independent experiments. Percentage of living (*), dying (x), dead (+), or apoptotic MM-CSCs (*) significantly different from control values as determined by a one-way ANOVA, followed by Bonferroni multiple comparison test (p < 0.05).
BCT may act through the Notch signaling pathway in MM-CSCs
The effect of BCT on CSCs specific genes was evaluated by qPCR. Significant increases were observed in the mRNA level of genes representing either direct members or important targets of the Notch pathway, including Notch1, HES1, PBX1, and RUNX1,Citation15-17 indicating that BCT may activate the Notch pathway in MM-CSCs ().
Figure 3. Effect of BCT, with or without RO, on the mRNA level of members of the Notch signaling pathway in MM-CSCs. (A) MM-CSCs were treated with vehicle control or increasing concentrations of BCT for 24 h. (B) For experiments involving RO, MM-CSCs were pretreated with vehicle control or 10 µM RO for 24 h, followed by increasing concentrations of BCT for 24 h. mRNA was collected for gene expression analysis as described in Materials and Methods. Relative mRNA expression of Notch1, HES1, PBX1, RUNX1 in MM-CSCs after BCT, or BCT + RO treatment is shown. Each bar represents the mean ± SEM of 3 independent experiments. *Values significantly different from vehicle control, as measured by one-way ANOVA followed by Bonferroni multiple comparison test (p < 0 .05). +Values significantly different from control treated cells (BCT alone) as determined by a 2-way ANOVA (p < 0.05).
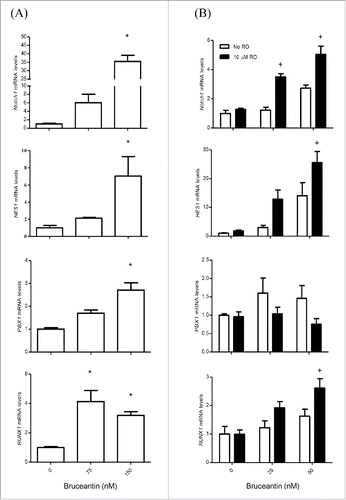
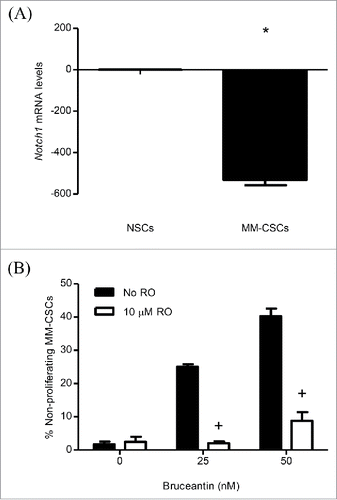
Having observed alterations in the gene expression of Notch pathway members, the effect of BCT in MM-CSCs was evaluated in the presence of an inhibitor of the Notch pathway, the γ-secretase inhibitor RO4929097 (RO).Citation18 RO has been shown to inhibit γ-secretase with an IC50 of 4 nM, cellular processing of Aβ40 with an IC50 of 14 nM, and the production of intracellular Notch with an IC50 of 5 nM.Citation18 MM-CSCs were pretreated with RO for 24 h, and the effects of BCT on mRNA levels of the genes involved in the Notch signaling pathway and on cell proliferation were evaluated. Results showed that treatment of cells with RO alone did not affect the mRNA level of these genes (Fig. S2A-D), nor did it show any effect on MM-CSCs proliferation (Fig. S2E). Surprisingly, and contrary to our expectation that RO would reverse the effect of BCT on gene expression, pretreatment of MM-CSCs appeared to further increase the BCT effect on the mRNA levels of Notch1, HES1, RUNX1. RO pretreatment did not affect PBX1 the same way it affected Notch1, HES1 and RUNX1, meaning that RO pretreatment may have blocked PBX1 upregulation (). However, when compared to NSCs, Notch1 expression in MM-CSCs was significantly lower (); and pretreatment of MM-CSCs with 10 µM RO appeared to reverse the BCT-induced effects on cell proliferation (), indicating that BCT may exert its antiproliferative effects on MM-CSCs via Notch.
Figure 4. Effect of RO on BCT-induced inhibition of MM-CSCs proliferation. mRNA was collected from NSCs and MM-CSCs for gene expression analyses as described in Materials and Methods, and relative mRNA expression of Notch1 is shown (A). MM-CSCs were pretreated with vehicle control or 10 µM RO for 24 h, followed by increasing concentrations of BCT for 24 h. MM-CSCs were then stained with VPD450 as described in Materials and Methods. Proliferation was quantified by flow cytometry (at least 10,000 cells were counted), and the percentage of non-proliferating MM-CSCs in response to each condition was determined using the software provided by the flow cytometer manufacturer (B). Results represent the means ± SEM of at least 3 independent experiments. *Values significantly different from control NSCs, as determined by unpaired t-test (p < 0 .05). +Percentage of treated non-proliferating cells (10 µM RO + BCT) significantly different from control treated cells (BCT alone) as determined by a 2-way ANOVA (p < 0.05).
BCT inhibits MM-CSCs migration and exhibits anti-angiogenic properties in vitro
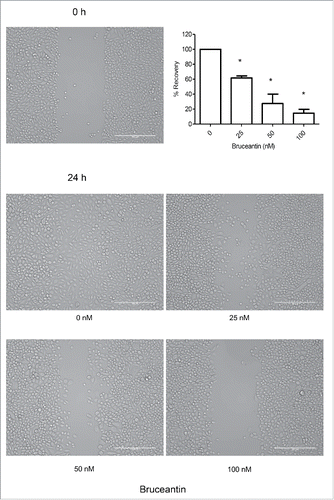
To address the impact of BCT on MM-CSCs migratory abilities, the in vitro scratch assay was selected. The premise of this assay is that upon creating a scratch on a confluent MM-CSCs layer, cells located on the edge of the scratch will migrate to fill the empty space created by the scratch.Citation19 BCT treatment potently inhibited the migration of MM-CSCs in a dose-dependent manner, with significant results observed with concentrations as low as 25 nM. With vehicle control treatment, cells completely filled the scratch after 24 h. However, with increasing BCT concentrations, the scratch space gradually stayed unfilled (). At 100 nM, cells did not refill at all the empty space created by the scratch, indicating that the migratory ability was totally abolished at that concentration (). To confirm that this effect was indeed due to the inhibition of migration, cell proliferation at confluence and doubling time were evaluated. When confluent, the MM-CSCs proliferation was minimal (Fig. S3A) and the MM-CSCs doubling time was evaluated to be about 16 h (Fig. S3B). With this information, the migration assay was repeated with a treatment time of only 8 h and results showed that BCT also inhibited MM-CSCs migration (Fig. S3C). This suggests that scratch refilling was mainly due to cell migration.
Figure 5. Effect of BCT on MM-CSCs migration. Confluent MM-CSCs were scratched using a 10 µL pipette tip, and photos of the scratch were taken immediately after the scratch. MM-CSCs were then treated with vehicle control or increasing concentrations of BCT for 24 h. Additional photos were taken at the exact same spot as before treatment in order to view differences in migration. Results are representative of 3 independent experiments (scale bar = 200 µm), and quantification of the migration effect was conducted as described in Materials and Methods. *Anti-migratory effect significantly different from vehicle control values as determined by a one-way ANOVA, followed by Bonferroni multiple comparison test (p < 0.05).
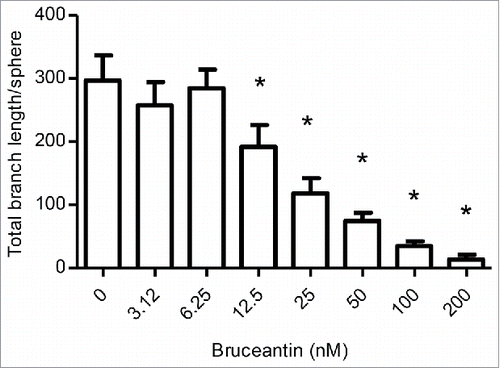
Given these results, an optimized 3-dimensional in vitro model was used for the assessment of angiogenesis. This 3D assay models angiogenesis in multiple respects, as it involves human umbilical vein endothelial cells (HUVECs) undergoing a complex process that requires several morphological changes in order to establish tube formation, such as degradation of the basement membrane by secreted proteases, sprouting, alignment, proliferation, lumen formation, branching, and anastomosis. Results indicated that BCT potently inhibited angiogenesis. Treatment caused a significant reduction in all angiogenic parameters measured. This included the total branch length (), total segment length, number of anchorage junctions, branches, segments, junctions and nodes (Fig. S4). Significant differences started between 12.5 and 50 nM, depending on the parameter, and decreased in a dose-dependent manner. Representative pictures of the effects of BCT on angiogenesis are displayed in Fig. S5.
Figure 6. Effect of BCT on angiogenesis. Cultures were prepared and treated with vehicle control or increasing concentrations of BCT for 4 d to follow sprout evolution as described in Materials and Methods. The effect of BCT on the total branch length/sphere formed by HUVECs is displayed. Results represent the means ± SEM of at least 3 independent experiments. *Anti-angiogenic effect significantly different from vehicle control values as determined by a one-way ANOVA, followed by Dunett multiple comparison test (p < 0.05).
Discussion
The CSCs paradigm offers a plausible explanation for the development of multidrug resistance to conventional therapies and tumor recurrence in MM. As conventional therapies mostly eliminate only non-CSCs, therapies that target CSCs or both non-CSCs and CSCs could be of significant clinical impact. Therapies capable of targeting CSCs could eliminate the tumor by attrition if they are used alone, or by cooperation with conventional therapies that target non-CSCs. Thus, CSCs represent an attractive target as their inhibition may have profound clinical implications with respect to resistance, tumor recurrence, metastasis and angiogenesis. However, compounds that target MM-CSCs remain clinically unavailable.
The purpose of this study was to thoroughly examine the effects of BCT on MM-CSCs proliferation. BCT has been previously shown to interfere with the viability of U266, H929 and RPMI 8226 myeloma cells in vitro. More importantly, upon RPMI 8226 cells inoculation in a mouse xenograft model, BCT prevented tumor regeneration and resulted in regression of already established tumors.Citation2 Preliminary MTT assays suggested that BCT may exhibit cytostatic effects on MM-CSCs in the nanomolar range. However, to obtain a more informed evaluation of the effects of BCT on cell proliferation, flow cytometric analysis using VPD450 staining was employed. VPD450 is a proliferation dye that is cleaved by an esterase upon diffusion through the cytoplasmic membrane and becomes highly fluorescent within viable cells.Citation20 It showed that BCT potently inhibited the proliferation of MM-CSCs. These results provided a rational explanation for the tumor prevention growth observed in our previous studies.
In addition, previously published results showed that BCT induced apoptosis in RPMI 8226, U266 and H929 MM cell lines in a caspase-dependent manner.Citation2 This, combined with the observation that BCT resulted in a significant increase of apoptosis in tumors derived from animals established from the inoculation of RPMI 8226 cells in mouse xenograft studies, prompted us to examine whether BCT was cytotoxic toward MM-CSCs. For this reason, calcein/EH staining and annexin V/PI were used and showed that BCT induced MM-CSCs death and apoptosis.
The Notch signaling pathway is highly conserved and involved in a number of key cellular processes, including proliferation, differentiation, apoptosis and angiogenesis.Citation21 The activation of this pathway has been shown to be involved in a number of malignancies, including T-cell leukemia, breast cancer and pancreatic cancer.Citation22-25 In contrast, a growing number of studies showed that this pathway played tumor suppressive roles in liver, head and neck, and haematopoietic malignancies. With respect to hematological malignancies, mutations in the Notch pathway genes have been identified in chronic myelomonocytic leukemia (CMML), and in vivo loss of Notch signaling resulted in a CMML-like disease in mice.Citation26 Moreover, Lobry et al. showed that Notch signaling was silenced in both human primary acute myeloid leukemia (AML) samples and animal models of the disease.Citation22 Interestingly, the mRNA expression of Notch1 and HES1, but not that of Notch2, was significantly decreased in both human AML samples and AML-CSCs in comparison to normal CD34+ haematopoietic stem and progenitor cells. In vitro and in vivo activation of Notch signaling induced rapid cell cycle arrest, differentiation, and apoptosis of AML-CSCs cells, whereas Notch inactivation was found to contribute to an AML-like disease in vivo.Citation22 Taken together, these results provide compelling evidence that 1) Notch signaling may function as a tumor suppressor in hematological malignancies such as AML, 2) Notch receptor agonists may be a potential therapeutic target in AML.Citation22 In alignment with the studies conducted by Lobry et al.,Citation22,26 results from the present study demonstrated that the expression of Notch1 was downregulated in MM-CSCs when compared to NSCs. BCT treatment resulted in a significant up-regulation of the expression of several Notch pathway members or associates, particularly Notch1 and its downstream target HES1, but did not appear to affect Notch2 (data not shown). Furthermore, the use of a γ-secretase inhibitor (RO) reversed the effects of BCT on MM-CSCs proliferation. Taken together, these results suggest a possible involvement of the Notch signaling pathway in mediating the antiproliferative effects of BCT in MM-CSCs. The increase in mRNA expression of Notch1, HES1 and RUNX1, but not PBX1, by BCT after RO pretreatment points out to a differential regulation of Notch gene targets. In addition, a plethora of recent evidence suggests the existence of non-canonical Notch signaling mechanisms and cross-talks with other signaling pathways.Citation27 As a consequence, the regulation of both Notch activation and Notch inhibition is complex and context-dependent. For instance, RO treatment effectively inhibited the growth of glioma CSCs and suppressed the expression of various Notch target genes,Citation28 whereas in breast CSCs RO increased self-renewal although it downregulated Notch targets.Citation29 These effects were not observed in the context of MM-CSCs. Therefore, in the context of MM-CSCs/RO pretreatment, BCT could exhibit different effects on the tested Notch target genes. Given that Notch1, HES1, PBX1 and RUNX1 are not the only Notch targets, further studies are needed to characterize how downstream Notch targets affect MM-CSCs proliferation.
CSCs have been demonstrated to have the ability to migrate, invade and colonize distant locations. These migratory abilities are subsequently responsible for metastatic dissemination.Citation30 On the other hand, accumulating evidence indicated that CSCs and angiogenesis exhibited a mutual cooperative effect on tumor growth, and the ablation of tumor vessels is a desired effect as it could reduce the fraction of CSCs.Citation31 For instance, glioma-derived CSCs have been shown to be an essential source of angiogenic factors, including vascular endothelial growth factor (VEGF), which resulted in an amplified endothelial migration and tube migration in vitro and in vivo.Citation31-33 In contrast, angiogenic inhibition in xenografts tumors led to a depletion of brain tumor CSCs and arrested tumor growth, indicating that brain tumor CSCs depended on tumor vasculature.Citation34 Having observed that BCT was capable of inhibiting both MM-CSCs migration and HUVECs angiogenesis in vitro, this suggests that BCT is a multi-target molecule worth pursuing in MM disease models.
This is one of the early reports demonstrating the potential of a natural product to inhibit the growth of MM-CSCs. In this study, evidence is provided that BCT was capable of inhibiting the proliferation of MM-CSCs, as well as inducing cell cycle arrest, cell death and apoptosis in MM-CSCs. These effects were possibly mediated by the Notch signaling pathway. BCT also showed potent inhibition of both MM-CSCs migration and angiogenesis in vitro. Unlike BCR-Abl-dependent leukemia and HER-2-dependent breast cancer, which are single-gene-dependent carcinomas, MM is a disease that involves multiple genetic lesions in several signaling pathways.Citation35 Therefore, a multi-targeted therapy is desirable. The capability of BCT to inhibit multiple processes important for the development of cancer provides a strong indication of the potential value of this compound. Further development including more advanced testing in relevant MM models is clearly warranted.
Materials and methods
Chemicals and biologicals
BCT was obtained from the National Cancer Institute. BTZ and RO were purchased from Selleckchem. MTT, calcein, and EH were purchased from Sigma Aldrich. Phosphate buffered saline was purchased from Life Technologies.
Cell culture
Human MM-CSCs were purchased from Celprogen. MM-CSCs were derived from the bone marrow of a MM patient. MM-CSCs are CD44+, CD166+ and CD138−. These markers have previously been used to identify CSCs derived from a variety of tumors.Citation36 According to Celprogen, the tumorigenicity of MM-CSCs is < 1000 cells. MM-CSCs were maintained in MM-CSCs complete growth medium (Celprogen). Experiments using MM-CSCs were conducted at cell passages between 4 to 12. Normal haematopoietic stem cells (NSCs), that are CD34+, were purchased from Life Technologies. NSCs were grown in StemPRO-34 medium (Life Technologies), supplemented with Cytokine Mix E (PromoCell). HUVECs and normal human dermal fibroblasts NHDFs were obtained from PromoCell. HUVECs were grown in endothelial complete growth medium 2 combined with 2% Supplement Mix (PromoCell). NHDFs cells were grown in complete fibroblast growth medium supplemented with 5 µg/mL insulin and 1 ng/mL human basic fibroblast growth factor. Experiments using HUVECs and NHDFs cells were conducted at cell passages between 2 to 7. All cell types were passaged every 2–3 days, and were maintained in a humidified atmosphere supplemented with 5% CO2 at 37°C (standard conditions).
General experimental procedures
For cell proliferation, cell cycle analysis, live/dead cell, and annexin V/PI assays, MM-CSCs were seeded in 12-well plates at a density of 30,000 cells per well. MM-CSCs were allowed to adhere for 24 h under standard conditions and then treated with increasing concentrations of BCT for 24 h. For mechanistic studies that utilize the γ-secretase inhibitor RO, MM-CSCs were seeded in 12-well plates at a density of 30,000 cells per well. MM-CSCs were allowed to adhere for 24 h under standard conditions and then treated with vehicle control or 10 µM of RO for 24 h. After this, 0, 25 or 50 nM of BCT were added for 24h. Flow cytometric analyses were conducted on the Attune Acoustic Focusing Flow Cytometer (Applied Biosystems, Life Technologies).
MTT viability assay
The MTT viability assay was used to evaluate the growth inhibitory activity of BCT and performed as previously described.Citation37,38 Briefly, MM-CSCs were seeded in 96-well plates at a density of 5,000 cells per well. The cells were allowed to adhere for 24 h under standard conditions and then treated with increasing concentrations of BCT (0 – 400 nM). After a 72 h incubation, 20 µL of MTT solution (5 mg/mL) were added to the cells for 2 h. The media and MTT mixture were aspirated and the formazan-containing cells were solubilised in 100 µL of DMSO. The percentage of cell viability was calculated as the absorbance of each test well divided by that of the vehicle control wells and then multiplied by 100. The concentration that resulted in a 50% reduction in viability (IC50) was determined from at least 5 different concentrations using GraphPad Prism 5.0 software.
Cell proliferation
Following treatment with BCT, floating and adherent MM-CSCs were collected, washed with PBS, counted or adjusted to 10Citation6 cells/mL in PBS for proliferation assay. MM-CSCs were incubated with the violet proliferation dye 450 (VPD450, BD Bioscience) for 15 min at 37°C. Cell proliferation analyses were conducted using the Attune flow cytometer according to the manufacturer's protocol.Citation20
Cell cycle analysis
Following treatment with BCT, floating and adherent cells were collected, fixed and permeabilized with Fix and Perm reagents (Life Technologies), washed with PBS, adjusted to 10Citation6 cells/mL in PBS, and incubated with the DNA selective stain FxCycle (Life Technologies) at room temperature for 30 min according to the manufacturer's instructions.Citation39 After the incubation period, cell cycle analysis was conducted using the Attune flow cytometer.
Viability and apoptosis staining
MM-CSCs were analyzed by flow cytometry using calcein/EH to quantify live/dead cells and annexin V/PI (Life Technologies) staining to quantify apoptotic cells as previously described.Citation40,41 Following treatment with BCT, floating and adherent cells were collected, washed with PBS, adjusted to 10Citation6 cells/mL, and incubated with the corresponding stain at room temperature for 15 min. After the incubation period, cells were analyzed using the Attune flow cytometer.
Quantitative real-time PCR analysis of mRNA expression
NSCs and MM-CSCs (following treatment with BCT ± RO) were lysed according to the manufacturer's instructions (Bio-Rad), and total RNA was isolated from cell lysates using the Aurum total RNA Mini Kit. RNA (0.5 μg) was reverse-transcribed using the “high capacity total RNA to cDNA” Reverse Transcriptase (Life Technologies) and a PCR standard thermal cycler (Applied Biosystems). One µL of the cDNA product was amplified by quantitative PCR using 125 nM gene-specific primers in a total volume of 20 µL using a SYBR Green PCR Kit (Applied Biosystems) and a Step One Plus real-time PCR thermal cycler (Applied Biosystems). Custom primers for GAPDH, 18S, Notch1, HES1, PBX1 and RUNX1 were designed on http://bioinfo.ut.ee/primer3-0.4.0/ and purchased from Life Technologies.Citation42,43 Relative gene expression was normalized to the average of 2 housekeeping genes 18S and GAPDH using the ΔΔCT method.Citation44
Cell migration assay (scratch assay)
Scratch assays were conducted as previously described.Citation19 MM-CSCs were seeded in 24-well plates at a density of 100,000 cells per well. MM-CSCs were allowed to adhere for a period of 24 h during which the wells were completely covered with a monolayer of MM-CSCs. A scratch was drawn in each well using a 10 µL pipette tip and photos were taken shortly afterwards using the Cytation 3 Cell Imaging Reader (Biotek). MM-CSCs were then treated with increasing concentrations of BCT for 24 h. The CellTracker Green CMFDA Dye (Life Technologies), a fluorescent dye designed for the monitoring of cell movement, was added onto the cells for 30 minutes; scratch was then inflicted, and increasing doses of BCT were added for 8 h. Photos of the same spot in each well were then taken to demonstrate migration inhibitory capabilities of BCT. A quantification of the inhibitory effect of BCT on migration was conducted by dividing the width of the same scratch at 24 h by that at 0 h and multiplied by 100 to denote the percent unfilled space; the percent recovery was calculated as the percent unfilled space subtracted from 100.
Angiogenesis assay
The angiogenesis assay was conducted as previously described with a few modifications.Citation45 Briefly, fibrin bead assays were employed to analyze the 3D sprouting of HUVECs from the surface of dextran-coated cytodex 3 microcarrier beads embedded in fibrin gels (GE Healthcare). HUVECs were mixed with cytodex 3 microcarrier beads at a cell density of 400 HUVECs per bead in a solution of 1000 beads/ml EGM-2 medium. Beads and HUVECs were co-incubated at 37°C and 5% CO2 and gently shaken every 20 min for 4 h to allow HUVECs to adhere to the bead surface. HUVEC-coated beads were then transferred to a 75 cmCitation2 tissue culture flask and incubated for 24 h. After incubation, HUVEC-coated beads were collected and resuspended at a density of 500 cell-coated beads/mL in a solution of fibrinogen type I (2.5 mg/mL) containing aprotinin (0.15 U/mL). VEGF (10 ng/mL) was added to the bead suspension. Eighty µL of fibrinogen type I-aprotinin-coated beads solution were gently mixed and allowed to clot for 2 min at room temperature and then at 37°C and 5% CO2 for 30 min to promote gel formation. Thrombin (0.04 U) was added to each well and mixed gently. One hundred twenty µL of ECGM-2 medium containing VEGF (5 ng/mL) were added to each well and equilibrated with the bead-containing gels for 30 min at 37°C and 5% CO2. Afterwards, 3700 NHDF were added on top of the gel and allowed to adhere. After 1 h, ECGM-2 was replaced by fresh medium with or without test compounds. Culture medium was replaced after 24 h, and then every 48 h. Sprouting appeared between 2 and 3 d incubation. Cultures were imaged at day 4. In order to quantify the sprouting microvessel network, samples were automatically scanned with a high throughput imager (IXM, Molecular Device) at 4x magnification at 4 sites of each well in order to cover the entire surface of the well. Morphometric parameters of the vessel network were measured using a plugin for the ImageJ software derived from the Angiogenesis Analyzer.Citation46
Statistical analysis
Each experiment was repeated at least 3 times. All data are expressed as mean ± SEM. An unpaired t-test was used for statistical comparison of experiments involving 2 groups. One-way analysis of variance (ANOVA) was used for multiple comparisons in experiments with one independent variable. Two-way ANOVA was used for multiple comparison procedures in experiments with 2 independent variables. A Bonferroni or a Dunett test was used for post-hoc analysis of the significant ANOVA. A difference in mean values between groups was considered to be significant when p ≤ 0.05.
Disclosure of potential conflicts of interest
No potential conflicts of interest were disclosed.
Supplemental_Figures.docx
Download MS Word (914.9 KB)Acknowledgments
This work is part of the European COST Action CM1106: “Chemical Approaches to Targeting Drug Resistance in Cancer Stem Cells.”
References
- Cuendet M, Pezzuto JM. Antitumor activity of bruceantin: an old drug with new promise. J Nat Prod 2004; 67:269-72; PMID:14987068; http://dx.doi.org/10.1021/np030304+
- Cuendet M, Christov K, Lantvit DD, Deng Y, Hedayat S, Helson L, McChesney JD, Pezzuto JM. Multiple myeloma regression mediated by bruceantin. Clin Cancer Res 2004; 10:1170-9; PMID:14871997; http://dx.doi.org/10.1158/1078-0432.CCR-0362-3
- Mata-Greenwood E, Cuendet M, Sher D, Gustin D, Stock W, Pezzuto JM. Brusatol-mediated induction of leukemic cell differentiation and G(1) arrest is associated with downregulation of c-myc. Leukemia 2002; 16:2275-84; PMID:12399973; http://dx.doi.org/10.1038/sj.leu.2402696
- Ren D, Villeneuve NF, Jiang T, Wu T, Lau A, Toppin HA, Zhang DD. Brusatol enhances the efficacy of chemotherapy by inhibiting the Nrf2-mediated defense mechanism. Proc Natl Acad Sci U S A 2011; 108:1433-8; PMID:21205897; http://dx.doi.org/10.1073/pnas.1014275108
- Liao LL, Kupchan SM, Horwitz SB. Mode of action of the antitumor compound bruceantin, an inhibitor of protein synthesis. Mol Pharmacol 1976; 12:167-76; PMID:1256442
- Cuendet M, Gills JJ, Pezzuto JM. Brusatol-induced HL-60 cell differentiation involves NF-kappaB activation. Cancer Lett 2004; 206:43-50; PMID:15019158; http://dx.doi.org/10.1016/j.canlet.2003.11.011
- Matsui W, Huff CA, Wang Q, Malehorn MT, Barber J, Tanhehco Y, Smith BD, Civin CI, Jones RJ. Characterization of clonogenic multiple myeloma cells. Blood 2004; 103:2332-6; PMID:14630803; http://dx.doi.org/10.1182/blood-2003-09-3064
- Dalerba P, Cho RW, Clarke MF. Cancer stem cells: models and concepts. Annu Rev Med 2007; 58:267-84; PMID:17002552; http://dx.doi.org/10.1146/annurev.med.58.062105.204854
- O'Brien CA, Kreso A, Jamieson CH. Cancer stem cells and self-renewal. Clin Cancer Res 2010; 16:3113-20; PMID:20530701; http://dx.doi.org/10.1158/1078-0432.CCR-09-2824
- Yu Y, Ramena G, Elble RC. The role of cancer stem cells in relapse of solid tumors. Front Biosci 2012; 4:1528-41; PMID:22201973; http://dx.doi.org/10.2741/e478
- Abdullah LN, Chow EK. Mechanisms of chemoresistance in cancer stem cells. Clin Transl Med 2013; 2:3; PMID:23369605; http://dx.doi.org/10.1186/2001-1326-2-3
- Jakubikova J, Adamia S, Kost-Alimova M, Klippel S, Cervi D, Daley JF, Cholujova D, Kong SY, Leiba M, Blotta S, et al. Lenalidomide targets clonogenic side population in multiple myeloma: pathophysiologic and clinical implications. Blood 2011; 117:4409-19; PMID:21321360; http://dx.doi.org/10.1182/blood-2010-02-267344
- Matsui W, Wang Q, Barber JP, Brennan S, Smith BD, Borrello I, McNiece I, Lin L, Ambinder RF, Peacock C, et al. Clonogenic multiple myeloma progenitors, stem cell properties, and drug resistance. Cancer Res 2008; 68:190-7; PMID:18172311; http://dx.doi.org/10.1158/0008-5472.CAN-07-3096
- Nara M, Teshima K, Watanabe A, Ito M, Iwamoto K, Kitabayashi A, Kume M, Hatano Y, Takahashi N, Iida S, et al. Bortezomib reduces the tumorigenicity of multiple myeloma via downregulation of upregulated targets in clonogenic side population cells. PLoS One 2013; 8:e56954; PMID:23469177; http://dx.doi.org/10.1371/journal.pone.0056954
- Katoh M, Katoh M. Integrative genomic analyses on HES/HEY family: Notch-independent HES1, HES3 transcription in undifferentiated ES cells, and Notch-dependent HES1, HES5, HEY1, HEY2, HEYL transcription in fetal tissues, adult tissues, or cancer. Int J Oncol 2007; 31:461-6; PMID:17611704; http://dx.doi.org/10.3892/ijo.31.2.461
- Park JT, Shih IM, Wang TL. Identification of Pbx1, a potential oncogene, as a Notch3 target gene in ovarian cancer. Cancer Res 2008; 68:8852-60; PMID:18974129; http://dx.doi.org/10.1158/0008-5472.CAN-08-0517
- Dudley DD, Wang HC, Sun XH. Hes1 potentiates T cell lymphomagenesis by up-regulating a subset of notch target genes. PLoS One 2009; 4:e6678; PMID:19688092; http://dx.doi.org/10.1371/journal.pone.0006678
- Luistro L, He W, Smith M, Packman K, Vilenchik M, Carvajal D, Roberts J, Cai J, Berkofsky-Fessler W, Hilton H, et al. Preclinical profile of a potent gamma-secretase inhibitor targeting notch signaling with in vivo efficacy and pharmacodynamic properties. Cancer Res 2009; 69:7672-80; PMID:19773430; http://dx.doi.org/10.1158/0008-5472.CAN-09-1843
- Liang CC, Park AY, Guan JL. In vitro scratch assay: a convenient and inexpensive method for analysis of cell migration in vitro. Nat Protoc 2007; 2:329-33; PMID:17406593; http://dx.doi.org/10.1038/nprot.2007.30
- Parish CR. Fluorescent dyes for lymphocyte migration and proliferation studies. Immunol Cell Biol 1999; 77:499-508; PMID:10571670; http://dx.doi.org/10.1046/j.1440-1711.1999.00877.x
- Al-Hussaini H, Subramanyam D, Reedijk M, Sridhar SS. Notch signaling pathway as a therapeutic target in breast cancer. Mol Cancer Ther 2011; 10:9-15; PMID:20971825; http://dx.doi.org/10.1158/1535-7163.MCT-10-0677
- Lobry C, Ntziachristos P, Ndiaye-Lobry D, Oh P, Cimmino L, Zhu N, Araldi E, Hu W, Freund J, Abdel-Wahab O, et al. Notch pathway activation targets AML-initiating cell homeostasis and differentiation. J Exp Med 2013; 210:301-19; PMID:23359070; http://dx.doi.org/10.1084/jem.20121484
- Abel EV, Kim EJ, Wu J, Hynes M, Bednar F, Proctor E, Wang L, Dziubinski ML, Simeone DM. The Notch pathway is important in maintaining the cancer stem cell population in pancreatic cancer. PLoS One 2014; 9:e91983; PMID:24647545; http://dx.doi.org/10.1371/journal.pone.0091983
- Grudzien P, Lo S, Albain KS, Robinson P, Rajan P, Strack PR, Golde TE, Miele L, Foreman KE. Inhibition of Notch signaling reduces the stem-like population of breast cancer cells and prevents mammosphere formation. Anticancer Res 2010; 30:3853-67; PMID:21036696; http://dx.doi.org/10.1158/0008-5472.SABCS-106
- Viatour P, Ehmer U, Saddic LA, Dorrell C, Andersen JB, Lin C, Zmoos AF, Mazur PK, Schaffer BE, Ostermeier A, et al. Notch signaling inhibits hepatocellular carcinoma following inactivation of the RB pathway. J Exp Med 2011; 208:1963-76; PMID:21875955; http://dx.doi.org/10.1084/jem.20110198
- Klinakis A, Lobry C, Abdel-Wahab O, Oh P, Haeno H, Buonamici S, van De Walle I, Cathelin S, Trimarchi T, Araldi E, et al. A novel tumour-suppressor function for the Notch pathway in myeloid leukaemia. Nature 2011; 473:230-3; PMID:21562564; http://dx.doi.org/10.1038/nature09999
- Osipo C, Golde TE, Osborne BA, Miele LA. Off the beaten pathway: the complex cross talk between Notch and NF-kappaB. Lab Invest 2008; 88:11-7; PMID:18059366; http://dx.doi.org/10.1038/labinvest.3700700
- Saito N, Fu J, Zheng S, Yao J, Wang S, Liu DD, Yuan Y, Sulman EP, Lang FF, Colman H, et al. A high Notch pathway activation predicts response to gamma secretase inhibitors in proneural subtype of glioma tumor-initiating cells. Stem Cells 2014; 32:301-12; PMID:24038660; http://dx.doi.org/10.1002/stem.1528
- Debeb BG, Cohen EN, Boley K, Freiter EM, Li L, Robertson FM, Reuben JM, Cristofanilli M, Buchholz TA, Woodward WA. Pre-clinical studies of Notch signaling inhibitor RO4929097 in inflammatory breast cancer cells. Breast Cancer Res Treat 2012; 134:495-510; PMID:22547109; http://dx.doi.org/10.1007/s10549-012-2075-8
- Ratajczak M, Tarnowski M, Staniszewska M, Sroczynski T, Banach B. Mechanisms of cancer metastasis: involvement of cancer stem cells? Minerva Med 2010; 101:179-91; PMID:20562805
- Eyler CE, Rich JN. Survival of the fittest: cancer stem cells in therapeutic resistance and angiogenesis. J Clin Oncol 2008; 26:2839-45; PMID:18539962; http://dx.doi.org/10.1200/JCO.2007.15.1829
- Bao S, Wu Q, Sathornsumetee S, Hao Y, Li Z, Hjelmeland AB, Shi Q, McLendon RE, Bigner DD, Rich JN. Stem cell-like glioma cells promote tumor angiogenesis through vascular endothelial growth factor. Cancer Res 2006; 66:7843-8; PMID:16912155; http://dx.doi.org/10.1158/0008-5472.CAN-06-1010
- Folkins C, Shaked Y, Man S, Tang T, Lee CR, Zhu Z, Hoffman RM, Kerbel RS. Glioma tumor stem-like cells promote tumor angiogenesis and vasculogenesis via vascular endothelial growth factor and stromal-derived factor 1. Cancer Res 2009; 69:7243-51; PMID:19738068; http://dx.doi.org/10.1158/0008-5472.CAN-09-0167
- Calabrese C, Poppleton H, Kocak M, Hogg TL, Fuller C, Hamner B, Oh EY, Gaber MW, Finklestein D, Allen M, et al. A perivascular niche for brain tumor stem cells. Cancer Cell 2007; 11:69-82; PMID:17222791; http://dx.doi.org/10.1016/j.ccr.2006.11.020
- Petrelli A, Valabrega G. Multitarget drugs: the present and the future of cancer therapy. Expert Opin Pharmacother 2009; 10:589-600; PMID:19284362; http://dx.doi.org/10.1517/14656560902781907
- Medema JP. Cancer stem cells: the challenges ahead. Nat Cell Biol 2013; 15:338-44; PMID:23548926; http://dx.doi.org/10.1038/ncb2717
- Mosmann T. Rapid colorimetric assay for cellular growth and survival: application to proliferation and cytotoxicity assays. J Immunol Methods 1983; 65:55-63; PMID:6606682; http://dx.doi.org/10.1016/0022-1759(83)90303-4
- Issa ME, Hall SR, Dupuis SN, Graham CL, Jakeman DL, Goralski KB. Jadomycins are cytotoxic to ABCB1-, ABCC1-, and ABCG2-overexpressing MCF7 breast cancer cells. Anticancer Drugs 2014; 25:255-69; PMID:24231527; http://dx.doi.org/10.1097/CAD.0000000000000043
- Klco JM, Spencer DH, Lamprecht TL, Sarkaria SM, Wylie T, Magrini V, Hundal J, Walker J, Varghese N, Erdmann-Gilmore P, et al. Genomic impact of transient low-dose decitabine treatment on primary AML cells. Blood 2013; 121:1633-43; PMID:23297133; http://dx.doi.org/10.1182/blood-2012-09-459313
- Li M, Liu X, Sun X, Wang Z, Guo W, Hu F, Yao H, Cao X, Jin J, Wang PG, et al. Therapeutic effects of NK-HDAC-1, a novel histone deacetylase inhibitor, on collagen-induced arthritis through the induction of apoptosis of fibroblast-like synoviocytes. Inflammation 2013; 36:888-96; PMID:23549599; http://dx.doi.org/10.1007/s10753-013-9616-0
- Thayanithy V, Park C, Sarver AL, Kartha RV, Korpela DM, Graef AJ, Steer CJ, Modiano JF, Subramanian S. Combinatorial treatment of DNA and chromatin-modifying drugs cause cell death in human and canine osteosarcoma cell lines. PLoS One 2012; 7:e43720; PMID:22957032; http://dx.doi.org/10.1371/journal.pone.0043720
- Koressaar T, Remm M. Enhancements and modifications of primer design program Primer3. Bioinformatics 2007; 23:1289-91; PMID:17379693; http://dx.doi.org/10.1093/bioinformatics/btm091
- Untergasser A, Cutcutache I, Koressaar T, Ye J, Faircloth BC, Remm M, Rozen SG. Primer3–new capabilities and interfaces. Nucleic Acids Res 2012; 40:e115; PMID:22730293; http://dx.doi.org/10.1093/nar/gks596
- Livak KJ, Schmittgen TD. Analysis of relative gene expression data using real-time quantitative PCR and the 2(-Delta Delta C(T)) Method. Methods 2001; 25:402-8; PMID:11846609; http://dx.doi.org/10.1006/meth.2001.1262
- Nakatsu MN, Hughes CC. An optimized three-dimensional in vitro model for the analysis of angiogenesis. Methods Enzymol 2008; 443:65-82; PMID:18772011; http://dx.doi.org/10.1016/S0076-6879(08)02004-1
- Carpentier G. Angiogenesis Analyzer [Internet]. Faculté des Sciences et Technologie, Université Paris Est Creteil, Val de Marne, France [ Updated 2013 December 30; Cited 2016 May 30]. Available from: https://imagej.nih.gov/ij/macros/toolsets/Angiogenesis%20Analyzer.txt