ABSTRACT
Sporadic colorectal cancer (sCRC) is one of the most commonly diagnosed cancers worldwide, but few genetic markers have been identified and used for its early detection. MicroRNAs are diverse cellular regulators in cancer pathogenesis that bind to the 3′-untranslated region (3′-UTR) of their target mRNAs, and variants within the miRNA target sites on sCRC-related genes may influence its pathogenesis. To investigate this possibility, we used a bioinformatical method to screen SNPs for putative changes in miRNA recognition sites within the 3′-UTR of sCRC-related genes. The rs11466537 single nucleotide polymorphism was predicted to modify the regulation of hsa-miR-1193 on the Transforming Growth Factor β Receptor II (TGFBR2) gene. Additionally, luciferase reporter assays indicated that hsa-miR-1193 bound the T allele more strongly than the A allele of rs11466537 (with A being the less frequent variant), and real time-polymerase chain reaction and western blot analysis showed that TGFBR2 is significantly repressed by hsa-miR-1193. Furthermore, overexpression of hsa-miR-1193 promoted HT-29 cell proliferation, while the loss of hsa-miR-1193 inhibited the process. Finally, the rs11466537 genotyping result revealed that the frequency of A allele carriers was 1.5% in the control blood samples, but 0 in the sCRC patients' normal colon tissue samples. Our results demonstrated that hsa-miR-1193 may be involved in sCRC tumourigenesis at least in part by suppression of TGFBR2, and the A allele of rs11466537 disturbed the regulation of hsa-miR-1193 on TGFBR2.
Introduction
Sporadic colorectal cancer (sCRC), accounting for approximately 80% of colorectal cancer (CRC), is the leading cause of cancer mortality worldwide and is often diagnosed at a late stage.Citation1,2 Recently, genetic markers have been increasingly applied for screening sCRC due to their non-invasive nature.Citation3 The development of sCRC may be attributed to the presence of various common or rare genetic variants in multiple genes, but they are largely unidentified and display variable penetrance.Citation4 These variants are thought to act cumulatively to increase the risk of sCRC and presumably to anticipate its onset. Therefore, investigating new loci related to sCRC is a hot topic for researchers.
miRNA, a genetic regulator, can depress mRNA translation by binding to the 3′-UTR of its target genes.Citation5 Dysregulation of miRNAs is involved in many types of diseases including CRC.Citation6 Wu et al. found that miR-32 promotes CRC cell proliferation by suppression of the phosphatase and tensin homolog gene.Citation7 The function of miRNA may be affected not only by miRNA expression level but also the presence of single nucleotide polymorphisms (SNPs) within the 3′-UTR of mRNAs. SNPs of miRNA target sites were reported to be associated with lung and breast cancers, etc..Citation6,8 The T allele of rs696 within the 3′-UTR of NFkBIA was reported to increase CRC susceptibility.Citation9 However, until now, SNPs in the 3′-UTRs of candidate genes related to sCRC have not been largely identified.
We adopted a systematic screening approach to find functional SNPs in the 3′-UTRs of sCRC-related genes. In addition, through a series of experiments, we determined that the A allele of rs11466537 in the 3′-UTR of TGFBR2 disturbed the inhibitory effect of hsa-miR-1193 on the TGFBR2 gene and may be a protective factor for sCRC.
Results
Prediction of SNPs that modify miRNA binding in the 3′-UTR of sCRC-related genes
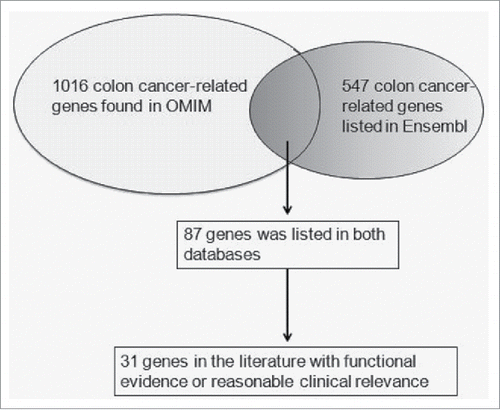
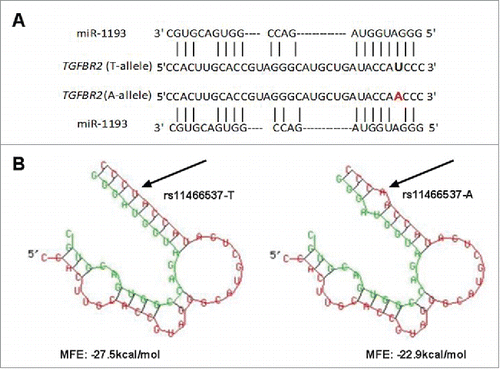
A schematic illustration of the gene selection was shown in . A list of possible functional SNPs in the 3′-UTR of 31 sCRC-related genes and a complete gene list are given in and Table S3, respectively. As shown in , only 9 SNPs were in the seed region of target miRNA and had a reported minor allele (1–10%). Among these 9 SNPs, rs11466537 was located at the target sequence of hsa-miR-1193. Hsa-miR-1193 is predicted to downregulate the T allele more strongly than the A allele in rs11466537 (with A the less frequent variant), as the A allele forms a weaker seed site for hsa-miR-1193 binding (). Similarly, compared with the G allele of rs746978, the minor T allele appeared to have weaker binding with hsa-miR-3200–5p. Furthermore, the MFE change of rs746978 (G>T, SMAD3) and rs11466537 (T>A, TGFBR2) were above 3 kcal mol−1. According to our defined criteria, we inferred that these 2 SNPs might significantly change the regulation of target miRNA; thus, we selected them for further functional studies.
Table 1. Screening results of polymorphisms in miRNA target sites of sCRC-related genes SNPs (minor allele frequencies of 1–10%) were screened from the 3′-UTR regions of 31 sCRC-related genes. SNPs were selected based their occurrence within the miRNA seed region and their influence on miRNA targeting. miRNA recognition sites were perfect reverse complements to the seed region of miRNA sequences. The bold letters show polymorphisms in the recognition site. MFE change indicates the minimum free energy hybridization differences of the minor allele minus the major allele of the SNP. The symbol “+” indicates that a higher energy cost will be gained by miRNA binding with the minor allele, and “-” indicates a smaller cost gained. *SNP sites with MFE change higher than 3 kcal mol−1 were considered for further research.
Figure 2. Bioinformatics prediction of rs11466537 within miR-1193 (A) TGFBR2 is a predicted target of miR-1193 and rs11466537:T>A is just located at the complementary sequence (B) Predicted secondary structure of duplex formation between miR-1193 and 3′-UTR of TGFBR2 by RNAhybrid. rs11466537: T>A changes the MFE, with ancestral form of −27.5 kcal/mol and variant form of −22.9 kcal/mol.
miRNA differentially regulates the allelic variants
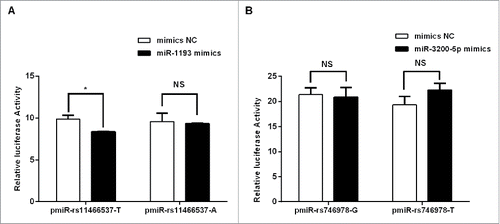
To test our prediction, a dual-luciferase reporter was used for gene expression. TGFBR2 3′-UTR fragments from rs11466537 were cloned into the pmiR vector to compare luciferase activities between the 2 alleles of rs11466537. Hsa-miR-1193 mimics and vectors containing the different rs11466537 alleles were co-transfected into hela cells to measure luciferase activity. The T allele exhibited significantly reduced luciferase activity versus the A allele for rs11466537 () when co-transfected with hsa-miR-1193 mimics. This result is consistent with the showing that target site SNPs affect TGFBR2 regulation. The rs11466537 allele of TGFBR2 may potentially modify its interaction with hsa-miR-1193. However, no miRNA-mediated repression was evident in rs746978 of SMAD3 ().
Figure 3. Effects of target site SNPs on luciferase reporter activity and miRNA targeting. Hela cells were cotransfected with mimics (or mimics-NC) and the pmiR vectors with SNP allele flanking sequences. After 24 h, the luciferase activity was measured by the ratio of firefly and Renilla luciferase signals. The results were expressed as the signal level relative to luciferase activity. (A) The effect of the variant allele of rs11466537 (B) The effect of the variant allele of rs746978. Data were expressed as the means of 3 measurements from 3 independent transfection experiments with 6 assays and the bars represented the SD of the mean. NC: negative control. NS: no significance between the 2 groups. *P < 0.05
Expression of miR-1193 in CRC cell lines
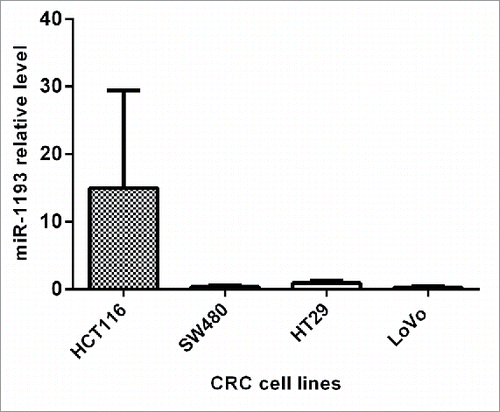
We first analyzed the expression level of hsa-miR-1193 in CRC cell lines. The result showed that miR-1193 was expressed in HCT116, HT-29, SW480 and LoVo from higher level to lower level in order ().
TGFBR2 is repressed by hsa-miR-1193
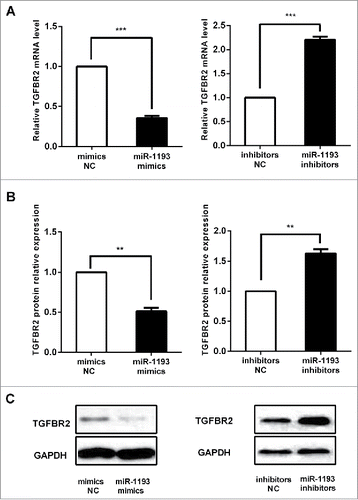
Based on reported TGFBR2 activityCitation10 and our has-miR-1193 expression level in the sCRC cell lines and the microsatellite stability of HT-29,Citation11 the HT-29 cells were selected to perform the gain and loss of function experiments. According to the results of a dual-luciferase reporter assay, we assayed the endogenous TGFBR2 mRNA and protein expression in HT-29 colon cancer cells transfected with mimics or inhibitors of hsa-miR-1193. After transfection with 100 nM hsa-miR-1193 mimics in the cells, TGFBR2 mRNA levels were repressed significantly, while upon inhibition of miRNA, the transcript levels of endogenous TGFBR2 increased (). Densitometric analysis of the western blots of TGFBR2 normalized to GAPDH showed a significant decrease in protein level with the hsa-miR-1193 mimics. In contrast, we observed an increase in TGFBR2 protein when the cells were transfected with hsa-miR-1193 inhibitors (). Representative pictures of TGFBR2 expression were shown in . The influence on the mRNA level is consistent with that on the protein level.
Figure 5. Alteration of hsa-miR-1193 changed TGFBR2 mRNA and protein expression. (A) In HT-29 cells, TGFBR2 mRNA levels were repressed significantly by hsa-miR-1193 mimics. Upon inhibition of hsa-miR-1193, transcript levels of endogenous TGFBR2 increased. (B) Quantitative analysis showed that TGFBR2 protein expression in HT-29 cells transfected with hsa-miR-1193 mimics decreased compared with the mimics-NC. TGFBR2 protein increased in hsa-miR-1193 inhibitor transfected HT-29 cells compared with inhibitors-NC. (C) Representative pictures of TGFBR2 protein expression as detected by western blot. NC: negative control. **P < 0.01, ***P < 0.001.
Hsa-miR-1193 promoted CRC cell proliferation
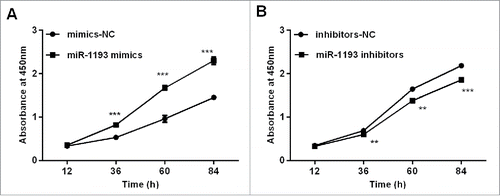
The overexpression of hsa-miR-1193 in HT-29 cells significantly enhanced cell proliferation ability at 48 h after transfection compared with that of the negative control (P < 0.001) (). In contrast, the hsa-miR-1193 inhibitor dramatically restrained HT-29 cell growth at 72 h after transfection compared with negative control (inhibitor-NC) transfected cells (P < 0.001) (). The observations suggested that hsa-miR-1193 played an important role in promoting the cell growth of CRC cells. These results were consistent with previous studies showing that TGFBR2 inhibits cell proliferation.Citation12
Figure 6. Effects of the gain and loss of hsa-miR-1193 on cell proliferation (A) Transfection with hsa-miR-1193 mimics promoted HT-29 cell proliferation compared with negative control mimics at different time points. (B) Transfection with hsa-miR-1193 inhibitors impeded HT-29 cell proliferation compared with the corresponding control at different time points. **P < 0.01, ***P < 0.001. Data were expressed as the means of 3 OD measurements and the bars represented the SD of the mean. The viable cell number was evaluated as the absorbance value at 450 nm.
Association of rs11466537 with sCRC
Normal colon tissue samples from sCRC patients and blood samples from individuals without cancer were sequenced for their rs11466537 genotype. There were 3 heterozygous genotype carriers, and the frequency of the A allele carriers was 1.5% in the control group, but the A allele was not found in the sCRC patients (). Because the A allele of rs11466537 may weaken the inhibitory effect of hsa-miR-1193 on TGFBR2, we hypothesized that this SNP may be a protective marker for sCRC.
Table 2. The distribution of rs11466537 genotypes in the sCRC and normal populations.
Discussion
Our findings first demonstrated that hsa-miR-1193 negatively regulated TGFBR2 in CRC cells. Moreover, we found that the presence of rs11466537-A in the miRNA target site may disrupt the regulation of hsa-miR-1193 on TGFBR2 and might weaken the sCRC risk. The frequency of rs11466537-A carriers in our non-cancer group was 1.5%, but it was not found in the sCRC group.
There are extremely limited experimental methods for miRNA target discovery. Thus, numerous miRNA target prediction algorithms have appeared. Because they now all require stringent seed pairing, the current predictions by TargetScan, PicTar and EMBL have a high degree of overlap.Citation13 These methods were developed to identify putative gene targets and score possible recognition sites according to specific-base pairing rules and conservational analysis.Citation14 In addition, they can also predict that a variant in the miRNA target site could change these miRNA–gene interactions. Now, these algorithms can be performed conveniently and quickly to find new miRNA targets.Citation15 However, these predictions frequently yield false-positive candidates, and experimental validation of the predicted miRNAs is essential to understand miRNA regulation fully.Citation16 Thus, we combined the predicted results from RegRNA and the RNAhybrid database with a luciferase reporter to screen possible functional SNPs in the miRNA target sites of the 3′-UTRs of 31 sCRC-related genes.
Based on the presence of SNPs modifying miRNA-binding (with an MFE change above 3 kcal mol−1.), the A allele of rs11466537 formed a weaker seed site for hsa-miR-1193 binding of TGFBR2 compared with the T allele. Moreover, through the dual-luciferase reporter assay, miRNA-mediated repression was evident only in TGFBR2 and the A allele of rs11466537 weakened the repression. The rs11466537 SNP located in the hsa-miR-1193 binding site of the 3′-UTR of TGFBR2 disrupted its regulation.
The transforming growth factor-β (TGF-β) signaling pathway plays a role of tumor suppresser in normal and early cancer cells. But it contributes to promote tumor progression, invasion in the stage of cancer.Citation17 Genetic variants and inactivation of TGF-β receptor, such as TGFBR2, lead to depress the inhibition of early tumor cell proliferation and increase the synthesis of DNA. This results in the accumulation of further mutations and drives tumor progression. With a variety of carcinogenic factor and the accumulation of mutations, the cell is out of control in the late stage of tumor. Downregulation of TGFBR2, has been reported to be associated with many types of human tumors, including CRC.Citation12,18 It was reported that genomic instability and DNA mismatch repair (MMR) system deficiency may contribute to the high frequency of TGFBR2 mutations.Citation19 In 70–90% of colorectal cancers with microsatellite instability (MSI),TGFBR2 is frameshift mutated at both alleles.Citation20 This mutation affect TGFBR2 protein activity and allow the cancer cells scape the growth suppressive effects of TGF-β.Citation10 Since the MSI cell line HCT116 harbors biallelic TGFBR2 frameshift mutations ,Citation21 it is not suitable for study of the regulation of TGFBR2. However, all MMR proficient HT29 stable cell lines did not show any frameshift mutations of TGFBR2.Citation10 Based on reported TGFBR2 activityCitation10 and our has-miR-1193 expression level in the sCRC cell lines and the microsatellite stability of HT-29 ,Citation11 finally, the HT-29 cells were selected to perform the gain and loss of function experiments. Hsa-miR-1193 has not been researched previously; thus, it is essential to explore its regulation of TGFBR2 and CRC cell function.
We demonstrated that hsa-miR-1193 negatively regulated TGFBR2 at both the transcriptional and translational level, and it promoted CRC cell growth. In addition, we determined that the presence of rs11466537-A in the miRNA target site disrupted hsa-miR-1193 regulation of TGFBR2 and ultimately weakened sCRC risk. Most human genome research has focused on identifying pathogenic mutations. However, a relatively unexplored but important area is the research of genetic factors that play important roles in maintaining a healthy body.Citation22 Many individuals with environmental risk factors remain well, such as obese smokers without cardiovascular disease. Therefore, protective genetic factors cannot be ignored in disease prediction and prevention. Accordingly, our results were finally tested in sCRC patients and non-cancer individuals, and there were 3 rs11466537-A carriers in the non-cancer control group but zero in sCRC group. The result is consistent with our in vitro studies. Thus, we assumed that the A allele of rs11466537 might be a protective marker for sCRC. rs11466537 was defined as a rare variant with the minor allele frequency (MAF) less than 0.05.Citation23 Under such circumstances, almost all phenotypes in the samples were homozygotes for the common allele. Very few individuals were minor allele carriers. Association testing with a single rare variant has limited power even in very large samples because only a small percentage of study subjects carry the mutation.Citation24 Association analyses could be done for a set of rare variants not for a single rare variant using a Combined Multivariate and Collapsing (CMC) method.Citation25 In this paper, only a SNP rs11466537 was found. With the discovery of more rare loci in TGFBR2, the clinical significance of rs11466537 may be defined in future.
The present study had some limitation. False negative results might appear through our prediction criteria. It is undeniable that the SNPs with an MFE change less than 3 kcal mol−1 may also influence miRNA targeting, and functional experimental validation for those SNPs was necessary in further studies.
Conclusions
Our results demonstrated that hsa-miR-1193 may be involved in sCRC tumourigenesis at least in part by the suppression of TGFBR2, and the A allele of rs11466537 disturbed the regulation of hsa-miR-1193 on TGFBR2. Therefore, hsa-miR-1193 represents a potential candidate for miRNA-based therapy against CRC.
Materials and methods
Selection of SNPs in the miRNA target site of sCRC-related genes
We (1) screened all SNPs with a reported minor allele (1–10%) in HapMap, (2) identified all mature miRNAs with seed regions (nucleotides 2–7 or 8) containing the candidate SNPs, and (3) identified all seed sites within the candidate genes' 3′-UTRs. We choose 2 databases OMIM and Ensembl to search the related genes. 1016 records were shown using OMIM (http://www.ncbi.nlm.nih.gov/Omim/) when searching colon cancer genes with known sequences before February 2017. 547 colon cancer-related genes were generated in ensembl (http://asia.ensembl.org/index.html). 87 colon cancer genes were found in both OMIM and Ensembl. Then we carefully reviewed all the articles of the 87 genes through PubMed database based on one of the following criteriaCitation26: (1) author provided evidence of gene expression or variants frequency differences in case control studies or survival analyses. (2) author provided evidence of the relationship between the gene and colon cancer cell proliferation or metastatic behavior in vitro or in vivo. The frequencies of SNPs in the 3′-UTRs of genes were obtained from the HapMap database. The sequence of a certain mature miRNA was obtained from miRBase. The RegRNA integrated web server is capable of predicting functional RNA motifs (http://regrna2.mbc.nctu.edu.tw). When the SNP locus is in the ‘seed’ region of a miRNA, the stability of the mRNA-miRNA interaction may be altered by this polymorphism.Citation27 RNAhybrid (http://bibiserv.techfak.uni-bielefeld.de/rnahybrid) predicts the secondary structure and minimum free energy (MFE) of the entire microRNA:mRNA duplex. When the change in MFE was higher than 3 kcal mol−1, we determined that miRNA targeting might be modified by this SNP.
Cell lines
Hela, LoVo, HCT116, SW480, HT-29 cells were obtained from ATCC (Rockville, MD). All cells were recovered and confirmed by morphological characteristics and tested for various genetic markers in one month. Hela, SW480, HT-29 and HCT116 cells were cultured in Dulbecco's modified Eagle's medium (DMEM) (Hyclone, USA), while LoVo cells in RPMI 1640 Medium Modified, supplemented with10% fetal bovine serum (Gibco, UK) at 37°C in 5% CO2, respectively.
Dual-luciferase reporter assay
The dual-luciferase reporter system enabled simultaneous monitoring of the correlation between miRNA and polymorphism in the miRNA target site within cells. The flanking sequences containing the SNP alleles were amplified by polymerase chain reaction (PCR) and cloned into the pmiRGLO Dual-Luciferase miRNA Target Expression Vector (Promega, USA). All primers specific to the DNA sequences were enumerated in Table S1. Restriction site insertion was necessary for ligation of the pmiR Vector. Enzymatic digestion was performed using NheI and SalI for rs11466537 and XbaI and DraI for rs746978. Mutant primers were designed to introduce mutations into the DNA fragments through amplifying the plasmid template (KOD -Plus- Mutagenesis Kit, Japanese). In the reporter assay, Hela cells were seeded on 24-well plates and incubated overnight. A total of 2 × 10⁵ cells were transfected with 1 μg of pmiR-SNP-wt or pmiR-SNP-mut and 100 nM hsa-miR-1193 mimics or negative control mimics (mimics-NC) using Lipofectamine® 2000 (Invitrogen, USA). After transfection for 24 h, luciferase activity was determined using the Dual-Glo® Luciferase Assay (Promega, USA) according to the manufacturer's instructions. All tests were repeated in triplicate.
Quantitative real-time PCR and western blotting
To analyze the expression of hsa-miR-1193 in CRC cell lines, LoVo, HCT116, SW480, HT-29 human colon cancer cells were cultured and harvested at 70% density for RNA purification. 2 μg of RNA (100 ng microRNA) was used to synthesize microRNA cDNA with the First Strand microRNA cDNA Synthesis Kit (Sangon, China). SYBR Premix Ex Taq™ II kit (TAKARA, Japan) was used to perform Quantitative real-time PCR (qPCR) on the CFX96 Touch Real-Time PCR Detection System (Bio-Rad, USA). PCR reactions were performed in a total volume of 25 μl. The amplification conditions were 95 °C, 5 min for initial denaturation, 40 cycles of 95 °C, 5 s and 60 °C, 30 s, with a melt curve reaction of 60 °C to 95 °C. We calculated the transcript levels by normalization to U6. The special sequences of hsa-miR-1193 were amplified with the forward primer 5′- TCGCTAGGGATGGTAGACCG- 3′ and the universal reverse primer in microRNA cDNA Synthesis Kit. The hsa-miR-1193 levels of cancer cell lines were determined using the formulas 2−ΔCt.
The HT-29 cell line was selected to perform the gain and loss of function experiments. HT-29 cells at 50% density were transfected with 100 nM miRNA mimics or inhibitors, respectively, using 10 μl of Lipofectamine® 2000 transfection agent per well of a 6-well plate. Cells were harvested 72 h after transfection for western blot and at 48 h for RNA purification. 1 μg of RNA was used to synthesize cDNA with the PrimeScript™ RT Reagent Kit with gDNA Eraser (Takara, Japan). TGFBR2 specific mRNA was amplified with the primers listed in Table S2. We calculated TGFBR2 transcript levels by normalization to GAPDH. For western blot analysis, the cells were washed with 1 × PBS and lysed in RIPA buffer with 1 × Protease Inhibitor Cocktail (Roche Applied Science). 20 mg of total protein was loaded per lane. Anti-TGFBR2 (L21, SC-400, 1:500 dilution; Scbt), anti-GAPDH (#2118, 1:2000), and anti-rabbit (#7054, 1:5000) antibodies were used.
Cell proliferation assay
The specific miRNA mimics, inhibitors, and negative controls (100 nM) were transfected using 2 μl of Lipofectamine® 2000 transfection agent per well in a 24-well plate. At 48 h after transfection, cells were seeded at 3 × 10³ cells per well on 96-well plates and then incubated overnight. A 10 μl quantity of Cell Counting Kit-8 solution (CK04–500, Dojindo) was added to the corresponding test wells and incubated for 4 h. The absorbance was measured at a wavelength of 450 nm at 12, 36, 60 and 84 h. All experiments were performed in triplicate.
Evaluation of the relationship between SNP genotypes and sCRC
Normal colon tissue samples of patients diagnosed with sCRC were collected at the Tangdu Hospital of the Fourth Military Medical University from 2012 through 2014. Normal colon tissue was cut 5 cm from the tumor and these served as the normal formalin-fixed paraffin-embedded tissues from the biopsy samples of 150 sCRC patients. The age of the patients ranged from 50 to 80 years, with an average age of 60 y. According to the geographic locations and age-sex composition of the patient population, 200 blood samples were obtained from control individuals at the medical center of the Shaanxi Provincial People's Hospital from 2012 through 2014. The individuals in the control group had no history of any prior cancer before and during the study period. Moreover, none obtained tumor-related treatment. All the participants were fully informed and gave a verbal consent. All procedures performed in studies involving human participants were in accordance with the ethical standards of the institutional and/or national research committee and with the 1964 Helsinki declaration and its later amendments or comparable ethical standards.
DNA was isolated from the blood of the controls and the formalin-fixed paraffin-embedded colon tissue of the patients using the DNeasy Blood and Tissue kit (Qiagen). Segments of the SNP flanking sequences were amplified using Taq DNA polymerase and DNA primers specific to this sequence (Supplementary ). PCR products were purified using PAGE and sequenced to genotype the SNP alleles of these subjects. Sequence data were imported to Sequencher® version 5.4 (Gene Codes, USA) for alignment, and the SNP genotypes were determined by 2 independent individuals. The frequencies of the allele carriers were calculated in both case and control groups.
Statistical analysis
All statistical analyses were performed by SPSS 16.0 (SPSS Inc., USA). A t-test was used to calculate significance between 2 groups for continuous variables. Experimental data were presented as the mean value ± the standard deviation (SD). Statistical significance was accepted at a value of P < 0.05.
Disclosure of potential conflicts of interest
No potential conflicts of interest were disclosed.
Supplemental_Materials.docx
Download MS Word (59.7 KB)Acknowledgments
We thank Prof. Jingjing Jiang for expert assistance in the cell function experiments. The authors also thank Prof. Wei Zhang for providing the normal colon tissue samples from sCRC patients.
Funding
This work was supported by the National Natural Science Foundation of China (81272707).
References
- Cheah PY. Recent advances in colorectal cancer genetics and diagnostics. Crit Rev Oncol/Hematol 2009; 69:45-55; PMID:18774731; https://doi.org/10.1016/j.critrevonc.2008.08.001
- Rex DK, Johnson DA, Anderson JC, Schoenfeld PS, Burke CA and Inadomi JM. American College of Gastroenterology guidelines for colorectal cancer screening 2009 [corrected]. Am J Gastroenterol 2009; 104:739-50; PMID:19240699; https://doi.org/10.1038/ajg.2009.104
- Berg M, Søreide K. Genetic and epigenetic traits as biomarkers in colorectal cancer. Int J Mol Sci 2011; 12:9426-39; PMID:22272141; https://doi.org/10.3390/ijms12129426
- Stigliano V, Sanchez-Mete L, Martayan A, Anti M. Early-onset colorectal cancer: A sporadic or inherited disease? World J Gastroenterol: WJG 2014; 20:12420; PMID:25253942; https://doi.org/10.3748/wjg.v20.i35.12420
- Chin LJ, Ratner E, Leng S, Zhai R, Nallur S, Babar I, Muller R-U, Straka E, Su L, Burki EA. A SNP in a let-7 microRNA complementary site in the KRAS 3′ untranslated region increases non–small cell lung cancer risk. Cancer Res 2008; 68:8535-40; PMID:18922928; https://doi.org/10.1158/0008-5472.CAN-08-2129
- Moriyama T, Ohuchida K, Mizumoto K, Yu J, Sato N, Nabae T, Takahata S, Toma H, Nagai E, Tanaka M. MicroRNA-21 modulates biological functions of pancreatic cancer cells including their proliferation, invasion, and chemoresistance. Mol Cancer Ther 2009; 8:1067-74; PMID:19435867; https://doi.org/10.1158/1535-7163.MCT-08-0592
- Wu W, Yang J, Feng X, Wang H, Ye S, Yang P, Tan W, Wei G, Zhou Y. MicroRNA-32 (miR-32) regulates phosphatase and tensin homologue (PTEN) expression and promotes growth, migration, and invasion in colorectal carcinoma cells. Mol Cancer 2013; 12:30; PMID:23617834; https://doi.org/10.1186/1476-4598-12-30
- Sætrom P, Biesinger J, Li SM, Smith D, Thomas LF, Majzoub K, Rivas GE, Alluin J, Rossi JJ, Krontiris TG. A risk variant in an miR-125b binding site in BMPR1B is associated with breast cancer pathogenesis. Cancer Res 2009; 69:7459-65; PMID:19738052; https://doi.org/10.1158/0008-5472.CAN-09-1201
- Song S, Chen D, Lu J, Liao J, Luo Y, Yang Z, Fu X, Fan X, Wei Y, Yang L. NFkappaB1 and NFkappaBIA polymorphisms are associated with increased risk for sporadic colorectal cancer in a southern Chinese population. PloS one 2011; 6:e21726; PMID:21738780; https://doi.org/10.1371/journal.pone.0021726
- Chung H, Young DJ, Lopez CG, Le TA, Lee JK, Ream-Robinson D, Huang SC, Carethers JM. Mutation rates of TGFBR2 and ACVR2 coding microsatellites in human cells with defective DNA mismatch repair. PLoS One 2008; 3:21; PMID:18941508; https://doi.org/10.1371/annotation/2548989f-1f13-4ea5-8af8-62420b0a590e
- Vilar E, Mukherjee B, Kuick R, Raskin L, Misek D E, Taylor J M, Giordano TJ, Hanash SM, Fearon ER, Rennert G, et al. Gene expression patterns in mismatch repair-deficient colorectal cancers highlight the potential therapeutic role of inhibitors of the phosphatidylinositol 3-kinase-AKT-mammalian target of rapamycin pathway. Clin Cancer Res 2009; 15:2829-39; PMID:19351759; https://doi.org/10.1158/1078-0432.CCR-08-2432
- Li J, Liang H, Bai M, Ning T, Wang C, Fan Q, Wang Y, Fu Z, Wang N, Liu R. MiR-135b promotes cancer progression by targeting transforming growth factor beta receptor II (TGFBR2) in colorectal cancer. PloS one 2015; 10:e0130194; PMID:26061281; https://doi.org/10.1371/journal.pone.0130194
- Bartel DP. MicroRNAs: target recognition and regulatory functions. Cell 2009; 136:215-33; PMID:19167326; https://doi.org/10.1016/j.cell.2009.01.002
- Migliore C, Petrelli A, Ghiso E, Corso S, Capparuccia L, Eramo A, Comoglio PM, Giordano S. MicroRNAs impair MET-mediated invasive growth. Cancer Res 2008; 68:10128-36; PMID:19074879; https://doi.org/10.1158/0008-5472.CAN-08-2148
- Yue D, Liu H, Huang Y. Survey of computational algorithms for MicroRNA target prediction. Curr Genomics 2009; 10:478; PMID:20436875; https://doi.org/10.2174/138920209789208219
- Koparde P, Singh S. Prediction of micro RNAs against H5N1 and H1N1 NS1 protein: a window to Sequence Specific Therapeutic Development. Journal of Data Mining in Genomics & Proteomics 2010; 1:2-8; https://doi.org/10.4172/2153-0602.1000104
- Derynck R, Akhurst RJ, Balmain A. TGF-β signaling in tumor suppression and cancer progression. Nature Genet 2001; 29:117-29; PMID:11586292; https://doi.org/10.1038/ng1001-117
- Gryfe R, Bapat B, Gallinger S, Swallow C, Redston M, Couture J. Molecular biology of colorectal cancer. Curr Probl Cancer 1997; 21:233-99; PMID:9438104; https://doi.org/10.1016/S0147-0272(97)80003-7
- Biswas S, Trobridge P, Romero-Gallo J, Billheimer D, Myeroff LL, Willson JK, Markowitz SD, Grady WM. Mutational inactivation of TGFBR2 in microsatellite unstable colon cancer arises from the cooperation of genomic instability and the clonal outgrowth of transforming growth factor beta resistant cells. Genes Chromosomes Cancer 2008; 47:95-106; PMID:17985359; https://doi.org/10.1002/gcc.20511
- Parsons R, Myeroff LL, Liu B, Willson JK, Markowitz SD, Kinzler KW, Vogelstein B. Microsatellite instability and mutations of the transforming growth factor beta type II receptor gene in colorectal cancer. Cancer Res 1995; 55:5548-50; PMID:7585632
- Lee J, Warnken U, Schnolzer M, Gebert J, Kopitz J. A new method for detection of tumor driver-dependent changes of protein sialylation in a colon cancer cell line reveals nectin-3 as TGFBR2 target. Protein Sci 2015; 24:1686-94; PMID:26177744; https://doi.org/10.1002/pro.2741
- Collins FS, Green ED, Guttmacher AE, Guyer MS. A vision for the future of genomics research. Nature 2003; 422:835-47; PMID:12695777; https://doi.org/10.1038/nature01626
- Choudhury A, Hazelhurst S, Meintjes A, Achinike-Oduaran O, Aron S, Gamieldien J, Jalali Sefid Dashti M, Mulder N, Tiffin N, Ramsay M. Population-specific common SNPs reflect demographic histories and highlight regions of genomic plasticity with functional relevance. BMC Genomics 2014; 15:1471-2164; PMID:24906912; https://doi.org/10.1186/1471-2164-15-437
- Bansal V, Libiger O, Torkamani A, Schork NJ. Statistical analysis strategies for association studies involving rare variants. Nat Rev Genet 2010; 11:773-85; PMID:20940738; https://doi.org/10.1038/nrg2867
- Li B, Leal SM. Methods for detecting associations with rare variants for common diseases: application to analysis of sequence data. Am J Hum Genet 2008; 83:311-21; PMID:18691683; https://doi.org/10.1016/j.ajhg.2008.06.024
- Mei Y, Yang JP, Qian CN. For robust big data analyses: a collection of 150 important pro-metastatic genes. Chin J Cancer 2017; 36:016-0178; PMID:28109319; https://doi.org/10.1186/s40880-016-0178-z
- Ahluwalia JK, Hariharan M, Bargaje R, Pillai B, Brahmachari V. Incomplete penetrance and variable expressivity: is there a microRNA connection? Bioessays 2009; 31:981-92; PMID:19642110; https://doi.org/10.1002/bies.200900066

