ABSTRACT
Although the FDA-approved receptor tyrosine kinases inhibitors, vandetanib and cabozantinib, are used to treat surgically inoperable progressive medullary thyroid carcinoma (MTC), not all patients are responsive while the disease sometimes progresses after an initial response. To better understand MTC drug resistance at molecular and biochemical levels, we have generated drug-resistant subpopulations of the human MTC cell lines, TT and MZ-CRC-1, via prolonged exposure to vandetanib and cabozantinib. These drug-resistant progenies exhibited substantial cross-resistance to vandetanib and cabozantinib, suggesting that these inhibitors may invoke an overlapping resistance mechanism(s) in MTC cells. Of note, vandetanib and cabozantinib increased mitochondrial membrane potential (Δψm) in drug-naïve as well as drug-resistant cells but only drug-naïve cells exhibited substantially altered oxygen consumption and extracellular acidification rates. Therefore, these inhibitors appear to cause a bioenergetics stress to which drug-resistant MTC cells are more tolerant. Given the ability of vandetanib and cabozantinib to increase Δψm, we hypothesized that these inhibitors can augment growth inhibitory effects of mitochondria-targeted carboxy-proxyl and ubiquinone by increasing their Δψm–dependent uptake/retention in MTC cells. Indeed, our in vitro and mouse xenograft data strongly support this possibility.
Abbreviations
| Δψm | = | mitochondrial membrane potential |
| CI | = | combination index |
| ECAR | = | extracellular acidification rates |
| FCCP | = | carbonyl cyanide 4-(trifluoromethoxy)phenylhydrazone |
| GAPDH | = | glyceraldehyde-3-phosphate dehydrogenase |
| MTC | = | medullary thyroid carcinoma |
| Mito-CP | = | triphenyl-phosphonium-carboxy-proxyl |
| Mito-Q | = | [10-(4,5-dimethoxy-2-methyl-3,6-dioxo-1,4-cyclohexadien-1-yl) decyl] triphenyl phosphonium |
| OCR | = | oxygen consumption rates |
| PARP | = | poly(ADP-ribose) polymerase |
| RET | = | Rearranged during Transfection |
| RTK | = | receptor tyrosine kinase |
| TMRE | = | tetramethyl-rhodamine ethyl ester perchlorate |
| TPP | = | triphenyl-phosphonium |
Introduction
MTC is an endocrine neoplasm that occurs sporadically or in hereditary forms from parafollicular C-cells of the thyroid gland.Citation1 MTC is relatively rare, progresses slowly, and can often be effectively treated by surgery. Nevertheless, surgically inoperable progressive metastatic MTC can be fatal, requiring an advanced therapy. MTC tumorigenesis is mainly driven by oncogenic mutations of the receptor tyrosine kinase (RTK), Rearranged during Transfection (RET), although other alterations may also be involved.Citation2-4 Accordingly, current molecular therapy substantially depends upon vandetanib (trade name Caprelsa, AstraZeneca) and cabozantinib (Exelixis), which inhibit RET and several other RTKs.Citation5,6 Nevertheless, not all patients respond to these inhibitors while there are patients that exhibit disease progression after an initial response.Citation7-9 Currently, our understanding at molecular/biochemical levels of MTC cell resistance to vandetanib and cabozantinib is very limited while additional therapeutic strategies are required.
Growing evidence supports the significance of mitochondrial metabolism for cancer cell proliferation and survival. For example, many tumor cells reprogram the Krebs/TCA cycle and mitochondrial oxidative phosphorylation to produce more building blocks and energy required for uncontrolled proliferation.Citation10 Moreover, tumor cells can adapt to cancer drugs by readjusting their mitochondrial metabolism and cell death/survival machinery.Citation11,12 However, metabolic reprogramming can also increase the production of toxic byproducts, e.g., reactive oxygen species, threatening tumor cell survival.Citation12-14 This vulnerability may provide a target for tumor suppression. Indeed, we previously demonstrated that perturbing mitochondrial bioenergetics and redox balance using the mitochondria-targeted superoxide dismutase mimetic, Mito-CP (triphenyl-phosphonium-carboxy-proxyl), or by targeting a key mitochondrial chaperone such as HSPA9 (GRP75/mortalin) can effectively suppress human MTC cells in culture and in mouse xenografts.Citation15-17 These observations strongly suggested the significance of mitochondria for MTC cell survival and proliferation, leading us to further evaluate the potential of mitochondria as a target for MTC therapy.
In this study, we have derived drug-resistant subpopulations of the human MTC cell lines, TT and MZ-CRC-1, by prolonged exposure to vandetanib and cabozantinib in vitro. Intriguingly, these subpopulations exhibited cross-resistance to these inhibitors. Of note, vandetanib and cabozantinib significantly increased mitochondrial membrane potential (Δψm) in drug-naïve and drug-resistant MTC cells but only drug-naïve cells exhibited substantially altered oxygen consumption and extracellular acidification rates, which suggests that these inhibitors may cause a bioenergetics stress to which drug-resistant MTC cells are more tolerant. Because Δψm drives mitochondrial accumulation of triphenyl-phosphonium (TPP) conjugates,Citation18 we hypothesized that vandetanib and cabozantinib can increase cellular uptake/retention of Mito-CP and, thereby, the combination of these agents can effectively suppress drug-naïve as well as drug-resistant MTC cells. We test this possibility using in vitro cultures and mouse xenografts.
Materials and methods
Cell culture and reagents
TT and MZ-CRC-1 were maintained as described previously.Citation19-21 Briefly, TT was maintained in RPMI 1640 (Invitrogen, Carlsbad, CA) supplemented with 16% fetal bovine serum, 100 units of penicillin and 100 μg of streptomycin per ml. MZ-CRC-1 was maintained in high-glucose DMEM (Invitrogen) supplemented with 10% fetal bovine serum in culture dishes coated with rat collagen (Sigma, St. Louis, MO). Drug-resistant progenies were generated as described in Results and were frozen-stock immediately after acquisition. Cell lines within 10 passages after acquisition were used for experiments in this study and were authenticated by short tandem repeat DNA profiling (Table S1). Cells were seeded at 105 cells/ml for the extracellular flux assay and at 2 × 10⁵ cells/ml for all other experiments.
Mito-CPCitation22 and Mito-Q ([10-(4,5-dimethoxy-2-methyl-3,6-dioxo-1,4-cyclohexadien-1-yl) decyl] triphenyl phosphonium) were obtained from Balaraman Kalyanaraman (Medical College of Wisconsin). Cremophore-EL was purchased from Sigma. Vandetanib and cabozantinib were purchased from LC Laboratories (Woburn, MA) and Selleckchem (Houston, TX), respectively.
Determination of cell viability and cell cycle
After drug treatment, cells were incubated with culture medium containing 3-(4,5-dimethyl-2-thiazolyl)-2,5-diphenyltetrazolium bromide (MTT, Sigma) at 0.5 mg/ml in 24 well-plates for 2 hours at 37°C, switched into 400 μl of dimethyl-sulfoxide (DMSO), and shaken for 5 min at room temperature before measuring absorbance at 540 nm, as described previously.Citation23 Cell viability was also determined by crystal violet staining and trypan blue exclusion analysis. Cell cycle analysis was conducted using propidium iodide and data were analyzed using FCS Express software (De Novo Software), as described previously.Citation15
Detection of Δψm using tetramethyl-rhodamine ethyl ester perchlorate (TMRE)
Cells were incubated with culture medium containing TMRE (10 ng/ml, Sigma) in 6-well plates for 15 min at 37°C in dark, collected by trypsinization, resuspended in phosphate-buffered saline containing 0.1% bovine serum albumin, and analyzed by flow cytometry (PE channel, 575 nm), as described previously.Citation15 Data from 20,000 cells were analyzed using FCS Express software (De Novo Software).
Extracellular flux assay
Oxygen consumption rates (OCR) and extracellular acidification rates (ECAR) were determined in cells seeded in specialized V3 Seahorse tissue culture plates using a XF96 Extracellular Flux Analyzer (Seahorse Bioscience), as described previously.Citation24 Briefly, 5 baseline OCR measurement were taken before injecting oligomycin (1 µg/ml), carbonyl cyanide 4-(trifluoromethoxy)phenylhydrazone (FCCP, 2 µmol/l), and antimycin A (10 µmol/l). Each treatment was measured 3 times. Protein concentrations were then determined by Bradford assay (Bio-Rad) for data normalization.
Immunoblot analysis
Immunoblotting was performed as described previously.Citation23 Mitochondrial lysates were prepared using the Mitochondria Isolation Kit (Thermo Scientific, Rockford, IL) according to the manufacturer's protocol. Antibodies were diluted as follows: ERK1/2, 1:2,500; glyceraldehyde-3-phosphate dehydrogenase (GAPDH), 1:5,000; poly(ADP-ribose) polymerase (PARP), 1:1,000; cleaved PARP (Asp214), 1:1,000; cleaved lamin A, 1:2,000; cytochrome c oxidase subunit IV, 1:2000 (Cell Signaling); phospho-ERK1/2 (Thr202/Tyr204), 1:2,500; RET, 1:1,000; phospho-RET (Tyr1062), 1:1,000; tubulin, 1:5,000 (Santa Cruz Biotechnology); E2F-1, 1:1,000 (NeoMarkers). The TPP-specific antibody was obtained from Dr. Michael Murphy (MRC Dunn Human Nutrition Unit) and used at a 1:1000 dilution ratio. Images of immunoblots were taken and processed using ChemiDoc XRS+ and Image Lab 3.0 (Bio-Rad).
Tumor xenograft studies
One × 107 TT cells in 200 µl Hank's balanced salt solution were inoculated subcutaneously into the rear flanks of 6-week-old female athymic nude (nu/nu) mice (Charles River Laboratories). Once palpable, tumors were measured using Vernier calipers at intervals indicated in the text. Tumor volumes were calculated using the formula: length x widthCitation2 x 0.5236. When tumor volumes reached 100 mm3, mice were sorted into 4 groups of 4 animals to achieve equal distribution of tumor size in all treatment groups. Drug treatment cycles and dose information are described in the figure legend. At the end of the experiments, animals were killed by CO2 asphyxiation. All animal studies were performed according to the protocols approved by the Institutional Animal Care and Use Committee at Medical College of Wisconsin.
Data analysis
Two-tailed unpaired Student's t-test was used for statistical analysis of 2 data sets. Tumor xenograft data were analyzed by One-Way ANOVA with Bonferroni correction for multiple comparisons. P value < 0.05 was considered statistically significant. The combination index (CI) isobologramCitation25 was determined using CompuSyn software (ComboSyn, Inc.). CI values <1, = 1, and >1 indicate synergy, additivity, and antagonism, respectively.
Results
Drug-resistant MTC cells exhibit cross-resistance to vandetanib and cabozantinib
We derived vandetanib- and cabozantinib-resistant subpopulations of TT and MZ-CRC-1 via prolonged in vitro cultures supplemented with gradually increasing drug doses. TT and MZ-CRC-1 are the human MTC lines that have well characterized responses to different tyrosine kinase inhibitor treatments.Citation26-28
Briefly, drug-naïve TT and MZ-CRC-1 cells were initially subject to IC10 doses of vandetanib or cabozantinib, i.e., 0.25 µM for TT and 0.05 µM for MZ-CRC-1. When cultures became confluent under these conditions, cells were passaged at lower densities with 2-fold increased drug doses. We repeated this procedure over 10 weeks and obtained TT and MZ-CRC-1 subpopulations that exhibit significantly increased IC50 to the drugs, as determined by MTT assay () and crystal violet staining (Fig. S1 and 2). Although slow, vandetanib-resistant TT subpopulation (TT/rV) and cabozantinib-resistant TT subpopulation (TT/rC) could propagate in the presence of 1 µM inhibitors while vandetanib-resistant MZ-CRC-1 subpopulation (MZ/rV) and cabozantinib-resistant MZ-CRC-1 subpopulation (MZ/rC) could propagate in the presence of 0.5 µM inhibitors (). Intriguingly, these subpopulations exhibited substantial cross-resistance to vandetanib and cabozantinib ( and ), suggesting that these inhibitors may invoke an overlapping resistance mechanism(s). We confirmed these viability data by cell cycle analysis. As determined after 4 day drug treatment, all these drug-resistant cells exhibited more S-phase population in cultures relative to their parental cells (). Moreover, TT/rV and TT/rC cells exhibited less sub-G1 population, an indication of cell death, than their parental TT cells ( and Fig. S3). Of note, 2-month incubation in drug-free media did not reverse the drug resistance of these cells, suggesting that they have stable drug resistance (data not shown).
Figure 1. TT and MZ-CRC-1 cells can develop resistance to vandetanib and cabozantinib. Progenies of TT and MZ-CRC-1 resistant to vandetanib (TT/rV and MZ/rV, respectively) or to cabozantinib (TT/rC and MZ/rC, respectively) were generated by prolonged cell culture in the presence of those drugs, as described in the text. (A) Parental and drug-resistant TT and MZ-CRC-1 cells in 12 well plates were treated with increasing doses of vandetanib (Vand) and cabozantinib (Cabo) for 48 hours. Cells were then allowed to recover in drug-free fresh culture medium for 48 hours before measuring viability by MTT assay. Data (mean ± SD, n = 4) are expressed as the percentage of untreated controls. (B) Parental and drug-resistant cells were incubated in the culture media containing 1 µM vandetanib or cabozantinib. Cell viability was determined by MTT assay at days 5 and 10. Data (mean ± SD, n = 4) are expressed as fold changes relative to the initial cell cultures. (C) Cells treated as in (B) were subject to cell cycle analysis using propidium iodide at drug treatment day 4. Data (mean ± SD, n = 3) are expressed as the percentage of untreated controls. Cell cycle histograms are shown in Fig. S3. (D) Western blot analysis of total lysates of cells treated with increasing doses of vandetanib or cabozantinib for 3 d. GAPDH is a loading control.
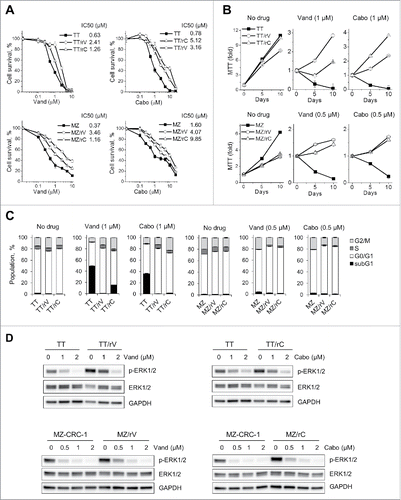
Characterization of these drug-resistant subpopulations did not reveal any notable difference compared with original TT and MZ-CRC-1 cell profiles, as determined by short tandem repeat DNA fingerprints (Table S1), Sanger sequencing of entire codons of RET cDNA (data not shown), PCR analysis of RET splicing variants expression (Fig. S4A), Western blot analysis of RET expression and autophosphorylation (Fig. S4B), and expression analyses of the neuroendocrine differentiation markers that characterize MTC, i.e., calcitonin, calcitonin gene-related peptide, achaete-scute family BHLH transcription factor 1, and chromogranin A (Fig. S4), although basal levels of ERK1/2 phosphorylation, a key readout for RTK activity,Citation29 were slightly upregulated in the drug-resistant subpopulations ().
Vandetanib and cabozantinib upregulate Δψm in parental and drug-resistant MTC cells
The cross-resistance observed above suggested that there may be an overlapping mechanism(s) underlying MTC cell resistance to vandetanib and cabozantinib. Because these inhibitors still substantially decreased ERK1/2 phosphorylation in drug-resistant subpopulations (), we suspected that the drug resistance may be attributed to a mechanism distal to RTK signaling. We asked whether mitochondria are involved because (i) mitochondrial activity can be regulated by RTKsCitation30 and (ii) mitochondria have a key role for MTC cell survival and proliferation.Citation15-17 We thus determined whether vandetanib and cabozantinib affected Δψm, an indicator of mitochondrial activity, in parental and the drug-resistant MTC cells using the Δψm-sensitive dye, TMRE.
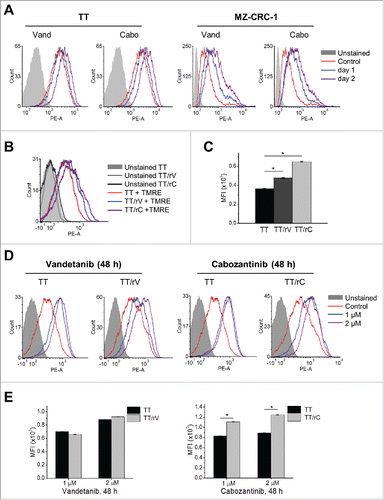
Indeed, TT and MZ-CRC-1 cells exhibited significantly increased TMRE retention upon 24–48 hour treatment with 1 µM vandetanib or cabozantinib, as determined by flow cytometry (). Of note, TT/rV and TT/rC cells, which were maintained in drug-free medium for 5 d and exhibited slightly higher basal TMRE retention than parental cells at that time-point ( and ), also exhibited increased TMRE retention when treated again by the inhibitors ( and ). These data suggest that vandetanib and cabozantinib can reversibly alter Δψm in MTC cells.
Figure 2. Vandetanib and cabozantinib alter mitochondrial membrane potential in TT and MZ-CRC-1 cells. (A) Parental TT and MZ-CRC-1 cells, treated with 1 μM of vandetanib (Vand) and cabozantinib (Cabo) for 1 or 2 days, were stained with TMRE. Cellular TMRE retention was analyzed by flow cytometry measuring red fluorescence (PE channel, 575 nm). (B) Flow cytometry to determine basal level TMRE staining in parental and drug-resistant TT cells incubated without drugs for 5 d. (C) Mean fluorescence intensities (MFI) of TMRE-stained cells in (B) quantified by FCS Express software. (D) Cells in (B) were then treated with 1 or 2 μM vandetanib or cabozantinib for 48 hours before TMRE staining. E, MFI in (D) were quantified by FCS Express software to compare the effect of drugs in parental and resistant cells. Data (mean ± SEM, n = number of gated events) are expressed as arbitrary units, *p < 0.0001, t-test.
Vandetanib and cabozantinib alter mitochondrial bioenergetics, to which drug-resistant MTC cells are refractory
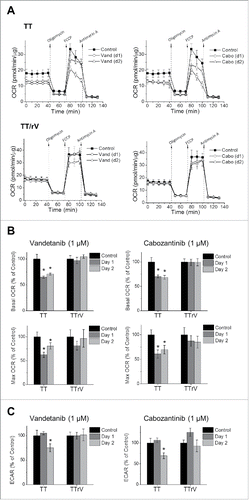
Next, we determined whether vandetanib and cabozantinib affect mitochondrial bioenergetics in MTC cells. For this, we measured oxygen consumption rates (OCR) in TT and TT/rV cells using different inhibitors of the electron transport chain to monitor multiple parameters of mitochondrial function, as we previously conducted.Citation15-17 Briefly, the ATPase inhibitor oligomycin allows measurement of ATP production-related OCR; the uncoupler FCCP yields maximal OCR; and the complex III inhibitor antimycin A blocks all mitochondrial respiration, allowing measurement of mitochondrial and non-mitochondrial components of oxygen consumption.
We found that parental TT, but not TT/rV, cells exhibited substantially reduced basal OCR in response to 1 µM vandetanib or cabozantinib ( and ). TT cells also exhibited substantially reduced maximal OCR in 24 hours, which was partially recovered in 48 hours. In contrast, TT/rV cells exhibited much less fluctuation of OCR ( and ). This indicates that vandetanib and cabozantinib can decrease mitochondrial respiratory capacity in TT cells but not as much in TT/rV cells. Moreover, under these conditions, parental TT cells exhibited substantially reduced extracellular acidification rates (ECAR) whereas TT/rV cells exhibited much less changes (), suggesting that glycolysis rates were more decreased in the parental cells than in TT/rV cells. Noteworthy is that TT/rV cells tolerated not only vandetanib but also cabozantinib in these tests, which further supports the notion that vandetanib and cabozantinib induce cross-resistance. These data suggest that vandetanib and cabozantinib may cause a stress that alters mitochondrial activity and bioenergetics in MTC cells and that drug-resistant MTC cells may have higher tolerance to this stress.
Figure 3. Drug-resistant TT and MZ-CRC-1 cells tolerate vandetanib- and cabozantinib-caused bioenergetics alteration better than their parental cells. Parental and vandetanib-resistant TT (TT/rV) cells were treated with 1 μM vandetanib (Vand) or cabozantinib (Cabo) for 1 and 2 d before the extracellular flux assay. (A) OCR in parental TT and TT/rV cells were determined as described in Material and Methods. (B) Basal and maximal OCR (percent changes to untreated) calculated from (A). (C) ECAR is expressed as percent changes to untreated. Data (mean ± SD, n = 10) are normalized to cellular protein levels, *p < 0.0001, t-test.
Vandetanib and cabozantinib pretreatments potentiate mitochondria-targeted drugs by increasing their mitochondrial uptake/retention in MTC cells
We have recently demonstrated that the mitochondria-targeted metabolic interfering agent, Mito-CP, can effectively suppress MTC cells in culture and in mouse xenografts.Citation15 Mito-CP accumulates in mitochondria due to its Δψm-sensitive TPP moiety.Citation13,31 Given the aforementioned data that vandetanib and cabozantinib increased Δψm in MTC cells, we hypothesized that these inhibitors can augment growth inhibitory effects of Mito-CP by increasing its uptake/retention in MTC cells.
To test this hypothesis, we first determined whether vandetanib or cabozantinib pretreatment could increase TPP-protein adduct formation in TT cells. It was previously demonstrated that TPP-conjugated compounds extensively label mitochondrial proteins in cells, producing stable TPP adducts that can be detected by an antibody specific to the TPP moiety.Citation32 When mitochondrial extracts of TT cells, treated with Mito-CP for 1 hour with or without the pretreatment, were analyzed by Western blotting, higher levels of TPP-protein adducts were detected in cells pretreated with vandetanib or cabozantinib (). Interestingly, the patterns of adduct formation detected on Western blots were very similar between the vandetanib- and cabozantinib-pretreated groups, suggesting that these 2 inhibitors may affect mitochondria in MTC cells via a similar mechanism(s). Of note, the levels of cytochrome c oxidase subunit IV were not affected under these conditions, excluding potential interference by disrupted mitochondrial integrity (). These data suggest that vandetanib and cabozantinib may accelerate cellular uptake of Mito-CP by increasing Δψm.
Figure 4. Vandetanib and cabozantinib potentiate cytotoxicity of mitochondria-targeted drugs in TT and MZ-CRC-1 cells. (A) TT cells, pretreated with 1 or 2 μM vandetanib or cabozantinib for 2 days, were treated with 2 μM Mito-CP for 1 hour. Mitochondrial lysates of these cells were analyzed by Western blotting to detect the formation of TPP adducts using an antibody specific to the TPP moiety of Mito-CP. Cytochrome c oxidase subunit IV (COX IV) is a loading control. (B and C), Parental TT (B) and MZ-CRC-1 (C) cells, pretreated with 1 μM vandetanib or cabozantinib for 2 days, were treated with 1 and 5 μM Mito-CP for 24 hours. Total cell lysates were analyzed by Western blotting for indicated proteins. (D and E), TT (D) and MZ-CRC-1 (E) cells in 24-well plates, pretreated with 1 μM vandetanib or cabozantinib for 2 days, were treated with increasing doses of Mito-CP and Mito-Q for 24 hours. Cells were then allowed to recover in drug-free medium for 48 hours before MTT assay. Data (mean ± SD, n = 4) are expressed as the percentage of the Mito-CP-untreated controls, *p < 0.0001, t-test. F, Chou-Talalay plot of the data in (D) and (E) to determine CI as a function of effect level (Fa).
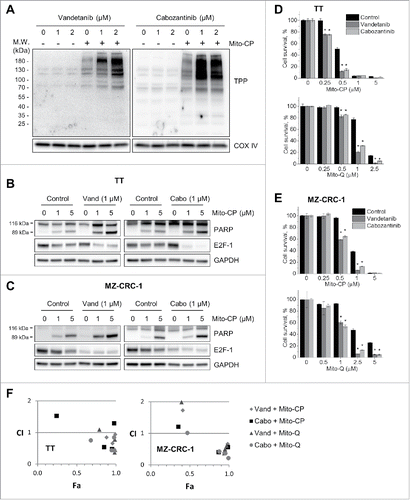
Next, Western blot analysis of total cell lysates revealed that 1 µM vandetanib and cabozantinib pretreatments highly increased the rates of Mito-CP-induced PARP cleavage and downregulation of the S-phase transcription factor E2F1 in TT and MZ-CRC-1 cells ( and ). Consistent with these data, vandetanib and cabozantinib pretreatments highly augmented Mito-CP-induced loss of viability in TT and MZ-CRC-1 cells, as determined by MTT assay ( and ), crystal violet staining (Fig. S5), and trypan blue exclusion assay (Fig. S6). These pretreatments substantially augmented (about 24–40%) the Mito-CP effects in TT (as seen in 0.25–0.5 μM range, ) and MZ-CRC-1 (0.5–1 μM, ) cells. Moreover, these pretreatments also augmented (about 16–56%) growth inhibitory effects of Mito-Q, a TPP-conjugated derivative of ubiquinone that can also disrupt mitochondrial metabolism and redox balance if over-enriched in cells,Citation18,33 in TT (0.5–2.5 μM, ) and MZ-CRC-1 (1–5 μM, ) cells. Of note, analysis of the CI isobologramCitation25 suggested that these strong growth inhibitory effects may be due to a synergy between pretreatments and TPP-conjugates (). These data demonstrate that vandetanib and cabozantinib can potentiate cytotoxicity of a mitochondria-targeted agent in MTC cells by increasing its mitochondrial uptake/retention.
Vandetanib and cabozantinib pretreatments also potentiate Mito-CP in drug-resistant MTC cells
Because vandetanib and cabozantinib also increased mitochondrial membrane potential in drug-resistant MTC cells, we determined whether vandetanib/cabozantinib pretreatments also potentiate Mito-CP in TT/rV and TT/rC cells.
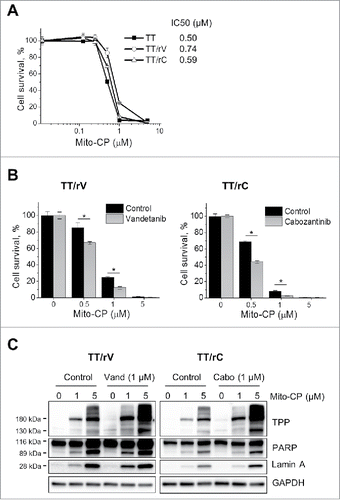
We found that TT/rV and TT/rC cells were similarly sensitive to Mito-CP as their parental cells, exhibiting IC50 at around 0.59–0.74 μM (). As seen in parental TT cells, 1 µM vandetanib or cabozantinib pretreatment sensitized these cells to Mito-CP, substantially augmenting (about 18–25%) the Mito-CP effects (0.5–1 μM, ). Moreover, Western blot analysis revealed that these pretreatments substantially accelerated protein-Mito-CP adduct formation, and the rates of Mito-CP-induced cleavage of PARP and lamin A in these cells (). These data suggest that Mito-CP can also effectively suppress drug-resistant MTC cells and that its growth inhibitory effects can be augmented if combined with vandetanib or cabozantinib.
Figure 5. Vandetanib and cabozantinib potentiate cytotoxicity of Mito-CP in drug-resistant TT cells. (A) Basal level Mito-CP sensitivity of drug-resistant TT cells maintained under drug-free culture conditions for 5 d. Cells in 24-well plates were then treated with increasing doses of Mito-CP for 48 hours and recovered in drug-free medium for 48 hours before MTT assay. Data (mean ± SD, n = 4) are expressed as the percentage of untreated controls. (B) TT/rV and TT/rC cells in (A) were pretreated with 1 μM vandetanib or cabozantinib for 48 hours and then were treated with increasing doses of Mito-CP for 24 hours, followed by 48 hour recovery in drug-free medium before MTT assay. Data (mean ± SD, n = 4) are expressed as the percentage of each respective untreated control, *p < 0.0001, t-test. (C) Total lysates of TT/rV and TT/rC cells harvested at 24 hour recovery time-point in (B) were analyzed by Western Blotting.
Vandetanib and Mito-CP combination effectively suppress TT xenografts in mice
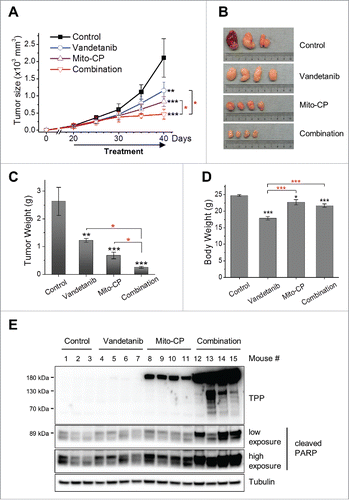
Lastly, we determined the effects of vandetanib and Mito-CP combination on TT xenografts in immune-compromised mice. Based upon previously established treatment schedule and effective drug doses,Citation15 we treated TT tumor-bearing animals in 4 cycles wherein vandetanib and Mito-CP were administered as monotherapy or as combination therapy.
Consistent with the in vitro data above, sequential administration of vandetanib and Mito-CP most effectively suppressed growth of TT xenografts when compared with the monotherapy groups ( to ). Of note, although the vandetanib monotherapy group exhibited significant loss of body weight, the combination therapy group did not significantly lose body weight (). Next, we determined by Western blotting whether cellular uptake/retention of Mito-CP was augmented in tumors extracted from the combination therapy group. Indeed, consistent with our in vitro data, the combination therapy group showed much higher levels of TPP-protein adduct formation on Western blots than the Mito-CP monotherapy group (). Moreover, PARP cleavage was also higher in the combination therapy group (). Together, these data suggest that combining vandetanib/cabozantinib with a mitochondria-targeted agent may have potential for MTC therapy.
Figure 6. Vandetanib potentiates Mito-CP in TT xenografts. Athymic mice bearing TT xenografts were treated with Mito-CP, vandetanib, and the combination of these compounds, respectively. Drugs dissolved in 200 μl vehicle (1:9 mixture of DMSO/Cremophore-EL) were orally administered by gavage every day for 4 d followed by 1 day break. Four cycles of this treatment were conducted. The control group received only the vehicle, the Mito-CP group received 80 mg drug/kg body weight/dose, the vandetanib group received 25 mg drug/kg body weight/dose, and the combination group received 2 doses of vandetanib followed by 2 doses of Mito-CP in a cycle. (A) Changes in tumor sizes were determined at the indicated time-points. (B) Images of tumors collected at the end of experiment. (C) Weights of tumors collected at the end of experiment. (D) Body weights of animals measured at the end of experiment. (E) Homogenates of tumor xenografts from each group were analyzed by Western blotting for Mito-CP adducts and cleaved PARP (detected by anti-PARP Asp214). Tubulin is a loading control. All data are mean ± SEM, (n = 4 per treatment group, n = 3 in vehicle group) *p < 0.05, **p < 0.01, ***p < 0.001 (black*, to control), One-Way ANOVA with Bonferroni correction for multiple comparisons.
Discussion
Resistance to a targeted cancer therapy is mainly attributed to the ability of tumor cells to develop drug resistance or to the selection of a pre-existing subpopulation of tumor cells with drug-resistance. Although it is currently unclear which of these possibilities underlies our generation of drug resistant progenies of TT and MZ-CRC-1 cells, our data address a potentially important aspect of MTC resistance to the FDA-approved drugs, vandetanib and cabozantinib.
Drug resistance can be invoked by multiple mechanisms, e.g., genetic/epigenetic alterations or activation of parallel independent compensatory mechanisms. Vandetanib and cabozantinib have different chemical structures and their targets are not entirely identical although largely overlapping. Whereas vandetanib inhibits RET, vascular endothelial growth factor receptor 2, and epidermal growth factor receptor, cabozantinib inhibits RET and vascular endothelial growth factor receptor 2, with greater affinity than vandetanib, and c-MET/hepatocyte growth factor receptor.Citation9 Intriguingly, drug-resistant TT and MZ-CRC-1 cells generated in this study exhibited substantial cross-resistance to these inhibitors without any notable alterations in RET sequences, splicing, or autophosphorylation. Therefore, their drug resistance may possibly be due to a mechanism(s) affecting RET downstream, other aforementioned RTKs, and/or their pathways. While this possibility warrants further investigation, our current data suggest that vandetanib and cabozantinib can affect mitochondrial activity and bioenergetics in MTC cells. Of note, certain RTKs are known to regulate mitochondrial activity,Citation30 and a recent study using a fly model reported that RET can facilitate mitochondrial respiration and integrity.Citation34 These findings are in agreement with our observed effects of vandetanib and cabozantinib. As such, it may be possible that inhibition of RET and/or other RTKs by these inhibitors suppresses mitochondrial energy metabolism in MTC cells, eventually deriving a selection pressure for the development of drug resistance.
Mitochondria are often dysregulated in cancer, and increased tumor cell dependency on mitochondria may provide an opportunity to design a novel therapeutic strategy.Citation12 We have recently demonstrated the potential of mitochondria as a therapeutic target for MTC.Citation15-17 The present study consistently supports this potential and provides a novel idea for an advanced therapeutic strategy. Briefly, tumor suppressive effects of TPP-conjugated metabolism interfering agents are attributed to their Δψm–dependent enrichment in mitochondria, and subsequent disruption of energy metabolism and redox balance in tumor cells.Citation13,31 While relatively high Δψm in tumor cells rationalizes the use of TPP as an effective vehicle for cancer drug delivery, our present study suggests that this strategy, if combined with vandetanib and cabozantinib, may become more effective for MTC therapy because these RTK inhibitors would augment Δψm–dependent uptake/retention of TPP-conjugated agents in MTC cells. Importantly, these inhibitors potentiated Mito-CP and Mito-Q not only in drug naïve but also in drug-resistant TT cells, suggesting that this combination may also have potential for drug-resistant MTC.
Using Mito-CP and Mito-Q in combination with RTK inhibitors may have additional benefits. Dose-limiting toxicity is a critical issue in MTC therapies using vandetanib and cabozantinib. In our animal experiments, vandetanib combination with Mito-CP was associated with less body weight loss than vandetanib monotherapy. While this may be due to the reduced frequency of vandetanib administration in the combination therapy group, it is noteworthy that Mito-CP and Mito-Q, although toxic to cancer cells, were originally designed as anti-oxidants protecting normal cells from oxidative stress.Citation22,35 Indeed, a study has demonstrated that Mito-Q can ameliorate cardiomyopathy caused by doxorubicin in a rat model without interfering with the tumor suppressive effects of doxorubicin, suggesting that Mito-Q may be used to overcome the dose-limiting cardiomyopathy caused by cancer drugs.Citation36 Given this potential, it will also be important to evaluate whether these agents can ameliorate some adverse effects of vandetanib and cabozantinib. In conclusion, our findings suggest that (i) MTC cells can develop cross-resistance to vandetanib and cabozantinib; (ii) vandetanib and cabozantinib affect mitochondrial activity in MTC cells; (iii) mitochondria are a key therapeutic target for MTC; and (iv) combination of vandetanib and cabozantinib with a mitochondria-targeted agent may have potential for MTC suppression.
Disclosure of potential conflicts of interest
No potential conflicts of interest were disclosed.
Supplementary_Materials.zip
Download Zip (14.4 MB)Acknowledgments
We thank Dr. Robert Gagel (MD Anderson) for MZ-CRC-1, Dr. Michael Murphy (Medical Research Council Dunn Human Nutrition Unit) for the TPP antibody, Drs. Balaraman Kalyanaraman and Joy Joseph (Medical College of Wisconsin) for Mito-compounds, and the MCW Cancer Center Bioenergetics shared resource and Advancing Healthier Wisconsin for Seahorse analysis.
Funding
This work was supported by American Cancer Society (RSGM-10–189–01-TBE) and National Cancer Institute (R01CA138441) to J.P.
References
- Tuttle RM, Ball DW, Byrd D, Daniels GH, Dilawari RA, Doherty GM, Duh QY, Ehya H, Farrar WB, Haddad RI, et al. Medullary carcinoma. J Natl Compr Canc Netw 2010; 8:512-30; PMID:20495082; https://doi.org/10.6004/jnccn.2010.0040
- Ichihara M, Murakumo Y, Takahashi M. RET and neuroendocrine tumors. Cancer Lett 2004; 204:197-211; PMID:15013219; https://doi.org/10.1016/S0304-3835(03)00456-7
- Agrawal N, Jiao Y, Sausen M, Leary R, Bettegowda C, Roberts NJ, Bhan S, Ho AS, Khan Z, Bishop J, et al. Exomic sequencing of medullary thyroid cancer reveals dominant and mutually exclusive oncogenic mutations in RET and RAS. J Clin Endocrinol Metab 2013; 98:E364-9; PMID:23264394; https://doi.org/10.1210/jc.2012-2703
- Ciampi R, Mian C, Fugazzola L, Cosci B, Romei C, Barollo S, Cirello V, Bottici V, Marconcini G, Rosa PM, et al. Evidence of a low prevalence of RAS mutations in a large medullary thyroid cancer series. Thyroid 2013; 23:50-7; PMID:23240926; https://doi.org/10.1089/thy.2012.0207
- Degrauwe N, Sosa JA, Roman S, Deshpande HA. Vandetanib for the treatment of metastatic medullary thyroid cancer. Clin Med Insights Oncol 2012; 6:243-52. PMID:22723734; https://doi.org/10.4137/CMO.S7999
- Nagilla M, Brown RL, Cohen EE. Cabozantinib for the treatment of advanced medullary thyroid cancer. Adv Ther 2012; 29:925-34; PMID:23104465; https://doi.org/10.1007/s12325-012-0060-6
- Wells SA Jr, Robinson BG, Gagel RF, Dralle H, Fagin JA, Santoro M, Baudin E, Elisei R, Jarzab B, Vasselli JR, et al. Vandetanib in patients with locally advanced or metastatic medullary thyroid cancer: a randomized, double-blind phase III trial. J Clin Oncol 2012; 30:134-41; PMID:22025146; https://doi.org/10.1200/JCO.2011.35.5040
- Elisei R, Schlumberger MJ, Muller SP, Schoffski P, Brose MS, Shah MH, Licitra L, Jarzab B, Medvedev V, Kreissl MC, et al. Cabozantinib in progressive medullary thyroid cancer. J Clin Oncol 2013; 31:3639-46; PMID:24002501; https://doi.org/10.1200/JCO.2012.48.4659
- Dadu R, Hu MN, Grubbs EG, Gagel RF. Use of tyrosine kinase inhibitors for treatment of medullary thyroid carcinoma. Recent Results Cancer Res 2015; 204:227-49; PMID:26494392; https://doi.org/10.1007/978-3-319-22542-5_11
- Ward PS, Thompson CB. Metabolic reprogramming: a cancer hallmark even warburg did not anticipate. Cancer Cell 2012; 21:297-308; PMID:22439925; https://doi.org/10.1016/j.ccr.2012.02.014
- Haq R, Fisher DE, Widlund HR. Molecular pathways: BRAF induces bioenergetic adaptation by attenuating oxidative phosphorylation. Clin Cancer Res 2014; 20:2257-63; PMID:24610826; https://doi.org/10.1158/1078-0432.CCR-13-0898
- Sarosiek KA, Ni Chonghaile T, Letai A. Mitochondria: gatekeepers of response to chemotherapy. Trends Cell Biol 2013; 23:612-9; PMID:24060597; https://doi.org/10.1016/j.tcb.2013.08.003
- Don AS, Hogg PJ. Mitochondria as cancer drug targets. Trends Mol Med 2004; 10:372-8; PMID:15310457; https://doi.org/10.1016/j.molmed.2004.06.005
- Sabharwal SS, Schumacker PT. Mitochondrial ROS in cancer: initiators, amplifiers or an Achilles' heel? Nat Rev Cancer 2014; 14:709-21; PMID:25342630; https://doi.org/10.1038/nrc3803
- Starenki D, Park JI. Mitochondria-targeted nitroxide, Mito-CP, suppresses medullary thyroid carcinoma cell survival in vitro and in vivo. J Clin Endocrinol Metab 2013; 98:1529-40; PMID:23509102; https://doi.org/10.1210/jc.2012-3671
- Starenki D, Hong SK, Lloyd RV, Park JI. Mortalin (GRP75/HSPA9) upregulation promotes survival and proliferation of medullary thyroid carcinoma cells. Oncogene 2015; 34:4624-34; PMID:25435367; https://doi.org/10.1038/onc.2014.392
- Starenki D, Park JI. Selective mitochondrial uptake of MKT-077 can suppress medullary thyroid carcinoma cell survival in vitro and in vivo. Endocrinol Metab (Seoul) 2015; 30(4):593-603; PMID:26485469; https://doi.org/10.3803/EnM.2015.30.4.593
- Murphy MP, Smith RA. Targeting antioxidants to mitochondria by conjugation to lipophilic cations. Annu Rev Pharmacol Toxicol 2007; 47:629-56; PMID:17014364; https://doi.org/10.1146/annurev.pharmtox.47.120505.105110
- Arthan D, Hong SK, Park JI. Leukemia inhibitory factor can mediate Ras/Raf/MEK/ERK-induced growth inhibitory signaling in medullary thyroid cancer cells. Cancer Lett 2010; 297:31-41; PMID:20570039; https://doi.org/10.1016/j.canlet.2010.04.021
- Park JI, Strock CJ, Ball DW, Nelkin BD. The Ras/Raf/MEK/extracellular signal-regulated kinase pathway induces autocrine-paracrine growth inhibition via the leukemia inhibitory factor/JAK/STAT pathway. Mol Cell Biol 2003; 23:543-54; PMID:12509453; https://doi.org/10.1128/MCB.23.2.543-554.2003
- Park JI, Strock CJ, Ball DW, Nelkin BD. Interleukin-1beta can mediate growth arrest and differentiation via the leukemia inhibitory factor/JAK/STAT pathway in medullary thyroid carcinoma cells. Cytokine 2005; 29:125-34; PMID:15613280; https://doi.org/10.1016/j.cyto.2004.10.005
- Dhanasekaran A, Kotamraju S, Karunakaran C, Kalivendi SV, Thomas S, Joseph J, Kalyanaraman B. Mitochondria superoxide dismutase mimetic inhibits peroxide-induced oxidative damage and apoptosis: role of mitochondrial superoxide. Free Radic Biol Med 2005; 39:567-83; PMID:16085176; https://doi.org/10.1016/j.freeradbiomed.2005.04.016
- Hong SK, Yoon S, Moelling C, Arthan D, Park JI. Noncatalytic function of ERK1/2 can promote Raf/MEK/ERK-mediated growth arrest signaling. J Biol Chem 2009; 284:33006-18; PMID:19805545; https://doi.org/10.1074/jbc.M109.012591
- Cheng G, Zielonka J, Dranka BP, McAllister D, Mackinnon AC Jr, Joseph J, Kalyanaraman B. Mitochondria-targeted drugs synergize with 2-deoxyglucose to trigger breast cancer cell death. Cancer Res 2012; 72:2634-44; PMID:22431711; https://doi.org/10.1158/0008-5472.CAN-11-3928
- Chou TC, Talalay P. Quantitative analysis of dose-effect relationships: the combined effects of multiple drugs or enzyme inhibitors. Adv Enzyme Regul 1984; 22:27-55; PMID:6382953; https://doi.org/10.1016/0065-2571(84)90007-4
- de Groot JW, Plaza Menacho I, Schepers H, Drenth-Diephuis LJ, Osinga J, Plukker JT, Links TP, Eggen BJ, Hofstra RM. Cellular effects of imatinib on medullary thyroid cancer cells harboring multiple endocrine neoplasia Type 2A and 2B associated RET mutations. Surgery 2006; 139:806-14; PMID:16782438; https://doi.org/10.1016/j.surg.2005.10.019
- Morisi R, Celano M, Tosi E, Schenone S, Navarra M, Ferretti E, Costante G, Durante C, Botta G, D'Agostino M, et al. Growth inhibition of medullary thyroid carcinoma cells by pyrazolo-pyrimidine derivates. J Endocrinol Invest 2007; 30:RC31-4; PMID:18075281; https://doi.org/10.1007/BF03349220
- Plaza-Menacho I, Mologni L, Sala E, Gambacorti-Passerini C, Magee AI, Links TP, Hofstra RM, Barford D, Isacke CM. Sorafenib functions to potently suppress RET tyrosine kinase activity by direct enzymatic inhibition and promoting RET lysosomal degradation independent of proteasomal targeting. J Biol Chem 2007; 282:29230-40; PMID:17664273; https://doi.org/10.1074/jbc.M703461200
- McCubrey JA, Steelman LS, Chappell WH, Abrams SL, Wong EW, Chang F, Lehmann B, Terrian DM, Milella M, Tafuri A, et al. Roles of the Raf/MEK/ERK pathway in cell growth, malignant transformation and drug resistance. Biochim Biophys Acta 2007; 1773:1263-84; PMID:17126425; https://doi.org/10.1016/j.bbamcr.2006.10.001
- Salvi M. Receptor tyrosine kinases take a direct route to mitochondria: an overview. Curr Protein Pept Sci 2013; 14:635-40; PMID:24106960; https://doi.org/10.2174/13892037113146660087
- Modica-Napolitano JS, Aprille JR. Delocalized lipophilic cations selectively target the mitochondria of carcinoma cells. Adv Drug Deliv Rev 2001; 49:63-70; PMID:11377803; https://doi.org/10.1016/S0169-409X(01)00125-9
- Lin TK, Hughes G, Muratovska A, Blaikie FH, Brookes PS, Darley-Usmar V, Smith RA, Murphy MP. Specific modification of mitochondrial protein thiols in response to oxidative stress: a proteomics approach. J Biol Chem 2002; 277:17048-56; PMID:11861642; https://doi.org/10.1074/jbc.M110797200
- Smith RA, Adlam VJ, Blaikie FH, Manas AR, Porteous CM, James AM, Ross MF, Logan A, Cochemé HM, Trnka J, et al. Mitochondria-targeted antioxidants in the treatment of disease. Ann N Y Acad Sci 2008; 1147:105-11; PMID:19076435; https://doi.org/10.1196/annals.1427.003
- Klein P, Muller-Rischart AK, Motori E, Schonbauer C, Schnorrer F, Winklhofer KF, Klein R. Ret rescues mitochondrial morphology and muscle degeneration of Drosophila Pink1 mutants. EMBO J 2014; 33:341-55; PMID:24473149; https://doi.org/10.1002/embj.201284290
- Dhanasekaran A, Kotamraju S, Kalivendi SV, Matsunaga T, Shang T, Keszler A, Joseph J, Kalyanaraman B. Supplementation of endothelial cells with mitochondria-targeted antioxidants inhibit peroxide-induced mitochondrial iron uptake, oxidative damage, and apoptosis. J Biol Chem 2004; 279:37575-87; PMID:15220329; https://doi.org/10.1074/jbc.M404003200
- Chandran K, Aggarwal D, Migrino RQ, Joseph J, McAllister D, Konorev EA, Antholine WE, Zielonka J, Srinivasan S, Avadhani NG, et al. Doxorubicin inactivates myocardial cytochrome c oxidase in rats: cardioprotection by Mito-Q. Biophys J 2009; 96:1388-98; PMID:19217856; https://doi.org/10.1016/j.bpj.2008.10.042
