
ABSTRACT
Recent studies demonstrated that prolonged exposure of haematopoietic stem cells (HSCs) to type I interferons (IFN) stimulates HSCs entrance into cell cycle, continuous proliferation and eventual exhaustion, which could be prevented by ablation of the Ifnar1 chain of IFN receptor. Given that levels IFNAR1 expression can be robustly affected by IFN-independent ubiquitination and downregulation of IFNAR1 in response to activation of protein kinases such as protein kinase R-like endoplasmic reticulum kinase (PERK) and casein kinase 1α (CK1α), we aimed to determine the role of IFNAR1 downregulation in the maintenance of HSCs. Mice harboring the ubiquitination-deficient Ifnar1S526A allele displayed greater levels of haematopoietic cell progenitors but reduced numbers of the long-term HSCs compared with wild type mice and animals lacking Ifnar1. Studies using competitive bone marrow repopulation assays showed that CK1α (but not PERK) is essential for the long-term HSCs function. Concurrent ablation of Ifnar1 led to a modest attenuation of the CK1α-null phenotype indicating that, although other CK1α targets are likely to be important, IFNAR1 downregulation can contribute to the maintenance of the HSCs function.
Introduction
A proper balance between quiescence, self-renewal, proliferation, and differentiation of the haematopoietic stem cells (HSCs) is critical for function of these cells.Citation1,2 Dormancy of HSCs with long-term self-renewal capacity is essential for the maintenance of sustained blood supply.Citation3 Quiescence of HSCs maintains their long-term stemness by preventing the proliferative exhaustion of these cells.Citation1,4 A number of pathways integrating cell-intrinsic and extrinsic signaling factors control HSCs proliferative and differentiation decisions. For example, the hypoxic conditions in the bone marrow niche for HSCs are considered critical for their maintenance.Citation5
Cytokines and their cognate receptors also play an important role in HSCs function.Citation6,7 During infections that trigger T cell-mediated production of interferon-gamma, this cytokine drives HSCs into proliferation, differentiation and exhaustion.Citation8 Even without infection, type I interferons (IFN) were shown to regulate HSCs proliferation. Negative regulation of IFN signaling by IRF2 was shown to protect HSCs from exhaustion.Citation9 Furthermore, HSCs were shown to respond to treatment with IFN or IFN-inducing agents by increasing the expression of IFN-stimulated genes, the upregulation of stem cell antigen-1 (Sca-1/Ly6A) and increased proliferation and differentiation. Importantly, the exhaustion of HSCs and bone marrow failure triggered by IFN priming followed by treatment with 5-fluoro-uracil could be averted by genetic ablation of the IFNAR1 chain of IFN receptor.Citation10
Cell surface levels of IFNAR1 are important for cellular responses to IFN.Citation11 These levels are largely regulated by phosphorylation-dependent ubiquitination, endocytosis and lysosomal degradation.Citation12-15 Numerous signaling pathways culminating in IFNAR1 phosphorylation and downregulation include those that are induced by IFN and also by ligand-independent stimuli.Citation16-27 The latter rely on IFNAR1 phosphorylation by casein kinase 1α (CK1αCitation17,28) that can be promoted downstream of diverse signaling pathways such as those that activate protein kinase R-like endoplasmic reticulum kinase (PERK,Citation29) including unfolded protein responseCitation18 and hypoxia signaling.Citation26 Given these reports and the role of hypoxia in HSCs maintenance,Citation5 we sought to determine the role of IFNAR1 downregulation (and of CK1α and PERK kinases implicated in this downregulation) in HSCs maintenance and function.
Results
Downregulation of IFNAR1 controls the number of haematopoietic progenitors and long-term HSCs
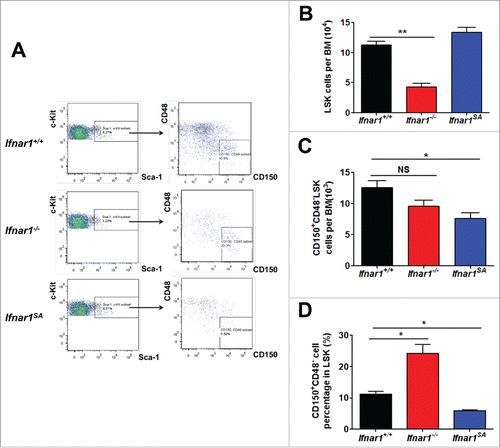
We sought to determine the role of phosphorylation-dependent ubiquitination and downregulation of IFNAR1 in the homeostasis of HSCs. Given that redundancy in kinases capable of driving IFNAR1 downregulation can mask the requirements for individual kinase regulators, we used the knock-in Ifnar1S526A mice (henceforth termed Ifnar1SA) that lack the IFNAR1 phosphorylation site, which is required for the recruitment of the SCF-βTrcp2 E3 ubiquitin ligase and subsequent ubiquitination, endocytosis and downregulation of IFNAR1.Citation30 Bone marrow from these animals was compared with those from wild type mice and mice lacking Ifnar1. Consistent with previously reported role of IFN in stimulating proliferation and subsequent differentiation of LSK cellsCitation10 we observed a lower number of these cells in the bone marrow from Ifnar1−/− mice (). However, these mice displayed a comparable overall frequency of CD150+CD48−LSK cells () and increased percent of these long-term HSCs among all LSK cells (). This result along with a statistically significant decrease in overall and relative frequencies of CD150+CD48−LSK cells in bone marrow from Ifnar1SA mice () suggest that downregulation of IFNAR1 plays an important role in the maintenance of the long-term HSCs.
Figure 1. IFNAR1 level controls the number of haematopoietic progenitors and HSCs. (A) Representative FACS analysis of LSKs (Lin−Sca-1+c-Kit+) and HSCs (CD150+CD48−LSK) in the bone marrow of WT (Ifnar1+/+), Ifnar1−/− and Ifnar1SA mice. (B) Cell number of LSKs in the bone marrow of WT (Ifnar1+/+), Ifnar1−/− and Ifnar1SA mice. (C) Cell number of HSCs in the bone marrow of WT (Ifnar1+/+) and Ifnar1−/− and Ifnar1SA mice. (D) Quantification of HSC frequency in the LSK compartment of WT (Ifnar1+/+) and Ifnar1−/− and Ifnar1SA mice. Values are shown as means ± SEM (n = 5). * p < 0.05; ** p < 0.01; NS, not significant.
PERK is dispensable for downregulation of IFNAR1 in bone marrow and for bone marrow repopulation
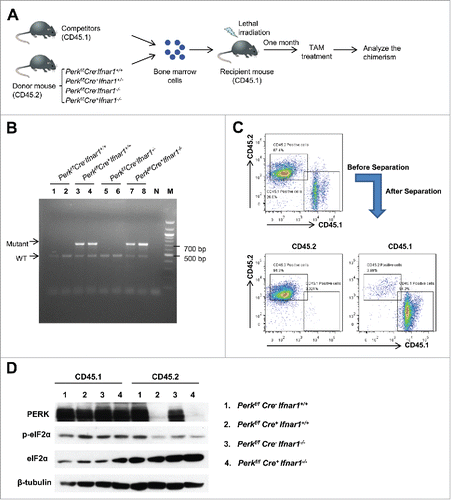
Given that naturally occurring hypoxic conditions in bone marrow are known to contribute to HSCs maintenanceCitation5 and that hypoxia-induced PERK is involved in IFNAR1 downregulation,Citation26 we sought to determine the role of PERK in HSC functions. To this end, we established a competitive bone marrow repopulation assay, in which competitor wild type (WT) bone marrow cells (CD45.1+) mixed at 1:1 ratio with bone marrow cells from Ubc9-CreERT2+/0; Perkf/f; Ifnar1+/+ or Ubc9-CreERT2+/0; Perkf/f; Ifnar1−/− littermates (CD45.2+) were transplanted into lethally irradiated recipient WT mice (CD45.1+) (). One month after transplantation, mice were treated with tamoxifen for 5 d to activate the CreERT2 fusion protein in CD45.2 cells. This treatment led to an efficient ablation of Perk in CD45.2 cells as detected by genotyping PCR () or immunoblot analysis of PERK levels and phosphorylation of its substrate (eIF2α) performed separately in CD45.1 and CD45.2 splenocytes ().
Figure 2. Perk was ablated after tamoxifen treatment. (A) Schematic illustration for the competitive repopulation assay. (B) PCR analysis of Perk excision in genomic DNA obtained from blood leukocytes 4 weeks after TAM treatment. N, Negative control; M, DNA marker (C) Representative FACS analysis of the purity of separated CD45.1+ and CD45.2+ cells from the splenocytes isolated from the mice reconstituted with competitor cells (CD45.1+) and the indicated genotype donor cells (CD45.2+) in the ratio of 1:1 6 weeks after TAM treatment. (D) Western blot analysis of PERK-eIF2α signaling of the separated CD45.1+ and CD45.2+ cells from the mixed chimeras as described in C. Individual experiments were conducted 3 times with similar results, with one representative shown.
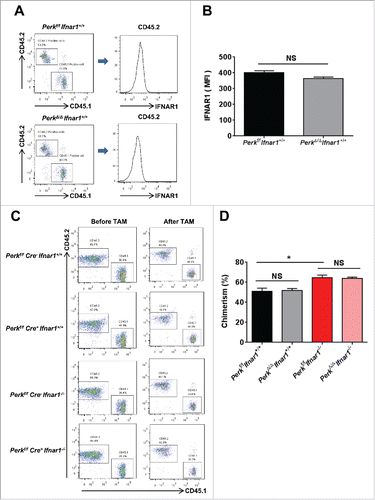
Intriguingly, we did not observe any significant differences in the cell surface levels of IFNAR1 between PERK-competent and PERK-null CD45.2 leukocytes () indicating that PERK function is likely redundant for the control of IFNAR1 downregulation in these cells. Furthermore, the ratio of CD45.1+ and CD45.2+ leukocytes percentage in these mice was not affected by administration of tamoxifen to ablate Perk regardless of Ifnar1 status (). These data suggest that PERK function is redundant for the repopulating activities of bone marrow cells. However, Ifnar1 knockout cells displayed a somewhat greater ability to repopulate () further suggesting an important role of IFNAR1 in HSCs function.
Figure 3. PERK was not required for the bone marrow repopulation and IFNAR1 downregulation. (A) Representative FACS analysis of surface IFNAR1 level in donor cell population (CD45.2+ cells) in peripheral blood of mice reconstituted with competitor cells (CD45.1+) and the indicated genotype bone marrow cells (CD45.2+) in the ratio of 1:1 4 weeks after TAM treatment. (B) Quantification of IFNAR1 level as described in A. (C) Representative FACS analysis of chimerism in peripheral blood of mice reconstituted with competitor cells (CD45.1+) and the indicated genotype bone marrow cells (CD45.2+) in the ratio of 1:1 before TAM treatment (4 weeks after bone marrow transplantation) and 4 weeks after TAM treatment. (D) Quantification of chimerism in peripheral blood 4 weeks after TAM treatment as shown in C. Data are shown the means ± SEM (n = 3). *, p < 0.05; NS, Not significant.
CK1α contributes to the regulation of the IFNAR1 levels in bone marrow cells and plays a major role in HSCs function
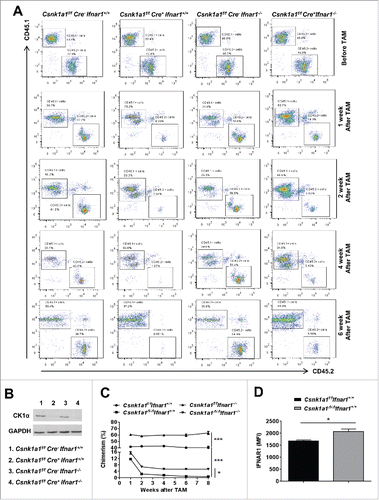
Whereas many kinases (e.g. PERK, GCN2, PKR, p38) were implicated in stimulating the ligand-independent IFNAR1 ubiquitination and downregulation (reviewed inCitation11), CK1α was identified as a bona fide kinase that directly phosphorylates IFNAR1Citation17 and plays a critical role in the control of IFNAR1 levels in the gut.Citation28 Importantly, it was shown that acute ablation of Csnk1a1 (gene encoding CK1α) leads to HSCs failure.Citation31 Here we sought to determine the importance of CK1α-mediated downregulation of IFNAR1 in this phenotype. To this end, we performed a competitive bone marrow repopulation assay, in which competitor WT bone marrow cells (CD45.1+) mixed at 1:1 ratio with bone marrow cells from Ubc9-CreERT2+/0; Csnk1a1f/f; Ifnar1+/+ or Ubc9-CreERT2+/0; Csnk1a1f/f; Ifnar1−/− littermates (CD45.2+) were transplanted into lethally irradiated WT recipient mice (CD45.1+). One month later, these mice were treated with tamoxifen to make Csnk1a1 excision and the reconstitution chimerism was analyzed following tamoxifen treatment.
We found that acute deletion of Csnk1a1 dramatically and progressively impaired the repopulating activities of bone marrow cells from either Ifnar1+/+ or Ifnar1−/− mice (). However, cells from Ifnar1 deficient mice exhibited a mildly greater ability to compete compared with Ifnar1+/+ mice despite a similar extent of CK1α ablation (). Cells from Ifnar1+/+ mice lacking Csnk1a1 displayed a greater cell surface level of IFNAR1 () indicating a role of CK1α in the regulation of IFNAR1 expression. In all, these results support previously published data that Csnk1a1 is essential for bone marrow repopulation capacity and suggest that CK1α-driven downregulation of IFNAR1 can play a moderate role in this repopulation.
Figure 4. IFNAR1 deficiency partially compromised the bone marrow repopulation failure caused by CK1α ablation. (A) Representative FACS analysis of chimerism in peripheral blood of mice reconstituted with competitor cells (CD45.1+) and the indicated genotype bone marrow cells (CD45.2+) in the ratio of 1:1 before TAM treatment (4 weeks after bone marrow transplantation) and 1, 2, 4, 6 weeks after TAM treatment. (B) Western blot analysis of CK1α protein in bone marrow cells isolated from the indicated mice treated with TAM. Individual experiments were conducted 3 times with similar results, with one representative shown. (C) Quantification of chimerism in peripheral blood after TAM treatment as shown in A. Data are shown the means ± SEM (n = 3). *, p < 0.05; ***, p < 0.001. (D) Surface IFNAR1 level in donor cell population (CD45.2+) in peripheral blood of mice reconstituted with competitor cells (CD45.1+) and the indicated genotype bone marrow cells (CD45.2+) in the ration of 1:1 one week after TAM treatment. Data are shown the means ± SEM (n = 5). *, p < 0.05.
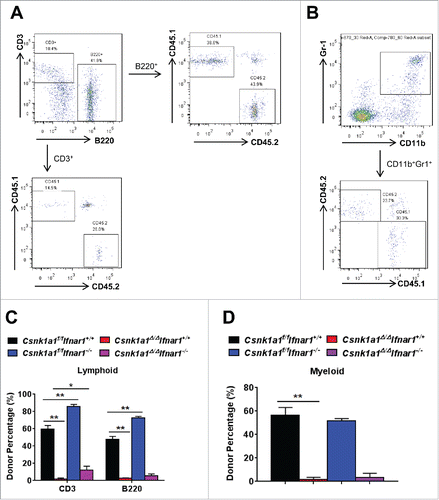
We further analyzed the donor percentage of lymphoid (B220+CD45.2+/CD3+CD45.2+, ) and myeloid (Gr1+CD11b+CD45.2+) lineage in peripheral blood of these mixed bone marrow chimeras 12 weeks after tamoxifen treatment. We found that Csnk1a1f/f Ifnar1−/− bone marrow cells contributed significantly higher percentage of lymphoid lineage (), but no difference of myeloid lineage compared with Csnk1a1f/f Ifnar1+/+ (). However, the frequencies of both lymphoid and myeloid lineages from donors have been dramatically decreased after Csnk1a1 deletion (). Intriguingly, IFNAR1 deficiency resulted in a moderate but significant restoration of lymphoid but not myeloid donor cell percentage upon CK1α loss. These results suggested that loss of Ifnar1 improved lymphoid lineage reconstitution of Csnk1a1 deleted bone marrow cells.
Figure 5. IFNAR1 deficiency moderately improved lymphoid lineage reconstitution of Csnk1a1 deleted bone marrow cells. (A) Representative FACS analysis of donor percentage of lymphoid cell population (B220+CD45.2+/CD3+CD45.2+) in peripheral blood of the mixed bone marrow chimeras as described in 12 weeks after TAM treatment. (B) Representative FACS analysis of donor percentage of myeloid cell population (Gr1+CD11b+CD45.2+) in peripheral blood of the mixed bone marrow chimeras as described in 12 weeks after TAM treatment. (C) Quantification of donor percentage of lymphoid cell population as described in A. D. Quantification of donor percentage of myeloid cell population as described in B. Data are shown the means ± SEM (n = 4). *, p < 0.05; **, p < 0.01.
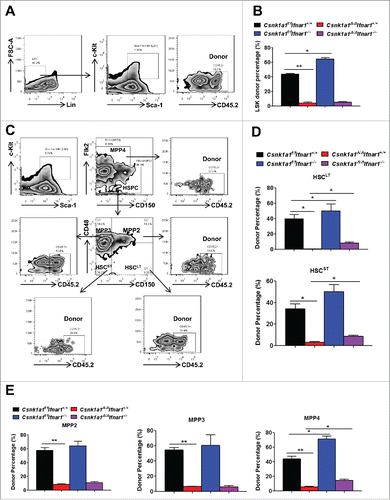
To further examine whether this competitive disadvantage of Csnk1a1 deleted bone marrow cells occurs at the haematopoietic stem and progenitor cells (HSPCs) level, we subsequently analyzed donor percentage of LSKs, short-term HSCs (HSCST), long-term HSCs (HSCLT) and multipotent progenitors (MPPs) in bone marrow of these mixed chimeras 16 weeks after tamoxifen treatment. The results showed that donor-derived LSKs (Lin−Sca-1+c-Kit+CD45.2+) were remarkably diminished upon Csnk1a1 deletion regardless of Ifnar1 status, despite Csnk1a1f/f Ifnar1−/− bone marrow cells contributed higher percentage of LSKs than Csnk1a1f/f Ifnar1+/+ (). Likewise, the lack of CK1α notably abrogated the donor-derived HSCLT (Lin−Sca-1+c-Kit+Flk2−CD150+CD48−CD45.2+), HSCST (Lin−Sca-1+c-Kit+Flk2−CD150−CD48−CD45.2+), and MPPs cell percentages, including MMP2 (Lin−Sca-1+c-Kit+Flk2−CD150+CD48+CD45.2+), MMP3 (Lin−Sca-1+c-Kit+Flk2−CD150−CD48+CD45.2+) and MMP4 (Lin−Sca-1+c-Kit+Flk2+CD150−CD48+CD45.2+). Of note, Csnk1a1f/f Ifnar1−/− bone marrow cells contributed to higher percentage of HSCLT, HSCST and MMP4, which is reported to be lymphoid-primed MPPsCitation32 compared with Csnk1a1f/f Ifnar1+/+. Indeed, IFNAR1 deficiency at least partially restored donor-derived cell percentage of HSCLT, HSCST and MMP4 upon Csnk1a1 deletion, but had no effect on myeloid-biased MPP2 and MPP3, consistent with the above data that lack of Ifnar1 moderately restored donor percentage of lymphoid lineage, but not myeloid lineage (). Taken together, all these data indicated that Csnk1a1 is required for the maintenance of HSPCs, which is partially dependent on IFNAR1 downregulation triggered by CK1α.
Figure 6. Loss of Ifnar1 partially restored the maintenance of HSCs and MPP4 upon Csnk1a1 deletion. (A) Representative FACS analysis of donor percentage of LSKs (Lin−Sca-1+c-Kit+CD45.2+) in bone marrow of the mixed chimeras as described in 16 weeks after TAM treatment. (B) Quantification of donor percentage of LSKs as shown in A. (C) FACS analysis of donor percentage of Long term HSC (HSCLT, Lin−Sca-1+c-Kit+Flk2−CD150+CD48−CD45.2+), Short term HSC (HSCST, Lin−Sca-1+c-Kit+Flk2−CD150−CD48−CD45.2+), MMP2 (Lin−Sca-1+c-Kit+Flk2−CD150+CD48+CD45.2+), MMP3 (Lin−Sca-1+c-Kit+Flk2−CD150−CD48+CD45.2+) and MMP4 (Lin−Sca-1+c-Kit+Flk2+CD150−CD48+CD45.2+). (D) Quantification of donor percentage of HSCLT and HSCST as shown in C. (E) Quantification of donor percentage of MPPs as shown in C. Data are shown the means ± SEM (n = 4). *, p < 0.05; **, p < 0.01.
Discussion
It has been previously shown that HSCs lacking the IFNAR1 chain of type 1 interferon (IFN) receptor or its downstream signaling mediator STAT1 are insensitive to IFN stimulation, demonstrating that IFNAR1 and STAT1 mediate the IFN-induced HSC proliferation. IFN treatment promotes the proliferation of dormant HSCs in vivo; furthermore, prolonged exposure to IFN results in the exhaustion of the HSCs pool and impairment of the HSCs function.Citation10 Given the importance of IFNAR1 in HSCs maintenance and the fact that phosphorylation-driven ubiquitination and degradation of IFNAR1 represents a major mechanism that controls its levels,Citation12,14,19 here we focused on the role of known regulators of IFNAR1 stability in HSCs frequencies and function.
Phosphorylation-dependent ubiquitination and degradation of the IFNAR1 can be mediated by ligand dependent and independent mechanisms. The previous work in our laboratory reported that the ligand-independent pathway is activated by inducers of unfolded protein responses, including viral infection, and that such activation requires the endoplasmic reticulum resident protein kinase PERK.Citation18 This suggests that PERK ablation could prevent IFNAR1 degradation through this mechanism. The altered fate of IFNAR1 affected by signaling downstream of PERK depends on phosphorylation of eIF2α and ensuing activation of p38α kinase and CK1α kinase, thus blunting IFN responses.Citation17,19,20 Based on this, we investigated whether PERK or CK1α play a role for maintaining HSC self-renewal capacity via downregulation of IFNAR1.
Our data obtained in cells lacking Ifnar1 show that deletion of this receptor increases the repopulating activities of the HSCs. Furthermore, data in mice expressing an ubiquitination-deficient Ifnar1SA mutant suggest that downregulation of IFNAR1 improves the maintenance of the long-term HSCs. However, it appears that PERK function is dispensable for either controlling IFNAR1 cell surface levels or the repopulating activities of HSCs. Given that other kinases such as PRK, GCN2 and p38αCitation20,26 were also implicated in transducing the signal upstream of CK1α to increase the ability of CK1α to mediate phosphorylation of IFNAR1, it is plausible that these kinases can replace PERK function upon its acute ablation in HSCs.
Ubiquitination-determining phosphorylation of IFNAR1 on specific serine residues that leads to the recruitment of βTrcp E3 ubiquitin ligase can be mediated by either protein kinase D2Citation23,24,27 or CK1α.Citation17 Our current studies involving acute ablation of CK1α revealed that deletion of this kinase upregulates the cell surface levels of IFNAR1. These data are consistent with a hypothesis that, similarly to the intestinal epithelial cells,Citation28 the CK1α-dependent pathway plays an important role in controlling IFNAR1 expression in HSCs.
Furthermore, acute ablation of CK1α in HSCs dramatically suppressed their frequencies and repopulating activities. These results are consistent with recently reported observation of HSCs failure induced by deletion of CK1α in a different mouse model.Citation31 Intriguingly, ablation of CK1α in cells already lacking Ifnar1 was somewhat less detrimental for the HSCs activities compared with Ifnar1-competent cells. These results point that IFNAR1 stabilization may moderately contribute to the HSCs' functional deficiencies associated with inactivation of CK1α, although most of these phenotypical problems are clearly IFNAR1-independent and are likely to be attributed to other important substrates of CK1α. Future studies determining these substrates should provide a foundation for optimizing the therapeutic efforts that use lenalidomide to target CK1α as a strategy for the treatment of some hematologic malignancies.Citation33-35
Materials and methods
Animals
All animal work was conducted according to relevant national and international guidelines, including the requirements of the Association for the Assessment and Accreditation of Laboratory Animal Care International. Animal protocols 803995 and 804470 were approved by the Institutional Animal Care and Use Committee at the University of Pennsylvania. Littermates C57BL/6 Ifnar1+/+ (“WT”), C57BL/6 Ifnar1−/− (generously provided by Susan Weiss, University of Pennsylvania) and C57BL/6 Ifnar1S526A mice (“SA”) were described previously.Citation30 Ubc9-CreERT2 (gift from E. Brown, University of Pennsylvania) were crossed with Perkf/f mice (kindly provided by J. Alan Diehl, Medical University of South Carolina) or Csnk1a1f/f mice (kindly provided by Yinon Ben-Neriah, Hebrew University, Israel) and either Ifnar1−/− mice to generate Ubc9-CreERT2+/0; Perkf/f; Ifnar1+/+ or Ubc9-CreERT2+/0; Perkf/f; Ifnar1−/− littermates, and Ubc9-CreERT2+/0; Csnk1a1f/f; Ifnar1+/+ or Ubc9-CreERT2+/0; Csnk1a1f/f; Ifnar1−/− littermates respectively. Genotyping of mice using tail DNA was performed by PCR as described before.Citation28,29
Competitive bone marrow repopulation assay
Six–8 week-old genotyped mice were killed, dissect long bones (femur, tibia) and flush bone cavity with flushing media (PBS (GIBCO) + 2% FBS + Penicillin/Streptomycin) to collect bone marrow cells. Donor cells (CD45.2) were mixed with bone marrow cells from WT competitor mice (CD45.1) at 1:1 ratio, with a total of 4 × 10⁶ cells per recipient mouse, and subsequently injected retro-orbitally into lethally irradiated CD45.1 mice. The percentage of chimerism and lineage analysis in the peripheral blood was analyzed as the fraction of donor-descended CD45.2 cells at the indicated time point after transplantation using flow cytometry.
Tamoxifen treatment
To induce Perk or Csnk1a1 deletion in the donor cells, one month after bone marrow transplantation, tamoxifen (Sigma) was dissolved in maize oil (Sigma) and given once daily via oral gavage for 5 consecutive days at a dose of 0.2 mg/g of body weight/day. Time after tamoxifen treatment was determined after the last treatment.
Flow cytometry
Single-cell suspension in FACS buffer (1% BSA-PBS) was blocked with anti-mouse CD16/32 antibodies for 15 min before staining with specific antibodies. We used the following antibodies against cell surface markers: anti-CD45.1-FITC/APC (Biolegend, A20), anti-CD45.2-PE/FITC (Biolegend, 104), anti-CD11b-APC (Biolegend, M1/70), anti-Gr1-APC/Cy7 (Biolegend, RB6–8C5), Anti-CD3-Percp Cy5.5 (145–2C11), anti-B220-APC (RA3–6B2), anti-lineage cocktail-Pacific Blue™ (Biolegend, 17A2/RB6–8C5/RA3–6B2/Ter-119/M1/70), anti-Sca-1-PerCP-Cy5.5 (eBioscience, D7), anti-c-Kit-APC-eFluor780 (eBioscience, 2B8), anti-CD48-APC (eBioscience, HM48–1), anti-CD150-PE/Cy7 (Biolegend, TC15–12F12.2), anti-Flk2(CD135)-PE (Biolegend, A2F10), anti-IFNAR1-PE (Biolegend, MAR1–5A3). Samples were mixed with DAPI (1 μg/ml) and analyzed using the LSRFortessa flow cytometer (BD Biosciences). The data were then analyzed using the FlowJo software (Tree Star).
Separation of the CD45.1 and CD45.2 positive cells
CD45.1 and CD45.2 positive spleen cells were separated using MACS Separation (Miltenyi Biotec). Briefly, the splenocytes were re-suspended in 400 µl MACS buffer and 50 μL of the anti-biotin CD45.1 antibody was added to the mixed cells. Cells were then incubated for 1 hr at 4°C, washed 3 times with 1 ml PBS and re-suspended in 400 μl MACS buffer. Streptavidin microbeads (100 μl) were then added followed the incubation for 30 mins at 4°C. After triple washes (with 1 ml PBS), cells were re-suspended in 500 μl MACS buffer and loaded onto the equilibrated MACS column, which were then placed in the magnetic field of a suitable MACS separator. Flow through CD45.2+ cells were then harvested and washed and, upon removing the magnetic field, the CD45.1+ cells were further eluted by positive pressure. Cells were stained with CD45.1 and CD45.2 antibodies before and after separation to test the purity by FACS.
Western blot
Cells were re-suspended in RIPA buffer with protease and phosphatase inhibitors on ice. After protein quantification, lysates were re-suspended in Sample Buffer, boiled at 100°C, and separated by 12% SDS-PAGE. Proteins were then transferred onto Immobilon polyvinyl difluoride membranes, blocked and incubated with antibodies to detect PERK (C33E10 1:1000, Cell Signaling Technology), p-eIF2α (S51 1:1000, Cell Signaling Technology), eIF2α (D-3 1:1000, Santa Cruz), CK1α (C-19 1:1000, Santa Cruz), β-Tubulin (2146S 1:5000, Cell Signaling Technology), GAPDH (D16H11 1:5000, Cell Signaling Technology). Secondary antibodies conjugated to horseradish peroxidase were purchased from Millipore Bioscience Research Reagents. Blots were developed using ECL (GE Healthcare).
Statistical analysis
Data were expressed as mean ± SEM. Statistical analysis was performed using Microsoft Excel (Microsoft) or GraphPad Prism 6 software (GraphPad Prism Software Inc.). Unpaired Student t test was used for the comparison between 2 groups. One-way ANOVA or 2-way ANOVA were used for the multiple comparisons. Differences were considered significant at p < 0.05. All described results are representative of at least 3 independent experiments.
Disclosure of potential conflicts of interest
No potential conflicts of interest were disclosed.
Author contributions
J.G., W.T., S.Y.F. designed the research. J.G., B.Z., K.L. performed the experiments and analyzed data. J.G., S.Y.F wrote the paper with help of all authors.
Acknowledgments
We thank Drs. Susan Weiss (University of Pennsylvania, Philadelphia, PA, USA), J. Alan Diehl (Medical University of South Carolina, Charleston, SC, USA) and Yinon Ben-Neriah (Hebrew University, Jerusalem, Israel) for their kind gift of Ifnar1−/−, Perkf/f and Csnk1a1f/f animals.
Funding
This work was supported by the NIH/NCI PO1 CA165997 and RO1 CA092900 grants (to S.Y.F.).
References
- Passegue E, Wagers AJ, Giuriato S, Anderson WC, Weissman IL. Global analysis of proliferation and cell cycle gene expression in the regulation of hematopoietic stem and progenitor cell fates. J Exp Med 2005; 202:1599-611; PMID:16330818; https://doi.org/10.1084/jem.20050967
- Huang X, Cho S, Spangrude GJ. Hematopoietic stem cells: generation and self-renewal. Cell Death Differ 2007; 14:1851-9; PMID:17823616; https://doi.org/10.1038/sj.cdd.4402225
- Cheshier SH, Morrison SJ, Liao X, Weissman IL. In vivo proliferation and cell cycle kinetics of long-term self-renewing hematopoietic stem cells. Proc Natl Acad Sci U S A 1999; 96:3120-5; PMID:10077647; https://doi.org/10.1073/pnas.96.6.3120
- Matsumoto A, Nakayama KI. Role of key regulators of the cell cycle in maintenance of hematopoietic stem cells. Biochim Biophys Acta 2013; 1830:2335-44; PMID:22820018; https://doi.org/10.1016/j.bbagen.2012.07.004
- Suda T, Takubo K, Semenza GL. Metabolic regulation of hematopoietic stem cells in the hypoxic niche. Cell Stem Cell 2011; 9:298-310; PMID:21982230; https://doi.org/10.1016/j.stem.2011.09.010
- Arai F, Hirao A, Ohmura M, Sato H, Matsuoka S, Takubo K, Ito K, Koh GY, Suda T. Tie2/angiopoietin-1 signaling regulates hematopoietic stem cell quiescence in the bone marrow niche. Cell 2004; 118:149-61; PMID:15260986; https://doi.org/10.1016/j.cell.2004.07.004
- Kiel MJ, Yilmaz OH, Iwashita T, Yilmaz OH, Terhorst C, Morrison SJ. SLAM family receptors distinguish hematopoietic stem and progenitor cells and reveal endothelial niches for stem cells. Cell 2005; 121:1109-21; PMID:15989959; https://doi.org/10.1016/j.cell.2005.05.026
- Baldridge MT, King KY, Boles NC, Weksberg DC, Goodell MA. Quiescent haematopoietic stem cells are activated by IFN-gamma in response to chronic infection. Nature 2010; 465:793-7; PMID:20535209; https://doi.org/10.1038/nature09135
- Sato T, Onai N, Yoshihara H, Arai F, Suda T, Ohteki T. Interferon regulatory factor-2 protects quiescent hematopoietic stem cells from type I interferon-dependent exhaustion. Nat Med 2009; 15:696-700; PMID:19483695; https://doi.org/10.1038/nm.1973
- Essers MA, Offner S, Blanco-Bose WE, Waibler Z, Kalinke U, Duchosal MA, Trumpp A. IFNalpha activates dormant haematopoietic stem cells in vivo. Nature 2009; 458:904-8; PMID:19212321; https://doi.org/10.1038/nature07815
- Fuchs SY. Hope and fear for interferon: The receptor-centric outlook on the future of interferon therapy. J Interferon Cytokine Res 2013; 33:211-25; PMID:23570388; https://doi.org/10.1089/jir.2012.0117
- Kumar KG, Tang W, Ravindranath AK, Clark WA, Croze E, Fuchs SY. SCF(HOS) ubiquitin ligase mediates the ligand-induced down-regulation of the interferon-alpha receptor. EMBO J 2003; 22:5480-90; PMID:14532120; https://doi.org/10.1093/emboj/cdg524
- Kumar KG, Krolewski JJ, Fuchs SY. Phosphorylation and specific ubiquitin acceptor sites are required for ubiquitination and degradation of the IFNAR1 subunit of type I interferon receptor. J Biol Chem 2004; 279:46614-20; PMID:15337770; https://doi.org/10.1074/jbc.M407082200
- Kumar KG, Barriere H, Carbone CJ, Liu J, Swaminathan G, Xu P, Li Y, Baker DP, Peng J, Lukacs GL, et al. Site-specific ubiquitination exposes a linear motif to promote interferon-alpha receptor endocytosis. J Cell Biol 2007; 179:935-50; PMID:18056411; https://doi.org/10.1083/jcb.200706034
- Kumar KG, Varghese B, Banerjee A, Baker DP, Constantinescu SN, Pellegrini S, Fuchs SY. Basal ubiquitin-independent internalization of interferon alpha receptor is prevented by Tyk2-mediated masking of a linear endocytic motif. J Biol Chem 2008; 283:18566-72; PMID:18474601; https://doi.org/10.1074/jbc.M800991200
- Liu J, Plotnikov A, Banerjee A, Suresh Kumar KG, Ragimbeau J, Marijanovic Z, Baker DP, Pellegrini S, Fuchs SY. Ligand-independent pathway that controls stability of interferon alpha receptor. Biochem Biophys Res Commun 2008; 367:388-93; PMID:18166147; https://doi.org/10.1016/j.bbrc.2007.12.137
- Liu J, Carvalho LP, Bhattacharya S, Carbone CJ, Kumar KG, Leu NA, Yau PM, Donald RG, Weiss MJ, Baker DP, et al. Mammalian casein kinase 1alpha and its leishmanial ortholog regulate stability of IFNAR1 and type I interferon signaling. Mol Cell Biol 2009; 29:6401-12; PMID:19805514; https://doi.org/10.1128/MCB.00478-09
- Liu J, HuangFu WC, Kumar KG, Qian J, Casey JP, Hamanaka RB, Grigoriadou C, Aldabe R, Diehl JA, Fuchs SY. Virus-induced unfolded protein response attenuates antiviral defenses via phosphorylation-dependent degradation of the type I interferon receptor. Cell Host Microbe 2009; 5:72-83; PMID:19154989; https://doi.org/10.1016/j.chom.2008.11.008
- Bhattacharya S, HuangFu WC, Liu J, Veeranki S, Baker DP, Koumenis C, Diehl JA, Fuchs SY. Inducible priming phosphorylation promotes ligand-independent degradation of the IFNAR1 chain of type I interferon receptor. J Biol Chem 2010; 285:2318-25; PMID:19948722; https://doi.org/10.1074/jbc.M109.071498
- Bhattacharya S, Qian J, Tzimas C, Baker DP, Koumenis C, Diehl JA, Fuchs SY. Role of p38 protein kinase in the ligand-independent ubiquitination and down-regulation of the IFNAR1 chain of type I interferon receptor. J Biol Chem 2011; 286:22069-76; PMID:21540188; https://doi.org/10.1074/jbc.M111.238766
- Bhattacharya S, Zheng H, Tzimas C, Carroll M, Baker DP, Fuchs SY. Bcr-abl signals to desensitize chronic myeloid leukemia cells to IFNalpha via accelerating the degradation of its receptor. Blood 2011; 118:4179-87; PMID:21821707; https://doi.org/10.1182/blood-2010-12-325373
- Qian J, Zheng H, Huangfu WC, Liu J, Carbone CJ, Leu NA, Baker DP, Fuchs SY. Pathogen recognition receptor signaling accelerates phosphorylation-dependent degradation of IFNAR1. PLoS Pathog 2011; 7:e1002065; PMID:21695243; https://doi.org/10.1371/journal.ppat.1002065
- Zheng H, Qian J, Baker DP, Fuchs SY. Tyrosine phosphorylation of protein kinase D2 mediates ligand-inducible elimination of the Type 1 interferon receptor. J Biol Chem 2011; 286:35733-41; PMID:21865166; https://doi.org/10.1074/jbc.M111.263608
- Zheng H, Qian J, Carbone CJ, Leu NA, Baker DP, Fuchs SY. Vascular endothelial growth factor-induced elimination of the type 1 interferon receptor is required for efficient angiogenesis. Blood 2011; 118:4003-6; PMID:21832278; https://doi.org/10.1182/blood-2011-06-359745
- Huangfu WC, Qian J, Liu C, Liu J, Lokshin AE, Baker DP, Rui H, Fuchs SY. Inflammatory signaling compromises cell responses to interferon alpha. Oncogene 2012; 31:161-72; PMID:21666722; https://doi.org/10.1038/onc.2011.221
- Bhattacharya S, HuangFu WC, Dong G, Qian J, Baker DP, Karar J, Koumenis C, Diehl JA, Fuchs SY. Anti-tumorigenic effects of Type 1 interferon are subdued by integrated stress responses. Oncogene 2013; 32:4214-21; PMID:23045272; https://doi.org/10.1038/onc.2012.439
- Zheng H, Qian J, Varghese B, Baker DP, Fuchs S. Ligand-stimulated downregulation of the alpha interferon receptor: Role of protein kinase D2. Mol Cell Biol 2011; 31:710-20; PMID:21173164; https://doi.org/10.1128/MCB.01154-10
- Katlinskaya YV, Katlinski KV, Lasri A, Li N, Beiting DP, Durham AC, Yang T, Pikarsky E, Lengner CJ, Johnson FB, et al. Type I interferons control proliferation and function of the intestinal epithelium. Mol Cell Biol 2016; 36:1124-35; PMID:26811327; https://doi.org/10.1128/MCB.00988-15
- Yu Q, Zhao B, Gui J, Katlinski KV, Brice A, Gao Y, Li C, Kushner JA, Koumenis C, Diehl JA, et al. Type I interferons mediate pancreatic toxicities of PERK inhibition. Proc Natl Acad Sci U S A 2015; 112:15420-5; PMID:26627716; https://doi.org/10.1073/pnas.1516362112
- Bhattacharya S, Katlinski KV, Reichert M, Takano S, Brice A, Zhao B, Yu Q, Zheng H, Carbone CJ, Katlinskaya YV, et al. Triggering ubiquitination of IFNAR1 protects tissues from inflammatory injury. EMBO Mol Med 2014; 6:384-97; PMID:24480543; https://doi.org/10.1002/emmm.201303236
- Schneider RK, Adema V, Heckl D, Jaras M, Mallo M, Lord AM, Chu LP, McConkey ME, Kramann R, Mullally A, et al. Role of casein kinase 1A1 in the biology and targeted therapy of del(5q) MDS. Cancer Cell 2014; 26:509-20; PMID:25242043; https://doi.org/10.1016/j.ccr.2014.08.001
- Pietras EM, Reynaud D, Kang YA, Carlin D, Calero-Nieto FJ, Leavitt AD, Stuart JM, Gottgens B, Passegue E. Functionally distinct subsets of lineage-biased multipotent progenitors control blood production in normal and regenerative conditions. Cell Stem Cell 2015; 17:35-46; PMID:26095048; https://doi.org/10.1016/j.stem.2015.05.003
- Kronke J, Fink EC, Hollenbach PW, MacBeth KJ, Hurst SN, Udeshi ND, Chamberlain PP, Mani DR, Man HW, Gandhi AK, et al. Lenalidomide induces ubiquitination and degradation of CK1alpha in del(5q) MDS. Nature 2015; 523:183-8; PMID:26131937; https://doi.org/10.1038/nature14610
- Lindner S, Kronke J. The molecular mechanism of thalidomide analogs in hematologic malignancies. Journal of molecular medicine 2016; 94:1327-34; PMID:27492707; https://doi.org/10.1007/s00109-016-1450-z
- Petzold G, Fischer ES, Thoma NH. Structural basis of lenalidomide-induced CK1alpha degradation by the CRL4(CRBN) ubiquitin ligase. Nature 2016; 532:127-30; PMID:26909574; https://doi.org/10.1038/nature16979