
ABSTRACT
Triple-negative breast cancer (TNBC) is an aggressive breast cancer subtype characterized by poor patient prognosis and for which no targeted therapies are currently available. TNBC can be further categorized as either basal-like (BLBC) or quintuple-negative breast cancer (QNBC). In the present study, we aimed to identify novel molecular therapeutic targets for TNBC by analyzing the mRNA expression of TNBC-related genes in publicly available microarray data sets. We found that Engrailed 1 (EN1) was significantly overexpressed in TNBC. Using breast cancer cell lines, we found that EN1 was more highly expressed in TNBC than in other breast cancer subtypes. EN1 expression was analyzed in 199 TNBC paraffin-embedded tissue samples by immunohistochemistry. EN1 protein expression was positively associated with reduced overall survival (OS) rate in patients with QNBC, but not those with BLBC. The importance of EN1 expression in QNBC cell viability and tumorigenicity was evaluated using the QNBC cell lines, HCC38 and HCC1395. Based on our data, EN1 may promote the proliferation, migration, and multinucleation of QNBC cells, likely via the transcriptional activation of HDAC8, UTP11L, and ZIC3. We also demonstrated that actinomycin D effectively inhibits EN1 activity in QNBC cells. The results of the present study suggest that EN1 activity is highly clinically relevant to the survival prognosis of patients with QNBC and EN1 is a promising potential therapeutic target for future QNBC treatment.
Introduction
Breast cancer cases are classified according to the expression status of estrogen receptor (ER), progesterone receptor (PR), and human epidermal growth factor receptor 2 (HER2) as being either luminal A (ER+ or PR+/HER2–), luminal B (ER+ or PR+/HER2+), HER2 (ER–/PR–/HER2+), or triple-negative (TNBC; ER–/PR–/HER2–) breast cancer.Citation1,Citation2 Rakha et al. and Choi et al. reported that TNBC is further categorized as either basal-like (BLBC; ER–/PR–/HER2–/CK5/6+ or epidermal growth factor receptor (EGFR)+), or quintuple-negative (QNBC; ER–/PR–/HER2–/CK5/6–/EGFR–) breast cancer according to biological and clinical differences.Citation3-Citation5 TNBC accounts for approximately 15–20% of all breast cancer cases and is associated with a poorer prognostic outcome than other breast cancer subtypesCitation6,Citation7; furthermore, while targeted therapies have been developed to treat luminal A, luminal B, and HER2 breast cancer cases, no therapeutic targets have been identified for the treatment of TNBC. Thus, TNBC is a challenging subtype for which the identification of novel therapeutic molecular targets is urgently needed.
Recently, easily accessible public databases containing data from various genetic studies of multiple tumor types have been increasingly used to conduct in silico analyses for genomic medicine studies.Citation8-Citation11 In the present study, we analyzed several publicly available breast cancer gene expression datasets to identify novel TNBC biomarkers. We found that Engrailed 1 (EN1) is significantly overexpressed in TNBC. EN1 is a neural-specific transcription factor that promotes cell survival and cell resistance to apoptotic stress, thereby promoting dopaminergic neuronal-cell longevity throughout adulthood.Citation12,Citation13 Interestingly, a recent study suggested that EN1 is exclusively overexpressed in BLBC tumors (excluding claudin-low and normal-like subtypes in TNBCs), which were identified using SigClust,Citation14 and that EN1 overexpression in this context likely activates survival pathways.Citation15 However, the clinical and functional significance of EN1 overexpression in TNBC are unknown.
In the present study, we examined the correlation between EN1 expression and clinical outcomes in TNBC. We also evaluated the expression status of EN1 and investigated the effect of EN1 overexpression in breast cancer and TNBC cell lines, respectively.
Results
EN1 expression status in TNBC
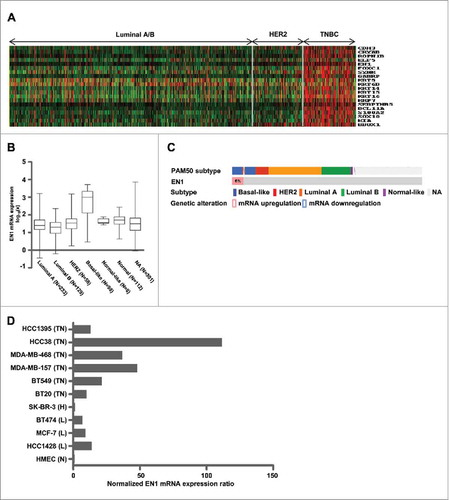
To identify novel TNBC biomarkers, we analyzed the mRNA expression of TNBC-related genes in publicly available microarray databases generated by analyzing tissue samples from patients with breast cancer. We identified 20 genes that were significantly overexpressed in TNBC compared to in other breast cancer tissues (). After conducting a literature review to determine the biological relevance of these 20 genes, we selected EN1, which has not been previously reported as a biomarker of TMBC and may have oncogenic potency; its role has not been widely investigated in TNBC (Supplementary Table S1). Thus, we next compared EN1 mRNA levels between cancer subtypes in a dataset of 825 samples from The Cancer Genome Atlas (TCGA; Nature 2012, www.cbioportal.org). The results of this analysis showed that EN1 was differentially expressed across the analyzed cancer subtypes and exhibited a higher median expression value in BLBC compared to in the luminal, HER2, and/or normal-like cancer subtypes (). In this data set, BLBC tumors (excluding the normal-like subtype in TNBCs) were defined by PAM50 subtypes. According to the threshold value (z-score ± 2.0) established by TCGA, EN1 was upregulated in 48 (6%) of the 825 patient cases, 45 of which were categorized as BLBC (). To investigate EN1 upregulation in the context of TNBC, we compared EN1 mRNA expression levels in breast cancer and normal epithelial cell lines. The analyzed TNBC cell lines exhibited significant upregulation of EN1, but not EN2 (an EN1 paralog), compared to in the normal, luminal, and HER2-subtype cell lines (, Supplementary Figure S1).
Figure 1. EN1 mRNA expression is highly expressed in the TNBC subtype. (A) The top-ranked 20 genes differentially expressed in TNBC were identified by analyzing public microarray datasets utilized in our previous report.Citation46 (B) EN1 mRNA expression in breast cancer was evaluated in a dataset of 939 samples from The Cancer Genome Atlas (TCGA). Bar indicates the median value. (C) EN1 upregulation was evaluated in a dataset of 825 samples from TCGA, and the presented figure was generated using cBioPortal software (www. cbioportal.org). (D) EN1 mRNA expression was quantified via quantitative real-time (qRT)-PCR in breast-cancer cell lines and expressed relative to the calculated EN1/HPRT expression ratio. N, normal epithelial; L, luminal A/B; H, HER2; TN, TNBC.
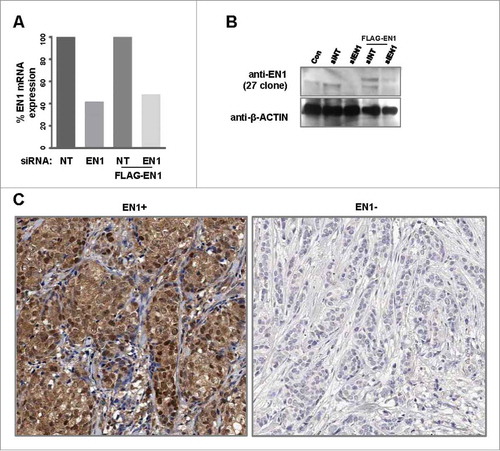
We next performed immunohistochemical analysis of EN1 protein expression in tissue samples from a cohort of 199 patients with TNBC. To facilitate this analysis, we first conducted western blotting to assess the ability and specificity of commercial EN1 antibodies (from three different companies) to bind various EN1 regions. Specifically, we assessed the ability of the following: rabbit polyclonal RB13885 antibody (Abgent) to bind a synthetic peptide near the EN1 N-terminus, rabbit polyclonal RB14104 antibody (Abgent) to bind a synthetic peptide near the center of the EN1 sequence, rabbit polyclonal ab83693 antibody (Abcam) to bind a synthetic peptide near the EN1 C-terminus, and mouse monoclonal 1F5 antibody (Abnova) to bind the full-length EN1 protein epitope. However, the resulting western blot signals were not consistent with the results of quantitative reverse transcription (qRT)-PCR analysis, suggesting that each of the four antibodies exhibited significant non-specific reactivity (data not shown). Therefore, we generated three rabbit polyclonal antibodies against novel synthetic peptides specifically targeted to the EN1 and not the EN2 sequence (Supplementary Figure S2). Of these three antibodies, clones 27 and 28 showed specific reactivity, as indicated by the observed relative consistency between the produced western blot and qRT-PCR results (data not shown). The specificity of both antibodies was further assessed by validating the EN1 small interfering RNA (siRNA) and overexpression constructs using western blot analysis, and clone 27 polyclonal antibody was selected for use in subsequent immunohistochemical analysis of a TNBC tissue microarray (, ). Consistent with the data contained in The Human Protein Atlas (www.proteinaltras.org, Supplementary Figure S3), this analysis showed that EN1 protein localizes to both the nucleus and cytosol of TNBC cells ().
Figure 2. EN1 protein is localized to both the nucleus and cytoplasm in tissues from patients with breast cancer. (A) siRNA-mediated EN1 knockdown was evaluated by quantitative real-time (qRT)-PCR in parental or ectopic EN1-overexpressing HCC38 cells. NT, non-targeting. (B) To verify the specificity of synthesized (clone 27) EN1 antibody, EN1 levels were confirmed via immunoblot analysis of parental or ectopic EN1-overexpressing HCC38 cells. (C) Positive (left) and negative (right) EN1 protein expression was identified by immunohistochemical staining of breast-cancer tissue microarray blocks with the synthesized (clone 27) EN1 antibody.
Clinical implications of EN1 expression on the survival of patients with TNBC
To investigate the clinical significance of EN1 expression and activity in TNBC, we evaluated EN1 levels in the tissue microarray generated from 199 TNBC patient tissue samples via immunohistochemical analysis. The median age of the analyzed patients at TNBC diagnosis was 45 (range 23–80) years; EN1 expression was found to be localized to the cytoplasm and nucleus of cells in 183 (91.6%) and 160 (80.4%) of patients, respectively (); localization of EN1 expression was not correlated between the BLBC and QNBC subtypes (Supplementary Table S2). We also showed that EN1 expression was not correlated with patient age, tumor size, lymph node involvement, stage at diagnosis, or response to primary chemotherapy.
Table 1. EN1 expression with respect to breast cancer subtype and clinicopathological characteristics of patients with TNBC.
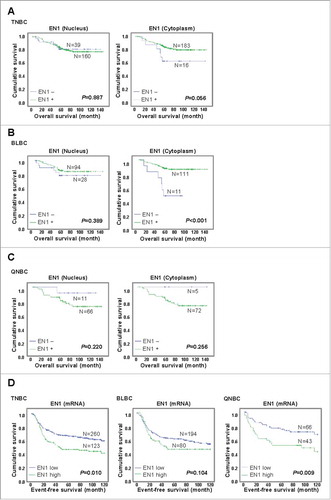
Next, we used the Kaplan-Meier method to evaluate the prognostic value of nuclear and/or cytoplasmic EN1 expression and EN1 localization on the OS of patients with TNBC. We found that in the analyzed TNBC cohort, nuclear EN1 expression was not significantly associated with a lower OS rate (P = 0.887), while there was a trend towards an association between cytoplasmic EN1 expression and a higher OS rate (P = 0.056) in patients with TNBC (). To compare this trend with those in other cohorts, we analyzed the prognostic value of EN1 mRNA expression in TNBC using a TCGA dataset comprising 106 samples (Nature 2012) and second public microarray dataset comprising 294 samples (www.KMplot.comCitation16). Although this analysis revealed no significant association, an inverse trend showed that higher EN1 mRNA expression was associated with both a lower (P = 0.109) and higher OS (P = 0.860) rate in patients from the first and second datasets, respectively (Supplementary Figure S4A, B). In BLBC patients, an association between nuclear EN1 expression and higher OS rate was not significant, but cytoplasmic EN1 expression was associated with a higher OS (P < 0.001) rate in patients with BLBC, which is consistent with the results observed for TNBC patients (). Contrary to BLBC patients, a trend towards were shown that an association with a reduced OS rate and EN1+ QNBC patients in both nuclear and cytoplasmic EN1 expression (P = 0.220 and P = 0.256, respectively; ). We further analyzed the prognostic value of EN1 mRNA expression using publicly available TNBC microarray datasets.Citation17 Of the total 579 analyzed TNBC samples, we identified 159 (27.5%) samples lacking CK5/6 and EGFR expression, which were classified as QNBC (Supplementary Figure S5). This proportion was lower than the 39.3% identified in a previous study by Choi et al.,Citation3 likely because of the strict threshold for selection used in the present study. Interestingly, we found a significant association between high EN1 mRNA expression and reduced event-free survival (EFS) rate only in QNBC (P = 0.009), but not BLBC (P = 0.104) (), suggesting that this factor can predict poor survival in patients with QNBC, but not in those with BLBC.
Figure 3. EN1 protein expression is associated with poor survival in patients with quintuple-negative breast cancer (QNBC). The impact of nuclear and/or cytoplasmic EN1 protein localization on the overall survival (OS) of patients with (A) TNBC, (B) BLBC, and (C) QNBC was analyzed using the Kaplan-Meier method. (C) The impact of EN1 expression on EFS in patients with QNBC was analyzed using the Kaplan-Meier method.
Effects of EN1 expression in QNBC cells
Given the observed association between EN1 expression and clinical outcomes in patients with QNBC, we next examined whether EN1 regulates QNBC cell growth. We defined QNBC cell lines as lacking EGFR and CK5/6 expression based on a report by Kao et al.Citation18 and immunocytochemical analysis. Thus, in the present study, a total of six TNBC cell lines were screened for EGFR and CK5/6 expression, and HCC38 and HCC1395 cell lines were categorized as QNBC cells and selected for further functional evaluation (Supplementary Figure S6A, B). EN1 protein levels were high in both the cytoplasm and nucleus of the selected HCC38 cell line via immunocytochemical and immunofluorescent analysis, respectively (Supplementary Figure S6C). We then examined whether EN1 regulates QNBC cell growth. EN1 depletion was confirmed by qRT-PCR (Supplementary Figure S7A). EN1 depletion resulted in decreased HCC38 and HCC1395 cell proliferation and migration ( and ). In complementary experiments, ectopic EN1 overexpression was confirmed by qRT-PCR (Supplementary Figure S7B). EN1 overexpression resulted in increased HCC38 and HCC1395 cell proliferation and migration ( and ). Together, these findings suggest that EN1 contributes to QNBC cell tumorigenicity. In addition, we determined that ectopic EN1 overexpression increased the incidence of multinucleated cells in treated compared to in control HCC38 and HCC1395 cell populations ( and Supplementary Figure S7C), but did not induce either polyploidy or cell cycle aberrations (Supplementary Figure S7D).
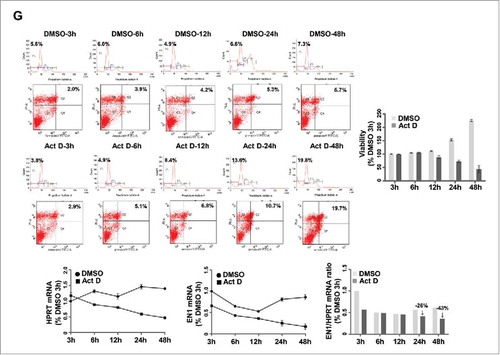
Figure 4. EN1 contributes to tumorigenicity of quintuple-negative breast cancer (QNBC) cells. (A and B) The effects of EN1 knockdown on cell proliferation (A) and migration (B) were evaluated via a WST-1 and Boyden chamber assay, respectively. (C and D) The effects of ectopic EN1 overexpression on cell proliferation (C) and migration (D) were evaluated via a WST-1 and Boyden chamber assay, respectively. n = 3; Bars, SE; *P < 0.05, **P < 0.01, Student's t-test. (E) The effect of ectopic EN1 overexpression on HCC38 cell phenotype was monitored via confocal microscopy after staining with an anti-FLAG antibody (green), anti-LAMIN antibody (red), and DAPI (blue). (F) The reduction of HDAC8, UPT11L, and ZIC3 downregulation by siRNA-mediated EN1 knockdown was quantified in treated and control HCC38 and HCC1395 cells by qRT-PCR. (G) The inhibition of cell growth at the indicated times after treatment was evaluated via a WST-1 assay in HCC38 cells treated with 1 nM actinomycin D or DMSO (control). The apoptotic potential of treated cells (%) was determined by flow cytometry and Annexin V assay. The cells were stained with propidium iodide and Annexin V antibody, and their DNA content and intensity were analyzed by flow cytometry. Numbers indicate the percentage of apoptotic cells in each quadrant. EN1 mRNA expression was quantified by qRT-PCR, while EN1 mRNA levels were expressed relative to the calculated EN1/HPRT expression ratio.
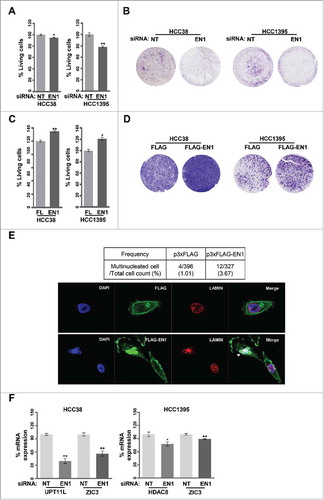
Figure 4. (Continued).
To identify the transcriptional gene signature driven by EN1 activity, HCC38 cells were transfected with either EN1 or control siRNA, and the resulting gene expression patterns were assessed via microarray analysis. Raw microarray data were normalized and the odds ratio for each EN1/control siRNA pair was calculated. Comparison of the gene expression profiles of EN1-silenced and control cells revealed no significant variation (Supplementary Figure S7E). Nevertheless, using a strict statistical criterion (P < 0.01), we selected and categorized 14 genes, including EN1, as part of the EN1-driven transcriptional gene signature (Supplementary Figure S7F). Of these, we selected HDAC8, UPT11L, and ZIC3 for further analysis, as they were previously reported to be involved in tumorigenicity.Citation19-Citation22 Downregulation of HDAC8, UTP11L, and ZIC3 was subsequently confirmed in EN1-depleted cells by qRT-PCR (). Thus, EN1 may promote QNBC cell proliferation and/or survival via the transcriptional upregulation of HDAC8, UTP11L, and ZIC3.
Furthermore, Nardo et al. suggested that En1 translation in mouse primary midbrain neurons involves the cytoplasmic polyadenylation element binding protein and mTOR pathways.Citation23 Thus, in the present study, we investigated the effects of pharmacologically inhibiting EN1 function on breast cancer cells by treating HCC38 cells with actinomycin D (known to inhibit the activation of cytoplasmic polyadenylation element binding protein-mediated translation) and/or rapamycin or everolimus (known mTOR inhibitors). The results showed that HCC38 cells were resistant to rapamycin and everolimus treatment, as indicated by the generation of IC50 values greater than 1.275 μM (Supplementary Figure S7G). In contrast, actinomycin D treatment induced a marked response in HCC38 cells characterized by an IC50 value of 1.062 nM (Supplementary Figure S7G). Specifically, actinomycin D treatment inhibited HCC38 cell viability and promoted apoptosis by downregulating EN1 mRNA expression compared to in DMSO-treated control cells, although HPRT mRNA expression was also decreased in response to actinomycin D treatment ().
Discussion
In the present study, we assessed the clinical implications of EN1 expression in TNBC, BLBC, and QNBC and evaluated the functional roles of EN1 expression in a QNBC cell line. In mice, En1 is highly expressed by all mesodiencephalic dopaminergic neurons, initiating at differentiation and persisting continuously into adulthood.Citation24 In humans, EN1 acts as a bifunctional homeodomain transcription factor during the development of midbrain dopaminergic neurons.Citation13 Zheng et al. identified EN1 as a critical determinant of bone mineral density and fracture via whole genome sequencing analysis of both 2882 human samples and an En1cre/flox mouse model.Citation25
EN1 has been suggested to be a predictor of poor prognosis for patients with salivary gland adenoid cystic carcinomaCitation26; in fact, EN1 was also recently identified as a transcription factor that mediates MYB-driven regulatory mechanisms in adenoid cystic carcinoma via chromatin immunoprecipitation-sequencing.Citation27 MYB acts as a master transcriptional regulator of cellular differentiation and proliferation and functions as an oncogenic factor in various cancers, including breast cancer.Citation27,Citation28 In addition, the EN1 paralog EN2 was previously proposed as a biomarker of non-muscle-invasive bladder and prostate cancer,Citation29,Citation30 and has been identified as an oncogene in breast cancer.Citation31 Interestingly, Beltran et al. reported that EN1 is highly overexpressed in BLBC tumors and that its overexpression likely activates pro-survival pathways.Citation15 Together, these data suggest that EN1 promotes tumorigenesis and disease progression in various cancers, including breast cancer. In the present study, patients with TNBC exhibited a high level of molecular heterogeneity according to massively parallel sequencing and genomic technology results. A recent study by Prat et al. classified 78.6%, 7.8%, 6.6%, and 7.5% of 412 analyzed TNBC tumors as BLBC, HER2, luminal A or B, and normal-like, respectively, according to PAM50 cancer subtypes.Citation32 Similarly, Lehmann et al. divided 587 TNBC cases into six subtype classes comprising two basal-like (BL1 and BL2), an immunomodulatory (IM), a mesenchymal (M), a mesenchymal stem-like (MSL), and a luminal androgen receptor (LAR) class via cluster analysis of their gene expression profiles.Citation33 Curtis et al. categorized 2000 breast tumors into ten subgroups through integrative analysis of combined copy number and gene expression data and found that the BLBC samples were distributed equally among the various subgroups.Citation34 Based on two reports by Rakha et al., we previously assessed variation between BLBC and QNBC prognostic markers and showed that QNBC is generally associated with a poorer survival rate, likely because of the lower response rate of QNBC cells to chemotherapy.Citation3-Citation5
In the present study, we evaluated the prognostic value of EN1 expression for patient survival in TNBC, BLBC, and QNBC, although more diverse subtypes of TNBC exist. In the analyzed TNBC cohort, nuclear EN1 expression was not significantly associated with a lower OS, while cytoplasmic EN1 expression showed a higher OS rate with borderline significance. These findings suggest that EN1 exerts different effects on patient survival according to its localization. We confirmed this result by analyzing other cohorts and found that higher EN1 mRNA expression showed a trend towards to association with both a lower and higher OS rate in a TCGA and alternative public microarray dataset, respectively. This discrepancy may reflect variations in the distribution of EN1 between the nucleus and cytoplasm in these cohorts. Interestingly, both nuclear and cytoplasmic EN1 expression showed an inverse trend that a higher and lower OS in patients with BLBC and QNBC, respectively, suggesting that EN1 activity has different implications for the clinical outcome of patients with BLBC versus QNBC. These data emphasize the need for continued investigation into the function of EN1 in the nucleus and cytoplasm and the clinical implications of EN1 activity for the survival of patients with various reported TNBC subtypes.
The conducted EN1 depletion and overexpression experiments revealed that EN1 promoted proliferation, migration, and multinucleation of QNBC cells. Multinucleated cancer cells are known to exist as a rare population in various cancer cell lines and tissues, and have been shown to be associated with disease aggressiveness and poor patient prognosis.Citation35,Citation36 Previous reports suggested that multinucleated cancer cells undergo programmed growth arrest at the G1 phase in a similar manner to senescent cells, and that they exhibit dormant growth in response to stress.Citation37-Citation40 In the present study, EN1-overexpressing cells were not induced to exhibit either polyploidy or G1-arrest in comparison to control cells; thus, the results showing an increased incidence of multinucleation requires confirmation in an enriched system of overexpressing cells where the basal multinucleated cell population is larger.
The present study also showed that HDAC8, UTP11L, and ZIC3 were transcriptionally activated by EN1. Downregulation of histone deacetylase 8 (HDAC8) decreased the tumorigenicity of breast cancer cells.Citation41 By assessing the effects of treating Ewing sarcoma cells with the survivin-targeting agent YM155, a previous study suggested that UTP11L is a downstream regulator of the survivin apoptosis inhibition pathway.Citation19 ZIC3 is a member of the human zinc finger of the cerebellum (ZIC) family and is highly expressed in several tumor types, including meningiomas as well as lung and gastric cancers.Citation20-Citation22 Interestingly, ZIC3 has been reported as a candidate TNBC signature gene based on the analysis of seven different breast cancer whole-genome gene expression cohorts.Citation42 The role of EN1 in regulating HDAC8, UTP11L, and ZIC3 in QNBC requires further investigation.
Chemotherapy for TNBC has been shown to be effective in an adjuvant, neoadjuvant, and metastatic settings.Citation43,Citation44 Currently, no molecular therapeutic targets are available for the treatment of TNBC, and patients experience a poor survival rate; nevertheless, patients with TNBC exhibit a higher average response to chemotherapy than those with other breast cancer subtypes.Citation45 In the present study, we conducted a literature review of previously published in vitro studies of EN1 inhibition using cytotoxic anti-cancer drugs and assessed the effect of using actinomycin D to inhibit EN1 activity on the viability of a QNBC cell line.Citation23 We found that actinomycin D treatment exerted an inhibitory effect on cell viability and promoted apoptosis by inducing EN1 downregulation in HCC38 cells. This suggests that actinomycin D is a promising therapeutic target for the treatment of QNBC.
In conclusion, our findings suggest that EN1 activity is clinically relevant to survival in patients with QNBC; furthermore, EN1 is a promising potential therapeutic target for future QNBC treatments.
Materials and methods
Human breast tumor microarray data sets
To examine TNBC-specific gene expression features, we used the same data sets and analyses as in our previous study.Citation46 Briefly, a total of 1300 cases were combined into a large data set, and their raw data were normalized using the robust multi-array analysis algorithm. Intrinsic subtype classification was based on the corresponding results of immunoexpression and mRNA expression analyses of ER, PR, and HER2.
Patient tissue samples, microarrays (TMA), and definition of TNBC subtypes
A total of 199 patients with TNBC from the retrospective 'Samsung Medical Center Breast Cancer Biomarker Study (SMC-BCBS)Citation3 cohort were enrolled in the present study. The protocol for the present study was approved by the Samsung Medical Center Institutional Review Board (IRB file No. 2008-12-035). Tumor size and lymph-node involvement were evaluated according to the American Joint Committee on Cancer 6th TNM Staging System, and tumor histological grades were determined according to the Bloom-Richardson grading scheme. Paraffin-embedded TNBC tissue samples (mounted on slides) were analyzed to define tumor regions and select representative tumor areas for further analysis. These selected regions were punched out into thin sections using a TMA tool (ISU ABXIS). A trephine apparatus was then used to array selected representative tumor cores in a new paraffin block. To divide TNBC subtypes, an immunohistochemical assay was performed using basal markers (CK5/6 or EGFR).Citation3 TNBC expressing either CK5/6 or EGFR was defined as BLBC, while TNBC expressing neither CK5/6 nor EGFR was defined as QNBC. BLBC and QNBC accounted for 61.3% (122/199) and 38.7% (77/199) of the subtypes, respectively.
Cell culture and paraffin-block embedding
Human breast-cancer cell lines were obtained from the American Type Culture Collection and Korean Cell Line Bank. All cell lines were cultured according to the manufacturer's recommendations. All cells were screened for Mycoplasma contamination using a PCR-based detection method, and any identified contamination was eradicated using BM cyclins (Roche). Agarose pellets of human breast-cancer cell lines were embedded in a paraffin block.
EN1 antibody generation, immunohistochemistry, and immunocytochemistry
Synthetic peptides corresponding to the EN1 candidate regions 27, 28, and 29 (Supplementary Figure S2) were conjugated to keyhole limpet hemocyanin. The conjugated peptides (AbClon, Inc., Seoul, Korea) were then injected into a rabbit and processed according to the manufacturer's instructions. After heat-induced antigen retrieval, slides displaying TMA or cell-block sections were stained with the generated primary EN1 (#27–29, 1:200), CK5/6 (1:100, Dako), and EGFR (1:30, Novocastra) antibodies and labeled with horseradish peroxidase (Dako). In immunohistochemical analysis, the criteria for cytoplasmic versus nuclear staining intensity were essentially the same. Zero denotes essentially no to very little staining, and was categorized as negative. Weak, moderate, and strong staining were defined as positive.
Quantitative reverse transcription-PCR (qRT-PCR)
Total RNA was isolated from cells using the RNeasy mini kit (Qiagen). cDNAs were synthesized using Superscript III Transcriptase (Invitrogen, Carlsbad, CA, USA) according to the manufacturer's instructions. qRT-PCR amplification of EN1, HDAC8, UTP11L, and ZIC3 was conducted using primers (Supplementary Table S3). HPRT was used as a reference gene, and quantification of gene mRNA expression was determined by the ratio of the calculated gene expression to HPRT expression.
Western blot analysis
Cells were lysed with RIPA buffer (20 mM Tris-HCl (pH 8.0), 150 mM NaCl, 10% glycerol, 1% NP40, and 2 mM EDTA). Equal amounts of protein were subjected to 10% SDS-PAGE before being transferred to a nitrocellulose membrane (Millipore, Billerica, MA, USA). The membrane was incubated (overnight, 4°C) with primary anti-EN1 (#27, #28, and #29, AbClon) and β-actin (Santa Cruz Biotechnology) antibodies and then washed (30 min) with TBST. The membrane was then incubated (1 h) with horseradish peroxidase-conjugated secondary goat anti-rabbit or anti-mouse antibodies (diluted 1:2,000 in 5% non-fat milk) before being washed again (30 min) with TBST. Signals were detected using an ECL solution (iNtRON Biotechnology).
Drug treatment, siRNA knockdown, and cell proliferation/migration assays
Actinomycin D (Sigma) was reconstituted (1 mM) in DMSO and used at the corresponding 1 nM IC50 value. EN1 and non-targeting (NT) SMART-pool siRNAs were obtained from Santa Cruz Biotechnology (SC-43752). Briefly, 2 × 10⁵ cells were transfected with siRNA (at a final concentration of 20 nmol) for 48 h using siLentFect (Bio-Rad). The effect of gene silencing on cell proliferation was measured using a WST-1 assay kit (Daeil Lab Service) according to the manufacturer's instructions. Cell motility was quantified via a Transwell insert assay (Corning, Inc.). All assays were performed in triplicate, and data were presented as the mean ± standard error. P-values were calculated using a student's t-test.
Immunofluorescence
Briefly, HCC38 cells over-expressing 3XFLAG or 3XFLAG-EN1 (5 × 10³ cells) were seeded on cover slips and fixed with 5% formaldehyde in PBS before being washed with 0.1% TX-100 in PBS. The cells were then blocked with 3% non-fat milk in 0.1% TX-100 in PBS, incubated (overnight, 4°C) with an anti-EN1 primary antibody (#27, AbClon), and washed (30 min) with 0.1% TX-100 in PBS. The cells were then incubated (1 h, room temperature) with a secondary anti-rabbit Alexa 488 antibody (1:2000, Life Technologies) and washed again (30 min) with 0.1% TX-100 in PBS. The cover slips were then placed on glass slides with the cells facing down, and the cells were covered with Vectashield mounting medium containing DAPI (Vector Laboratories). The cover slips were sealed with transparent nail polish, and excess mounting medium was removed using filter paper.
Microarray analysis of EN1 depleted HCC38 cells
Total RNA from siRNA-treated and parental HCC38 cells was isolated using an RNeasy mini kit (Qiagen). Total RNA was used to synthesize complementary RNA that was then biotin-labeled (Agilent Technologies) according to the manufacturer's instructions. The biotin-labeled complementary RNA was processed using the Agilent SurePrint G3 Human Gene Expression v2 8 × 60K Microarray Kit, which contains oligonucleotide probes for more than 50,599 RNA transcripts. CEL files were analyzed using Agilent GeneSpring GX12.6 software to calculate fold-changes and P values according to the Significance Analysis of Microarrays algorithm for each analyzed gene in EN1 knockdown versus non-targeting control siRNA-treated and parental HCC38 cells on each background. Gene expression fold-changes greater than two and P values ≤ 0.001 were considered to indicate differential expression and statistical significance, respectively.
Apoptosis assay
Cell apoptosis was determined using the FITC Annexin V Apoptosis Detection Kit I (BD Biosciences) following treatment with 1 µM of staurosporine (STS) (Sigma-Aldrich). Cell apoptosis was analyzed with a FACS Aria (BD Biosciences).
Statistical analyses
A chi-squared test was used to analyze the differences in the frequencies of basic patient characteristics and clinical parameters. Overall (OS) and event-free survival (EFS) curves were constructed using the Kaplan-Meier method, and then compared using a log-rank test. All P-values are representative of two-sided significance tests, and P-values less than 0.05 were considered to indicate statistical significance. All statistical analyses were performed using SPSS version 16.0 software (SPSS, Inc.).
Disclosure of potential conflicts of interest
No potential conflicts of interest were disclosed.
Author's contributions
Conception and design: Yu Jin Kim, Ensel Oh, and Yoon-La Choi
Analysis and interpretation: Yu Jin Kim, Minjung Sung, Ensel Oh, Michael Van Vrancken, Kyungsoo Jung, and Yoon-La Choi
Data Collection: Yu Jin Kim, Minjung Sung, Michael Van Vrancken, Ji-Young Song, and Kyungsoo Jung
Manuscript preparation: Yu Jin Kim
Final approval of the manuscript: Yoon-La Choi
Competing interests
The authors declare that they have no competing interests.
Supp_mat_1423913_KCBT.docx
Download MS Word (22.4 KB)Acknowledgments
We would like to thank Dr. Jinkuk Kim (Samsung Advanced Institute of Technology, Samsung Electronics Co. Ltd.) and Dr. Je-Gun Joung (Samsung Genome Institute, Samsung Medical Center) for providing valuable advice.
Additional information
Funding
References
- Goldhirsch A, Wood WC, Coates AS, Gelber RD, Thurlimann B, Senn HJ. Strategies for subtypes–dealing with the diversity of breast cancer: highlights of the St. Gallen International Expert Consensus on the Primary Therapy of Early Breast Cancer 2011. Ann Oncol. 2011;22:1736–47. doi:10.1093/annonc/mdr304.
- Kaufmann M, Pusztai L. Use of standard markers and incorporation of molecular markers into breast cancer therapy: Consensus recommendations from an International Expert Panel. Cancer. 2011;117:1575–82. doi:10.1002/cncr.25660.
- Choi YL, Oh E, Park S, Kim Y, Park YH, Song K, Cho EY, Hong YC, Choi JS, Lee JE, et al. Triple-negative, basal-like, and quintuple-negative breast cancers: better prediction model for survival. BMC Cancer. 2010;10:507. doi:10.1186/1471-2407-10-507.
- Rakha EA, El-Sayed ME, Green AR, Lee AH, Robertson JF, Ellis IO. Prognostic markers in triple-negative breast cancer. Cancer. 2007;109:25–32. doi:10.1002/cncr.22381.
- Rakha EA, Elsheikh SE, Aleskandarany MA, Habashi HO, Green AR, Powe DG, El-Sayed ME, Benhasouna A, Brunet JS, Akslen LA, et al. Triple-negative breast cancer: distinguishing between basal and nonbasal subtypes. Clin Cancer Res. 2009;15:2302–10. doi:10.1158/1078-0432.CCR-08-2132.
- Sorlie T, Tibshirani R, Parker J, Hastie T, Marron JS, Nobel A, Deng S, Johnsen H, Pesich R, Geisler S, et al. Repeated observation of breast tumor subtypes in independent gene expression data sets. Proc Natl Acad Sci U S A. 2003;100:8418–23. doi:10.1073/pnas.0932692100.
- Nielsen TO, Hsu FD, Jensen K, Cheang M, Karaca G, Hu Z, Hernandez-Boussard T, Livasy C, Cowan D, Dressler L, et al. Immunohistochemical and clinical characterization of the basal-like subtype of invasive breast carcinoma. Clin Cancer Res. 2004;10:5367–74. doi:10.1158/1078-0432.CCR-04-0220.
- Comprehensive molecular portraits of human breast tumours. Nature. 2012;490:61–70. doi:10.1038/nature11412.
- Comprehensive genomic characterization of squamous cell lung cancers. Nature. 2012;489:519–25. doi:10.1038/nature11404.
- Doyle LA, Vivero M, Fletcher CD, Mertens F, Hornick JL. Nuclear expression of STAT6 distinguishes solitary fibrous tumor from histologic mimics. Mod Pathol. 2014;27:390–5. doi:10.1038/modpathol.2013.164.
- Comprehensive molecular characterization of human colon and rectal cancer. Nature. 2012;487:330–7. doi:10.1038/nature11252.
- Alvarez-Fischer D, Fuchs J, Castagner F, Stettler O, Massiani-Beaudoin O, Moya KL, Bouillot C, Oertel WH, Lombès A, Faigle W, et al. Engrailed protects mouse midbrain dopaminergic neurons against mitochondrial complex I insults. Nat Neurosci. 2011;14:1260–6. doi:10.1038/nn.2916.
- Alves dos Santos MT, Smidt MP. En1 and Wnt signaling in midbrain dopaminergic neuronal development. Neural Dev. 2011;6:23. doi:10.1186/1749-8104-6-23.
- Prat A, Parker JS, Karginova O, Fan C, Livasy C, Herschkowitz JI, He X, Perou CM, et al. Phenotypic and molecular characterization of the claudin-low intrinsic subtype of breast cancer. Breast Cancer Res. 2010;12:R68. doi:10.1186/bcr2635.
- Beltran AS, Graves LM, Blancafort P. Novel role of Engrailed 1 as a prosurvival transcription factor in basal-like breast cancer and engineering of interference peptides block its oncogenic function. Oncogene. 2014;33:4767–77. doi:10.1038/onc.2013.422.
- Gyorffy B, Lanczky A, Eklund AC, Denkert C, Budczies J, Li Q, Szallasi Z., et al. An online survival analysis tool to rapidly assess the effect of 22,277 genes on breast cancer prognosis using microarray data of 1,809 patients. Breast Cancer Res Treat. 2010;123:725–31. doi:10.1007/s10549-009-0674-9.
- Karn T, Pusztai L, Holtrich U, Iwamoto T, Shiang CY, Schmidt M, Müller V, Solbach C, Gaetje R, Hanker L, et al. Homogeneous datasets of triple negative breast cancers enable the identification of novel prognostic and predictive signatures. PLoS One. 2011;6:e28403. doi:10.1371/journal.pone.0028403.
- Kao J, Salari K, Bocanegra M, Choi YL, Girard L, Gandhi J, Kwei KA, Hernandez-Boussard T, Wang P, Gazdar AF, et al. Molecular profiling of breast cancer cell lines defines relevant tumor models and provides a resource for cancer gene discovery. PLoS One. 2009;4:e6146. doi:10.1371/journal.pone.0006146.
- Tao YF, Lu J, Du XJ, Sun LC, Zhao X, Peng L, Cao L, Xiao PF, Pang L, Wu D, et al. Survivin selective inhibitor YM155 induce apoptosis in SK-NEP-1 Wilms tumor cells. BMC Cancer. 2012;12:619. doi:10.1186/1471-2407-12-619.
- Aruga J, Nozaki Y, Hatayama M, Odaka YS, Yokota N. Expression of ZIC family genes in meningiomas and other brain tumors. BMC Cancer. 2010;10:79. doi:10.1186/1471-2407-10-79.
- Yang B, Jia L, Guo Q, Ren H, Hu D, Zhou X, Ren Q, Hu Y, Xie T. MiR-564 functions as a tumor suppressor in human lung cancer by targeting ZIC3. Biochem Biophys Res Commun. 2015;467:690–6. doi:10.1016/j.bbrc.2015.10.082.
- Ma G, Dai W, Sang A, Yang X, Li Q. Roles of ZIC family genes in human gastric cancer. Int J Mol Med. 2016;38:259–66. doi:10.3892/ijmm.2016.2587.
- Di Nardo AA, Nedelec S, Trembleau A, Volovitch M, Prochiantz A, Montesinos ML. Dendritic localization and activity-dependent translation of Engrailed1 transcription factor. Mol Cell Neurosci. 2007;35:230–6. doi:10.1016/j.mcn.2007.02.015.
- Simon HH, Saueressig H, Wurst W, Goulding MD, O'Leary DD. Fate of midbrain dopaminergic neurons controlled by the engrailed genes. J Neurosci. 2001;21:3126–34.
- Zheng HF, Forgetta V, Hsu YH, Estrada K, Rosello-Diez A, Leo PJ, Dahia CL, Park-Min KH, Tobias JH, Kooperberg C, et al. Whole-genome sequencing identifies EN1 as a determinant of bone density and fracture. Nature. 2015;526:112–7. doi:10.1038/nature14878.
- Bell D, Bell A, Roberts D, Weber RS, El-Naggar AK. Developmental transcription factor EN1–a novel biomarker in human salivary gland adenoid cystic carcinoma. Cancer. 2012;118:1288–92. doi:10.1002/cncr.26412.
- Drier Y, Cotton MJ, Williamson KE, Gillespie SM, Ryan RJ, Kluk MJ, Carey CD, Rodig SJ, Sholl LM, Afrogheh AH, et al. An oncogenic MYB feedback loop drives alternate cell fates in adenoid cystic carcinoma. Nat Genet. 2016;48:265–72. doi:10.1038/ng.3502.
- Ramsay RG, Gonda TJ. MYB function in normal and cancer cells. Nat Rev Cancer. 2008;8:523–34. doi:10.1038/nrc2439.
- Morgan R, Bryan RT, Javed S, Launchbury F, Zeegers MP, Cheng KK, James ND, Wallace DM, Hurst CD, Ward DG, et al. Expression of Engrailed-2 (EN2) protein in bladder cancer and its potential utility as a urinary diagnostic biomarker. Eur J Cancer. 2013;49:2214–22. doi:10.1016/j.ejca.2013.01.019.
- Marszall MP, Sroka W, Adamowski M, Slupski P, Jarzemski P, Siodmiak J, Odrowąż-Sypniewska G.. Engrailed-2 protein as a potential urinary prostate cancer biomarker: a comparison study before and after digital rectal examination. Eur J Cancer Prev. 2015;24:51–6. doi:10.1097/CEJ.0000000000000046.
- Martin NL, Saba-El-Leil MK, Sadekova S, Meloche S, Sauvageau G. EN2 is a candidate oncogene in human breast cancer. Oncogene. 2005;24:6890–901. doi:10.1038/sj.onc.1208840.
- Prat A, Adamo B, Cheang MC, Anders CK, Carey LA, Perou CM. Molecular characterization of basal-like and non-basal-like triple-negative breast cancer. Oncologist. 2013;18:123–33. doi:10.1634/theoncologist.2012-0397.
- Lehmann BD, Bauer JA, Chen X, Sanders ME, Chakravarthy AB, Shyr Y, Pietenpol JA. Identification of human triple-negative breast cancer subtypes and preclinical models for selection of targeted therapies. J Clin Invest. 2011;121:2750–67. doi:10.1172/JCI45014.
- Curtis C, Shah SP, Chin SF, Turashvili G, Rueda OM, Dunning MJ, Speed D, Lynch AG, Samarajiwa S, Yuan Y, et al. The genomic and transcriptomic architecture of 2,000 breast tumours reveals novel subgroups. Nature. 2012;486:346–52.
- Weihua Z, Lin Q, Ramoth AJ, Fan D, Fidler IJ. Formation of solid tumors by a single multinucleated cancer cell. Cancer. 2011;117:4092–9. doi:10.1002/cncr.26021.
- Staelens L, Van Poppel H, Vanuytsel L, Van Oosterom A, Van Damme B, Baert L. Sarcomatoid renal cell carcinoma: case report and review of the literature. Acta Urol Belg. 1997;65:39–42.
- Hayflick L, Moorhead PS. The serial cultivation of human diploid cell strains. Exp Cell Res. 1961;25:585–621. doi:10.1016/0014-4827(61)90192-6.
- Dimri GP, Lee X, Basile G, Acosta M, Scott G, Roskelley C, Medrano EE, Linskens M, Rubelj I, Pereira-Smith O, et al. A biomarker that identifies senescent human cells in culture and in aging skin in vivo. Proc Natl Acad Sci U S A. 1995;92:9363–7. doi:10.1073/pnas.92.20.9363.
- Blagosklonny MV. Cancer stem cell and cancer stemloids: from biology to therapy. Cancer Biol Ther. 2007;6:1684–90. doi:10.4161/cbt.6.11.5167.
- Zhang S, Mercado-Uribe I, Xing Z, Sun B, Kuang J, Liu J. Generation of cancer stem-like cells through the formation of polyploid giant cancer cells. Oncogene. 2014;33:116–28. doi:10.1038/onc.2013.96.
- Chao MW, Chu PC, Chuang HC, Shen FH, Chou CC, Hsu EC, Himmel LE, Huang HL, Tu HJ, Kulp SK, et al. Non-epigenetic function of HDAC8 in regulating breast cancer stem cells by maintaining Notch1 protein stability. Oncotarget. 2016;7:1796–807. doi:10.18632/oncotarget.6427.
- Willis S, De P, Dey N, Long B, Young B, Sparano JA, Wang V, Davidson NE, Leyland-Jones BR. Enriched transcription factor signatures in triple negative breast cancer indicates possible targeted therapies with existing drugs. Meta Gene. 2015;4:129–41. doi:10.1016/j.mgene.2015.04.002.
- Peto R, Davies C, Godwin J, Gray R, Pan HC, Clarke M, Cutter D, Darby S, McGale P, Taylor C, et al. Comparisons between different polychemotherapy regimens for early breast cancer: meta-analyses of long-term outcome among 100,000 women in 123 randomised trials. Lancet. 2012;379:432–44. doi:10.1016/S0140-6736(11)61625-5.
- Cortazar P, Zhang L, Untch M, Mehta K, Costantino JP, Wolmark N, Bonnefoi H, Cameron D, Gianni L, Valagussa P, et al. Pathological complete response and long-term clinical benefit in breast cancer: the CTNeoBC pooled analysis. Lancet. 2014;384:164–72. doi:10.1016/S0140-6736(13)62422-8.
- Carey LA, Dees EC, Sawyer L, Gatti L, Moore DT, Collichio F, Ollila DW, Sartor CI, Graham ML, Perou CM.. The triple negative paradox: primary tumor chemosensitivity of breast cancer subtypes. Clin Cancer Res. 2007;13:2329–34. doi:10.1158/1078-0432.CCR-06-1109.
- Oh E, Choi YL, Park T, Lee S, Nam SJ, Shin YK. A prognostic model for lymph node-negative breast cancer patients based on the integration of proliferation and immunity. Breast Cancer Res Treat. 2012;132:499–509. doi:10.1007/s10549-011-1626-8.