
 ?Mathematical formulae have been encoded as MathML and are displayed in this HTML version using MathJax in order to improve their display. Uncheck the box to turn MathJax off. This feature requires Javascript. Click on a formula to zoom.
ABSTRACT
We aimed at investigating effects of long non-coding RNA maternally expressed 3 (MEG3) on the proliferation, cell cycle and apoptosis of bladder urothelial carcinoma cells and regulatory relationships among lncRNA MEG3, miR-96 and α-tropomyosin 1 (TPM1). Human clinical data from The Cancer Genome Atlas (TCGA) which contains bladder urothelial carcinoma tissues and adjacent tissues were used for analysis. The expression profiles of MEG3, miR-96, TPM1, cell cycle-related genes and apoptosis-related genes were examined by real-time quantitative polymerase chain reaction (RT-qPCR) and western blot. Regulating relationship among MEG3, miR-96 and TPM1 was confirmed by dual luciferase reporter assay. MTT assay and flow cytometry were performed to observe cell proliferation, cell cycle and apoptosis. The effects of lncRNA MEG3 on bladder urothelial carcinoma were confirmed both in vivo and in vitro. The mRNA expression and protein expression of MEG3, TPM1 were down-regulated in carcinoma tissues, whereas miR-96 expression was up-regulated. MEG3 overexpression resulted in miR-96 downregulation along with TPM1 upregulation, which inhibited cell proliferation and cell cycle but promoted cell apoptosis of bladder urothelial carcinoma cells in vitro, and at the same time inhibited tumor growth in vivo. In this process, expressions of apoptosis-related protein BCL2 associated X (Bax), cleaved-caspase 3 was up-regulated, whereas apoptosis regulator protein (Bcl-2) expression was suppressed when MEG3 was overexpressed, and cell cycle-related protein Cyclin D1 was down-regulated. LncRNA MEG3 low-expression promotes the proliferation and inhibits apoptosis of bladder urothelial carcinoma cells by regulating miR-96 along with TPM1.
Introduction
As the most prevalent urogenital malignancies worldwide, bladder cancer (BC), which numerously results from the excessive growth of the bladder mucous membrane epithelial cells, has high incidence and low 5-year survival rate.Citation1,Citation2 76, 960 new cases (4.6% of all new cancer cases) and 16, 390 deaths of bladder cancer were estimated in the United States during 2016.Citation3 Among them, 70% of BCs were non-muscle-invasive BCs and the remaining 30% were muscle-invasive BCs.Citation4,Citation5 Despite advances in surgical techniques and treatments, the prognosis of BC remains dismal.Citation6 There is a high frequency of tumor recurrence after bladder preservation therapy, with a 5-year survival rate of < 50%. There were several known BC driver genes, such as ARID1A, BYR2, FGFR3, FAT1, TP53 and FMN1.Citation2 In our study, some dysregulated genes were screened, which might be new drivers for BC. Further, the molecular mechanisms of them were also investigated to discover the underlying carcinogenic mechanism.
Long non-coding RNAs (lncRNAs) are a class of transcripts with more than 200 nucleotides and limited or no protein coding capacity, which might involve in tumorigenesis via tumorigenic or tumor-suppressing pathways.Citation7 One of the aberrantly expressed lncRNAs in BC is lncRNA maternally expressed 3(MEG3), which is suppressed in many cancer tissues and cell lines.Citation8,Citation9 Particularly, the lncRNA MEG3 has been shown the function as a tumor suppressor and inhibits cell proliferation in a number of human cancer cell lines.Citation10–Citation12 It was reported that MEG3 could also be the diagnosis and recurrence prediction of bladder cancer.Citation13 Although the mechanism of this is unclear, MEG3 has been shown to inhibit cell proliferation by both activating of tumor protein p53 and targeting the TGF-β pathway through direct chromatin interactions.Citation14,Citation15
MiRNAs are single-stranded RNA molecules of about 20–23 nucleotides length, which suppresses the expression of the protein-coding genes by binding directly to their target mRNAs.Citation16 More and more experimental data have proved that miRNAs can affect all molecular processes that have been linked to cancer, including evasion of apoptosis and development of chemoresistance.Citation17 MiR-96 has been reported to accelerate transitional cell carcinoma (TCC), a histopathological type of bladder cancer, by regulating forkhead box O1 (FOXO1)-mediated cell apoptosis.Citation18 Genome-wide miRNA expression profile has identified miR-96 as an upregulated one and increased invasion and differentiation of human bladder T24 cells.Citation19 MiR-96 may act as a promising diagnostic marker in human bladder urothelial carcinomas and correlated with prognosis statistics.Citation20 Therefore, this paper intended to investigate the role of miR-96 in bladder urothelial carcinoma.
Tropomyosin (TPM), a multigene family of actin binding proteins, can act as cellular transformation suppressors.Citation21 TPM1, which encodes α-tropomyosin 1, is a sarcomere myofilament that mediates both stabilization of thin filaments and the interaction between actin and myosin.Citation22 Previous studies showed that TPM1 expression was associated with tumor size, smoking status, Fuhrman grade and the prognosis of renal cell carcinoma (RCC) patients.Citation23 It was also proposed to be a crucial tumor suppressor, which exhibited a low expression level in many solid tumors.Citation24,Citation25 However, TPM1 exon 6a was found exclusively included in the prostate cancer samples but preferentially included in bladder cancer samples, which enlightened us a possible controversy of its role.Citation26 Therefore, this study investigated a TPM1 network to explore its specific function in BC.
In this study, we would like to investigate the molecular mechanisms of MEG3 in BC. LncRNA/miRNA/mRNA network was candidate mechanism to explain the influence of lncRNA on cancer progression. We drew a hypothesis that MEG3 had an effect on BC in that way. However, few investigations on BC were involved in lncRNA/miRNA/mRNA network. Hence, we would like to discuss the regulation network of lncRNA MEG3/miR-96/TPM1 and their influences on cell growth through both in vivo and in vitro experiments.
Materials and methods
Samples
45 bladder cancer tissues and 45 adjacent tissues (the distance far from the tumor tissues > 2 cm) were collected from patients who had surgical treatment in the Peking Union Medical College Hospital from March 2015 to December 2016 and the cancer staging classified by TNM staging system,Citation27 aging and gender of patients were shown in Supplementary Table S1. All patients received no radiation or chemotherapy in advance of transurethral resection and their informed consent had been obtained. All specimens were confirmed by pathological examination, and the usage was approved by the medical ethics committee of the Peking Union Medical College Hospital.
Cell culture
Bladder urothelial carcinoma cell line 5637, cell line RT4, cell line RT-112, cell line T-24 and the normal bladder epithelial cell line SV-HUC-1 were purchased from the BeNa Culture Collection (Beijing, China). Cell line 5637 was cultured in 90% RPMI-1640 medium containing 1.5 g/L NaHCO3, 2.5 g/L glucose and 0.11 g/L sodium pyruvate and 10% fetal bovine serum; Cell line RT4 was cultured in 90% RPMI-1640 and 10% fetal bovine serum; Cell line RT-112 was cultured in Dulbecco’s modified Eagle’s medium (DMEM) containing 10% fetal calf serum and 2 mmol/L glutamine; Cell line T-24 was cultured in 90% RPMI-1640 medium containing 2 mML glucose and 10% fetal bovine serum. All cell lines were cultured under 37 °C, 5% CO2.
Bioinformatics analysis
LncRNA and miRNA expression profiles and relevant clinical information of 19 tumor tissues and 19 normal tissues from The Cancer Genome Atlas (TCGA, https://cancergenome.nih.gov) were used to find differently expressed lncRNAs and miRNAs (P < 0.05 and |log2(fold change)|> 1). MRNA expression profiles and relevant clinical information of 18 tumor tissues and 18 normal tissues from TCGA were analyzed to obtain differently expressed mRNA with the same screening criteria. MiRcode (www.mircode.org) and TargetScan (http://www.targetscan.org/vert_71/) were applied to predict the binding site between lncRNA, mRNA and miRNA. MiRcode was a free website for transcriptome-wide miRNA target prediction including lncRNAs and could present the binding site between lncRNA and miRNA. TargetScan was also a free site for prediction of miRNA targets, which provided the binding site between miRNA and mRNA after import lncRNA, mRNA or miRNA.
Real-time quantitative polymerase chain reaction (rt-qpcr)
Total RNA extraction from tissue samples and cells were performed using Trizol (Invitrogen, CA, USA) reagent. The purity of RNA was examined by NanoDrop spectrophotometer 2000 (Thermo Fisher Scientific, MA, USA). Reverse transcription of the lncRNA and miRNA was performed by PrimeScript™ RT reagent Kit (TaKaRa, Tokyo, Japan) using 2 μg of total RNA. RT-qPCR was performed on the ABI 7300 Thermocycler (Thermo Fisher Scientific, MA, USA) using SYBR Premix Ex Taq kit (Thermo Fisher Scientific, MA, USA).
The reactions were subjected to a preincubation step of 94°C for 3 min, followed by 35 cycles of 94°C for 10 s, 55°C for 15s and 72°C for 30 s. The relative expression of lncRNA, miRNA, mRNA from tissue samples was calculated using the method and normalized with U6 or GAPDH as the reference control. Primers were synthesized by Sangon Biotech (Shanghai, China) and the sequences were showed in .
Table 1. Primers sequences.
Cell transfection
Cells were seeded onto 6-well plates 24 h prior to oligonucleotide transfections with Lipofectamine 2000 reagents (Invitrogen, CA, USA) according to the manufacturer’s protocol. They were then transfected with miR-96 mimics, miR-96 inhibitor and control (GenePharma Company, Shanghai, China) and pcDNA3.1-TPM1, pcDNA3.1-MEG3 and pcDNA3.1 (Invitrogen, Shanghai, China) by FuGENE HD Transfection Reagent (Promega, WI, USA) following the manufacturer’s protocol. The divided experimental groups were as follows: pcDNA3.1-NC, pcDNA3.1-MEG3; NC, miR-96 mimics, miR-96 inhibitor, pcDNA3.1-MEG3, pcDNA3.1-MEG3+ miR-96 mimics; NC, miR-96 mimics, pcDNA3.1-TPM1, pcDNA3.1-TPM1+ miR-96 mimics.
Dual luciferase array
MEG3 and TPM1 target region which includes the binding site of MEG3, TPM1 with miRNAs was amplified by PCR (target lncRNA sequence in MEG3, from 20359 bp to 20470 bp; target mRNA sequence in TPM1, from 12109 bp to12230 bp). Hieff Mut™ Multi Site-Directed Mutagenesis Kit (Yesen, Shanghai, China) was used to change the basic groups of the miRNA-96-binding site on MEG3 and TPM1 in PCR products. According to the manufacturer’s instruction, some basic groups of miRNA-96-binding site on MEG3 and TPM1 in PCR products were mutated by PCR. These mutations had not been studied before. And then, the sequences contained wild typed binding site region (the target lncRNA sequence or mRNA sequence amplified by PCR before) or mutant typed binding site region (the PCR product being changed basic groups before) were inserted into pmiR-RB-REPORORTTM Vector (Ribobio, Guangzhou, China), between the XhoI and NotI sites. Briefly, restriction enzyme cutting sites (XhoI and NotI sites) were PCR primers when MEG3 and TPM1 target region were amplified. After enzyme digestion and connection, recombinant vector was conducted. DNA sequencing was applied to validate the insertions. SV-HUC-1 cell lines mixed with miR-96 mimics were seeded in 96-well plates and were co-transfected with 0.2 μg pmiR-RB-REPORORT TM Vector or NC. After transfecting for 48 hrs, the relative luciferase activity was examined by the Dual Luciferase Reporter Assay System (Promega, WI, USA).
MTT cytotoxicity assay
Transfected 5687 cells were seeded in a 96-well plate and incubated for 24 hrs, 48 hrs and 72 hrs, at which 10 ul of 5 mg/mL MTT (Sigma-Aldrich, St. Louis, MO, USA) was added respectively. After another 4 hrs of incubation, the corresponding medium was removed and DMSO (Sigma-Aldrich, St. Louis, MO, USA) was added. 100 μl DMSO was added. The absorbance at 490 nm was measured using a microplate reader (Thermo Fisher Scientific, MA, USA).
Flow cytometry assay
Cell cycle and cell apoptosis assay were performed by the Cell Cycle and Apoptosis Analysis Kit (Beyotime, Shanghai, China). For the cell cycle assay, cells harvested in the log phase of growth were washed with ice-cold PBS buffer and fixed with 70% ethanol for more than 12 hrs at 4 °C overnight. For the apoptosis assay, cells were collected and re-suspended with a binding buffer 48 hrs after the transfection. Cells were digested, washed and collected after centrifuged for 5 min at 1000 rpm. They were then fixed in mixture of 200 μl binding buffer, 5 μl Annexin V-FITC and 5 μl PI in dark for 15 minutes. Flow-cytometric analysis was carried out on the FACSCalibur flow-cytometer (Becton Dickinson, Oxford, UK) analyzed by Cell Quest software.
Western blot
Crude proteins extracted from transfected 5637 cells with RIPA lysis buffer (Beyotime, Shanghai, China) were quantified by BCA Protein Quantification Kit (Yeasen, Shanghai, China). Afterwards, the proteins were loaded into 10% SDS polyacrylamide gels and separated by electrophoresis. The separated proteins were moved to PVDF membranes by wet transfer method after fully separating. And then, the membrane was blocked with 5% fat-free milk for 1 h before undergoing 12 h incubation with primary antibody. After washing three times with TBS-Tween buffer for 30 min, the membrane was placed in secondary antibody (1:5000, ab6721, Abcam) for 1 h at room temperature. The protein was stained by Super Ecl Plus (Yeasen, Shanghai, China) after The membrane was repeated washing 3 times with TBS-Tween buffer, the membrane was repeated washing 3 times with TBS-Tween buffer. The primary antibodies in present study were as follows: TPM1 (1.25 µg/ml, ab55915, Abcam), Bcl-2 (1:1000, ab32124, Abcam), Bax (1:1000, ab32503, Abcam), Cyclin D1 (1:10000, ab134175, Abcam), caspase 3 (1:500, ab13847, Abcam). The band intensity of western blot was quantified with ImageJ (Version1.48 u, Bethesda, USA).
Tumor xenograft in nude mice
BALB/c nude mice were purchased from Shanghai SLAC Laboratory Animal Co. (Shanghai, China). 5637 cells transfected with pcDNA3.1-MEG3, pcDNA3.1, miR-96 inhibitor and miR-NC were used in subcutaneous injections with 5 × 10⁵ cells/100 μl. All mice were sacrificed at the 4th week and TPM1 in tumor tissues was examined by western blot. All experiments were known and approved by the animal center of Peking Union Medical College Hospital.
Statistical analysis
The experimental data were analyzed by GraphPad 6.0 (Version 6, CA, USA). Results were displayed in form of mean ± standard deviation ( ± s). All experiments were repeated three times and the variations in two groups were analyzed by a one-tailed Student’s t-test. The differences among 3 groups were analyzed by one-way ANOVA. P < 0.05 signified a statistical significance.
Results
Lncrna MEG3 was low expressed in bladder urothelial carcinoma
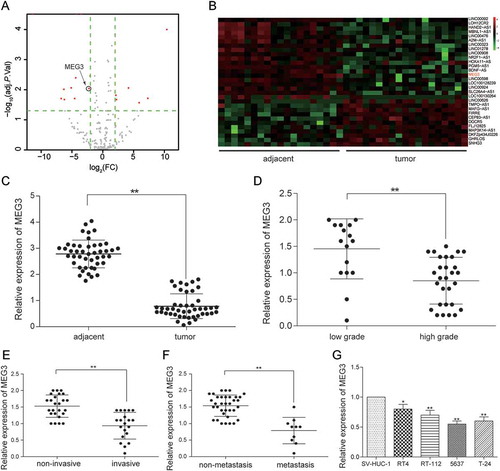
After the analysis the gene expression data from TCGA by R package, the abnormal expression lncRNAs were obtained. There were 30 differently expressed lncRNAs, consisting of 11 up-regulation lncRNAs and 19 down-regulation lncRNAs (). MEG3 was one of 19 down-regulation lncRNAs and its expression in bladder urothelial carcinoma was down-regulated by 2.06 times (-). Given that MEG3 was among the top 10 down-regulated lncRNAs and previous studies showed that MEG3 had a real connection with the diagnosis and recurrence of bladder cancer as well as the cell proliferation in bladder cancer so that MEG3 was focused on in this study.Citation13,Citation28 MEG3 expression in 45 bladder urothelial carcinoma tissues and 45 adjacent tissues were examined by RT-qPCR. The result showed that MEG3 production in bladder urothelial carcinoma tissues was down-regulated (). In order to investigate the relationship between MEG3 expression and clinical stage of bladder cancer, the testing results of 45 bladder urothelial carcinoma tissues were classified according to the patient clinical information (Supplementary Table S1). The ratios of MEG3 low-expression in high-grade urothelial carcinoma (n = 29), muscular invasive bladder cancer (T2+ T3+ T4, n = 20) and metastatic bladder cancer (n = 10) were higher than that in low-grade urothelial carcinoma (n = 16, P = 0.0099), non-muscle invasive bladder cancer (Ta+ T1, n = 25, P = 0.0777) and non-metastasis bladder cancer (n = 35, P = 0.2918, ) respectively. The MEG3 expression in low-grade urothelial carcinoma, non-muscle invasive bladder cancer and non-metastasis bladder cancer were respectively 3.18 times (), 2.44 times () and 2.30 times () higher than that in high-grade urothelial carcinoma, muscular invasive bladder and metastatic bladder cancer, which indicated that low expression of MEG3 was related to severer histologic grade, clinical stage, and metastasis of bladder cancer. In order to screen the cell line for the next test, MEG3 expression of four cancer cell lines was examined. It was found out that MEG3 expression in 5637 cell line and T-24 cell line were the lower than that in the other cell line (). Hence, 5637 cell line and T-24 cell line were chosen for further experiment.
Table 2. MEG3 expressions in clinical samples.
Figure 1. MEG3 was low expressed in bladder urothelial carcinoma. (A) R package showed the differentially expressed lncRNAs in bladder urothelial carcinoma after analyzing lncRNAs expression profiles from 19 paired tissues of TCGA; (B) Heat map. R package showed the expression of the differentially expressed lncRNAs. MEG3 was one of the down-regulated lncRNAs; (C) RT-qPCR demonstrated that MEG3 was low expressed in bladder urothelial carcinoma tissues after comparing 45 tumor tissues with 45 adjacent tissues; (D) RT-qPCR demonstrated that MEG3 expression level in high-grade bladder urothelial cancer was lower than that in low-grade bladder urothelial cancer after comparing 29 high-grade cancer tissues with 16 low-grade cancer tissues; (E) RT-qPCR revealed that MEG3 production in muscular invasive bladder cancer was lower than that in non-muscle invasive bladder cancer after comparing 20 muscular invasive cancer tissues with 25 non-muscle invasive cancer tissues; (F) RT-qPCR showed that MEG3 expression in metastatic bladder cancer was lower than that in non-metastasis bladder cancer after comparing 10 metastatic cancer tissues with 35 non-metastasis cancer tissues; (G) RT-qPCR showed the expression of MEG3 in different BC cell line and normal cell line. *P < 0.05, **P < 0.01, compared with adjacent tissues, low grade bladder urothelial cancer, non-invasive bladder cancer or non-metastasis bladder cancer. Each RT-qPCR was repeated three times.
MEG3 overexpression inhibited cell proliferation and enhanced cell apoptosis
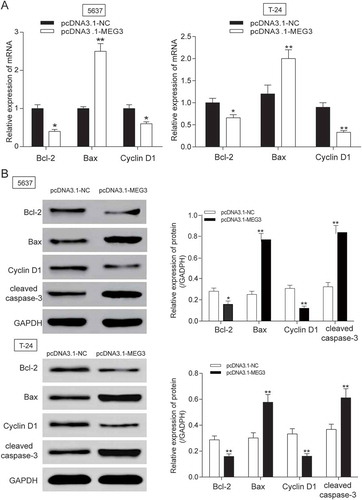
The MEG3 expression in 5637 cells and T-24 cells transfected with pcDNA3.1-MEG3 and pcDNA3.1-NC were tested by RT-qPCR. MEG3 expression was increased by 70% in 5637 cells and 65% in T-24 cells transfected with pcDNA3.1-MEG3 (P = 0.0025, ), indicating high transfection efficiency. Then, experiments focused on the relationship between MEG3 overexpression and cell proliferation, cell apoptosis or cell cycle were carried out. Cell proliferation test showed that significant decrease of cellular proliferation was observed 48 −72 h in 5637 cells and 24 −72 h in T-24 cells in pcDNA3.1-MEG3 group (P < 0.05, ), which indicated that high expression of MEG3 could inhibit cell proliferation. Cell apoptosis of 5637 cells was detected by flow cytometry at 48 h post transfection. It was found out that cell apoptosis of 5637 cells and T-24 cells transfected with pcDNA3.1-MEG3 increased remarkably (P < 0.01, ). Cell cycle of 5637 cells and T-24 cells was also detected by flow cytometry at 48 h post transfection. The result showed that a majority of cells were blocked in G0/G1 phase and cells in G2/M phase were declined (). The mRNA and protein expression of apoptosis related protein Bcl-2, Bax and cleaved-caspase 3 and cell cycle related protein Cyclin D1 was checked by RT-qPCR and western blot. It was found out that the mRNA and protein expression of Bcl-2 and Cyclin D1 was decreased, while the mRNA and protein expression of Bax and cleaved-caspase 3 were both increased (-).
Figure 2. MEG3 up-regulation suppressed cell proliferation and enhanced cell apoptosis. (A) RT-qPCR showed that pcDNA3.1-MEG3 had high transfection efficiency in 5637 cells and T-24 cells; (B) MTT assay demonstrated that pcDNA3.1-MEG3 could slow down cell proliferation in 5637 cells and T-24 cells; (C) Flow cytometry revealed that cell apoptosis of cells transfected with pcDNA3.1-MEG3 was high in 5637 cells and T-24 cells; (D) Flow cytometry showed that pcDNA3.1-MEG3 blocked cells in G0/G1 phase in 5637 cells and T-24 cells. *P < 0.05, **P < 0.01, compared with pcDNA3.1-NC. Each test was repeated three times.
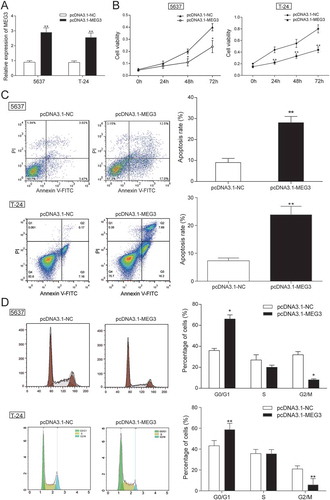
Figure 3. MEG3 up-regulation suppressed cell apoptosis related protein expression in 5637 cells and T-24 cells. (A-B) After being transfected with pcDNA3.1-MEG3, mRNA and protein expression level of apoptosis related protein Bcl-2 and Cyclin D1 was decreased, while the mRNA or protein expression of Bax, cleaved-caspase 3 were both increased after being examined by RT-qPCR and western blot. *P < 0.05, **P < 0.01, compared with pcDNA3.1-NC. Each test was repeated three times.
Mir-96 was highly expressed in bladder urothelial carcinoma
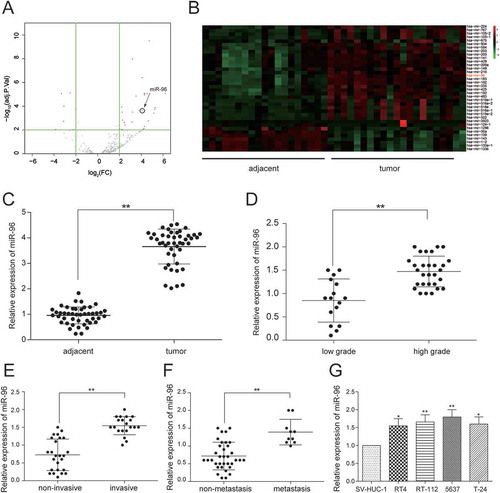
After the analysis, the gene expression data from TCGA by R package, the abnormally expressed miRNAs were obtained. There were 69 differentially expressed miRNAs analyzed by miRNA microarray, consisting of 58 up-regulated miRNAs and 11 down-regulated miRNAs. MiR-96 was one of top 10 up-regulated miRNAs and its expression in bladder cancer tissues was 3.82 times higher than that in adjacent tissues (-). Further, miR-96 was found to have a binding site with MEG3 predicting by miRcode so it was focused on for the next investigation. Then, miR-96 expression in 45 bladder cancer tissues and 45 adjacent tissues was also examined by RT-qPCR. In accordance with clinical information of patients, the association between miR-96 expression and clinical stage was researched. The findings showed that miR-96 was intensely expressed in bladder cancer tissues compared with adjacent tissues (P < 0.01, ) and its ratio of miR-96 high-expression in high-grade urothelial carcinoma, muscular invasive bladder cancer and metastatic bladder cancer were higher than that in low-grade urothelial carcinoma (P = 0.0671), non-muscle invasive bladder cancer (P = 0.0484) and non-metastasis bladder cancer (P = 0.2281, ). MiR-96 expression in high-grade urothelial carcinoma, muscular invasive bladder cancer and metastatic bladder cancer was respectively 3.02 times (), 2.24 times () and 2.10 times () higher than that in low-grade urothelial carcinoma, non-muscle invasive bladder cancer and non-metastasis bladder cancer. Those findings indicated that the high expression of miR-96 had a certain connection with severer histologic grade, clinical stage, and metastasis of bladder cancer. MiR-96 expression in four cancer cell lines was examined by RT-qPCR and that in 5637 cell line was the highest (). Hence, 5637 cell line was chosen for further experiment.
Table 3. MiR-96 expressions in clinical samples.
Figure 4. MiR-96 was highly expressed in bladder urothelial carcinoma. (A)Volcano plot, R package was used to analyze the miRNAs expressed differentially in bladder urothelial carcinoma after analyzing miRNAs expression profiles from 19 paired tissues of TCGA; (B) Heat map. R package showed the expression of the differentially expressed lncRNAs. MiR-96 was one of the intensely expressed miRNAs; (C) RT-qPCR demonstrated that miR-96 was up-regulated in bladder urothelial carcinoma tissues after comparing 45 tumor tissues with 45 adjacent tissues; (D) RT-qPCR revealed that miR-96 expression level in 29 high-grade bladder urothelial cancer tissues was higher than that in 16 low-grade bladder urothelial cancer tissues; (E) RT-qPCR showed that miR-96 production in 20 muscular invasive bladder cancer tissues was higher than that in 25 non-muscle invasive bladder cancer tissues; (F) RT-qPCR demonstrated that miR-96 expression in 10 metastatic bladder cancer tissues was higher than that in 35 non-metastasis bladder cancer tissues; (G) RT-qPCR showed the expression of MEG3 in different BC cell line and normal cell line. *P < 0.05, **P < 0.01, compared with adjacent tissues, low grade bladder urothelial cancer, non-invasive bladder cancer or non-metastasis bladder cancer. Each RT-qPCR was repeated three times.
Mir-96 was a target of MEG3
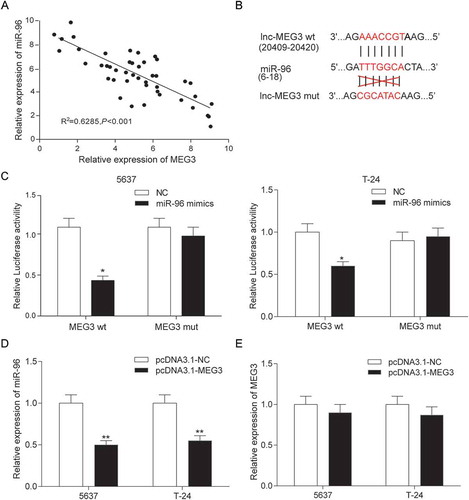
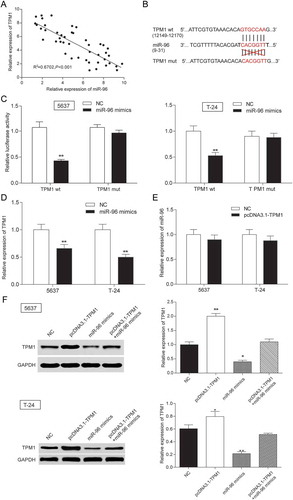
The expressions of MEG3 and miR-96 in 45 clinical samples were examined by RT-qPCR. In , every plot presented a patient. The expression of MEG3 was regarded as X-axis and the expression of miR-96 was regarded as Y-axis to draw a picture in GraphPad. Analysis by GraphPad suggested the negative correlation between MEG3 and miR-96 in bladder cancer (). MiRcode predicted that miR-96 might have a binding site on MEG3 whose details of location in MEG3 and miR-96 and the mutant binding site on MEG3 were both shown in . In order to validate the relation between MEG3 and miR-96, dual luciferase reporter assay was performed in 5637 cells and T-24 cells. There were two luciferases in dual luciferase reporter, renilla luciferase and firefly luciferase. Renilla luciferase was used as internal control. In MEG3 wt group – miR-96 mimics group, miR-96 could bind with MEG3 so that firefly luciferase expression and fluorescence activity (firefly luciferase/renilla luciferase) were both declined compared with NC group. Whereas, in MEG3 mut group – miR-96 mimics group, miR-96 could not bind with MEG3 so that firefly luciferase expression and fluorescence activity (firefly luciferase/renilla luciferase) had no change compared with NC group (). It was indicated that MEG3 could control miR-96 expression by binding with it. The findings that MEG3 overexpression down-regulated significantly miR-96 expression (P < 0.01, ) and miR-96 overexpression did not affect MEG3 production (P > 0.05, ) further proved that miR-96 was a target gene of MEG3.
Figure 5. MiR-96 was a target of MEG3 in 5637 cells and T-24 cells. (A) RT-qPCR showed that MEG3 and miR-96 expression in 45 paired tissues and revealed that MEG3 and miR-96 were negatively related; (B) MiRcode predicted that MEG3 and miR-96 might have a binding site; (C) Dual luciferase reporter assay proved that MEG3 bound to miR-96 directly. The group which binding site on MEG3 was mutated (mut group) had no significant difference after being treated with miR-96 mimics; (D) RT-qPCR demonstrated that pcDNA3.1-MEG3 could suppress the expression of miR-96; (E) RT-qPCR showed that miR-96 mimics could not affect the production of MEG3. *P < 0.05, **P < 0.01, compared with NC. Each test was repeated three times.
High expression of MEG3 inhibited cell proliferation and enhanced cell apoptosis by targeting mir-96
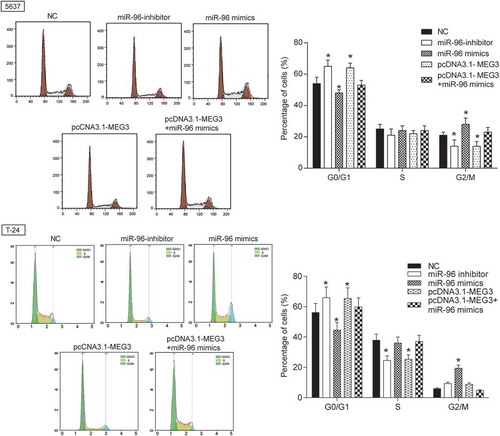
MiR-96 mimics and miR-96 inhibitor were transfected into 5637 cells and T-24 cells to test transfection efficiency. The results showed up-regulated expression in miR-96 mimics group and down-regulated expression in miR-96 inhibitor group (). The effects of MEG3 on cell proliferation, cell apoptosis and cell cycle were examined by MTT and flow cytometry. The result showed that miR-96 inhibitor and pcDNA-MEG3 inhibited cell proliferation and enhanced cell apoptosis, whereas miR-96 mimics enhanced cell proliferation and inhibited cell apoptosis (-). After being transfected with miR-96 inhibitor and pcDNA-MEG3, majority cells were blocked in G0/G1 phase. On the contrary, cells in G0/G1 phase declined after being transfected with miR-96 mimics (). NC group and pcDNA-MEG3+ miR-96-mimics group had no significant difference ().
Figure 6. MEG3 inhibited cell proliferation and enhanced cell apoptosis by targeting miR-96 in 5637 cells and T-24 cells. (A) RT-qPCR showed that miR-96 mimics and miR-96 inhibitor had high transfection efficiency in 5637 cells; (B) MTT assay demonstrated that cell proliferation of cells transfected with pcDNA3.1-MEG3 or miR-96 inhibitor was slowed down, while cell proliferation of cells transfected with miR-96 mimics was accelerated. PcDNA3.1-MEG3+ miR-96 mimics group had no remarkable difference with NC group; (C) Flow cytometry revealed that pcDNA3.1-MEG3 and miR-96 inhibitor could promote cell apoptosis, whereas miR-96 mimics inhibited it. NC group also had no remarkable difference compared with pcDNA3.1-MEG3+ miR-96 mimics group. *P < 0.05, **P < 0.01, compared with NC. Each test was repeated three times.
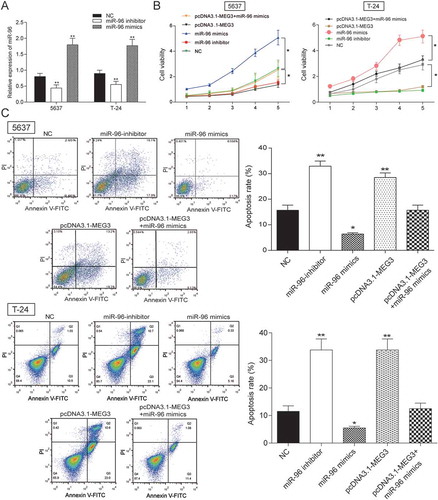
Figure 7. MEG3 inhibited cell proliferation and enhanced cell cycle by targeting miR-96 in 5637 cells and T-24 cells. Flow cytometry revealed that cells transfected with pcDNA3.1-MEG3 or miR-96 inhibitor were blocked in G0/G1 phase. But miR-96 mimics had the opposite effect. *P < 0.05, compared with NC. Each test was repeated three times.
TPM1 was low expressed in bladder urothelial carcinoma.
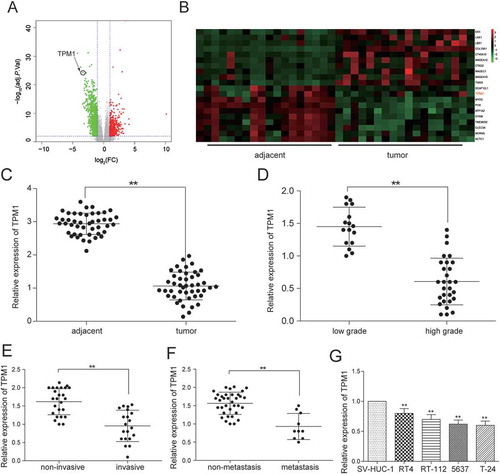
After the analysis the gene expression data from TCGA by R package, the abnormal expression mRNAs were obtained. There were 919 differentially expressed mRNAs analyzed by mRNA microarray, consisting of 92 up-regulated mRNAs and 627 down-regulated mRNAs. TPM1 was one of 627 down-regulated mRNAs and its expression in cancer tissues was 3.63 times higher than that in adjacent tissues (-). TPM1 expression in 45 clinical samples was examined by RT-qPCR. The result confirmed that it was poorly expressed in 45 bladder urothelial carcinoma tissues compared with adjacent tissues (). Results were also classified according to clinical information to test the relation between TPM1 and clinical stage. It was found out that the proportion of TPM1 low expression in high-grade urothelial carcinoma, muscular invasive bladder cancer and metastatic bladder cancer were higher than that in low-grade urothelial carcinoma (P = 0.0030), non-muscle invasive bladder cancer (P = 0.0237) and non-metastasis bladder cancer (P = 0.0108, ). The expression of TPM1 in low-grade urothelial carcinoma, non-muscle invasive bladder cancer and non-metastasis bladder cancer was respectively 2.40 times (), 2.01 times () and 2.30 times () higher than that in high-grade urothelial carcinoma, muscular invasive bladder cancer and metastatic bladder cancer, which indicated that the low expression of TPM1 was related to severer histologic grade, clinical stage, and metastasis of bladder cancer. TPM1 expression in four cancer cell lines was examined. The result displayed that its expression in 5637 cell line lower than that in RT4 cell line and RT-112 cell line (). Therefore, 5637 cell line was chosen for further experiment.
Table 4. TPM1 expressions in clinical samples.
Figure 8. TPM1 was down-regulated in bladder urothelial carcinoma. (A) Volcano plot, R package was used to analyze genes expressed differentially in bladder urothelial carcinoma after analyzing miRNAs expression profiles from 18 paired tissues of TCGA; (B) Heat map. R package showed the expression of the differentially expressed mRNAs. TPM1 was one of the low expressed genes. (C) RT-qPCR demonstrated that TPM1 was low expressed in bladder urothelial carcinoma tissues after comparing 45 tumor tissues with 45 adjacent tissues; (D) RT-qPCR revealed that TPM1 expression in 29 high-grade bladder urothelial cancer tissues was lower than that in 16 low-grade bladder urothelial cancer tissues; (E) RT-qPCR demonstrated that TPM1 production in 20 muscular invasive bladder cancer tissues was lower than that in 25 non-muscle invasive bladder cancer tissues; (F) RT-qPCR showed that TPM1 expression in 10 metastatic bladder cancer tissues was lower than that in 35 non-metastasis bladder cancer tissues; (G) RT-qPCR showed the expression of TPM1 in different BC cell line and normal cell line. **P < 0.01, compared with adjacent tissues, low grade bladder urothelial cancer, non-invasive bladder cancer or non-metastasis bladder cancer. Each RT-qPCR was repeated three times.
Mir-96was a target gene of TPM1
The expression of miR-96 and TPM1 was tested by RT-qPCR. In , every plot presented a patient. The expression of miR-96 was regarded as X-axis and the expression of TPM1 was regarded as Y-axis to draw a picture in GraphPad. The correlation between miR-96 and TPM1 was analyzed in GraphPad. It was supposed that miR-96 has a negative connection with TPM1 (). MiRBase predicted that miR-96 might have a binding site with TPM1 in 3ʹuntranslated regions (3ʹ-UTR) whose details of location in miR-96 and TPM1 and the mutant binding site on TPM1 were both shown in . Therefore, dual luciferase reporter assay was carried out to validate targeting regulation in 5637 cells and T-24 cells. In TPM1 wt group – miR-96 mimics group, miR-96 could bind with TPM1 so that firefly luciferase expression and fluorescence activity (firefly luciferase/renilla luciferase) was both declined compared with NC group. However, in TPM1 mut group – miR-96 mimics group, miR-96 could not bind with TPM1, so firefly luciferase expression and fluorescence activity (firefly luciferase/renilla luciferase) had no change compared with NC group (). It was indicated that miR-96 could control TPM1 expression by binding with it. - further confirmed that miR-96 could decrease the TPM1 expression but TPM1 could not downregulate the expression of miR-96. TPM1 protein expression also increased when cells were transfected with pcDNA3.1-TPM1 and decreased when miR-96 was overexpressed (). In conclusion, TPM1 was a downstream gene of miR-96.
Figure 9. TPM1 was a target gene of MiR-96 in 5637 cells and T-24 cells. (A) RT-qPCR showed that miR-96 and TPM1 expression in 45 paired tissues and revealed that miR-96 and TPM1 were negatively related with TPM1; (B) MiRBase predicted that TPM1 and miR-96 might have a binding site; (C) Dual luciferase reporter assay proved the direct target relationship. The group which binding site on TPM1 (mut group) was mutated had no significant difference after being treated with miR-96 mimics; (D) RT-qPCR showed that miR-96 mimics could down-regulate the expression of TPM1; (E) RT-qPCR demonstrated that pcDNA3.1-TPM1 could not down-regulate the production of miR-96; (F) Western blot revealed that PcDNA3.1-TPM1 group had high expressed TPM1 and miR-96 mimics group had low expressed TPM1. PcDNA3.1-TPM1+ miR-96 mimics had no significant change compared with NC group. *P < 0.05, **P < 0.01, compared with NC. Each test was repeated three times.
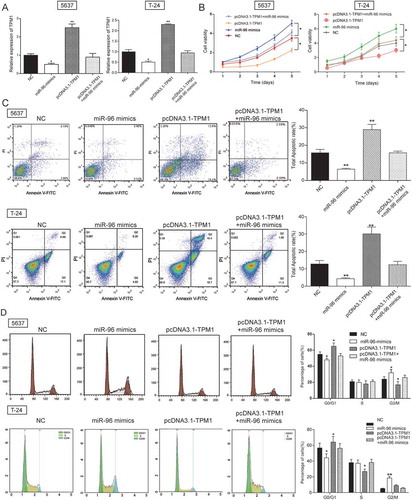
TPM1 inhibited cell proliferation and enhanced cell apoptosis.
MTT assay and flow cytometry were performed to investigate the effects of TPM1 to cell proliferation and cell apoptosis, which indicated that miR-96 mimics enhanced cell proliferation, inhibited cell apoptosis and pcDNA3.1-TPM1 suppressed cell proliferation, promoted cell apoptosis (both P < 0.05, -) in 5637 cells and T-24 cells. Higher apoptotic rate was observed in pcDNA3.1-TPM1 group while lower apoptotic rate was observed in both 5637 miR-96 mimics group (both P < 0.01, ) and T-24 miR-96 mimics group. In cell cycle assay, cells of miR-96 mimics group in G0/G1 phase were declined, while cells of pcDNA3.1-TPM1 group in G0/G1 phase were increased (all P < 0.05, ) in 5637 cells and T-24 cells.
Figure 10. TPM1 inhibited cell proliferation and promoted cell apoptosis in 5637 cells and T-24 cells. (A) RT-qPCR showed that miR-96 mimics, pcDNA3.1-TPM1 and pcDNA3.1-TPM1+ miR-96 mimics had high transfection efficiency in 5637 cells; (B) MTT assay demonstrated that cell proliferation in pcDNA3.1-TPM1 group was inhibited, while cell proliferation in miR-96 mimics group was accelerated. PcDNA3.1-MEG3+ miR-96 mimics group had no remarkable difference compared with NC group; (C) Flow cytometry revealed that pcDNA3.1-TPM1 could promote cell apoptosis, whereas miR-96 mimics inhibited it. PcDNA3.1-MEG3+ miR-96 mimics group had no remarkable difference compared with NC group; (D) Flow cytometry showed that cells transfected with pcDNA3.1-TPM1 were blocked in G0/G1 phase. But miR-96 mimics had the opposite effect. *P < 0.05, **P < 0.01, compared with NC. Each test was repeated three times.
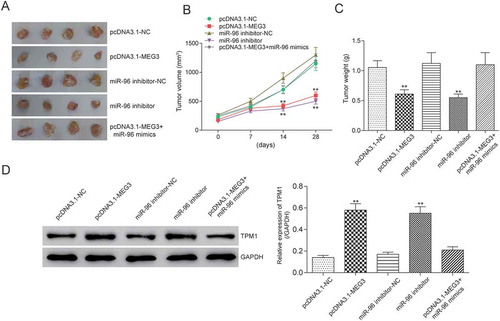
MEG3 and mir-96 suppression inhibited tumor growth by targeting TPM1 in vivo
In order to observe the effect of MEG3 and miR-96 on tumor growth in vivo, 12 nude mice were respectively injected with pcDNA3.1-MEG3, pcDNA3.1-NC, miR-96 inhibitor, pcDNA3.1-MEG3+ miR-96 mimics and NC (nonsense sequence). And all nude mice were alive in 4th week before sacrificing for tumor weight examination. The results showed that pcDNA3.1-MEG3 and miR-96 inhibitor could inhibit tumor growth in vivo (). When MEG3 expression was up-regulated or miR-96 expression was down-regulated, tumor growth slowed down (). And tumor weights in pcDNA3.1-MEG3 group and miR-96 inhibitor group were also lighter than in NC group (). Further, TPM1 expression in tumor was tested by western blot. PcDNA3.1-MEG3 and miR-96 inhibitor could both up-regulate TPM1 ().
Figure 11. MEG3 and miR-96 suppression inhibited tumor growth by targeting TPM1 in vivo. (A) After injecting with pcDNA3.1-MEG3 or miR-96 inhibitor, tumor growths were decreased remarkably in vivo; (B) Tumor volumes were examined. It was found out that tumor volume in pcDNA3.1-MEG3 group and miR-96 inhibitor group were smaller than in NC group; (C) Tumor weights were tested. It was found out that tumor weight in pcDNA3.1-MEG3 group and miR-96 inhibitor group were also lighter than in NC group; (D) Western blot showed that pcDNA3.1-MEG3 and miR-96 inhibitor could both up-regulated the expression of TPM1. **P < 0.01, compared with pcDNA3.1-NC or miR-96 mimics-NC. Each test was repeated three times.
Discussion
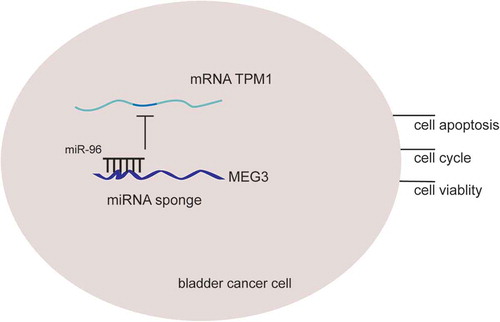
In this study, it was found out that lncRNA MEG3 could suppress bladder cancer progression by regulating miR-96/TPM1 expressions. LncRNA MEG3 was low expressed in tumor tissues and could act as a biomarker for high-grade urothelial carcinoma, muscular invasive bladder cancer and metastatic bladder cancer. Its overexpression could suppress the proliferation and promote cell apoptosis by regulating cell cycle and apoptosis related proteins. And this process was realized by up-regulating miR-96 expression which simultaneously downregulated TPM1 expression. Besides, lncRNA MEG3’s suppressor role was confirmed in nude mice model. The rationale of MEG3/miR-96/TPM1 was shown in . Therefore, lncRNA MEG3 and its underlying mechanism in bladder cancer regulation might enlighten future studies.
Figure 12. The rationale of MEG3, miR-96 and TPM1. LncRNA MEG3 can serve as natural miRNA sponges by competitive binding to miR-96 to suppress its expression as well as function, then further up-regulate TPM1 expression and consequently inhibits bladder cancer progression.
LncRNAs MEG3 was low expressed in tumor tissues and related with high-grade urothelial carcinoma, muscular invasive bladder cancer and metastatic bladder cancer. There are previous studies showing that MEG3 is able to result in growth suppression, p53 protein increase, and activation of p53 downstream targets.Citation29 In another word, the ectopic expression of MEG3 gene significantly inhibits proliferation and induces apoptosis.Citation30 This is consistent with discoveries in our present study and we further confirmed the conclusion in both in vivo and in vitro experiments. Besides, the correlation between lncRNA MEG3 and clinical information has seldom been discussed in previous researches. However, this study discovered a negative relationship between its expression and staging, invasiveness and metastases.
MiR-96 was highly expressed in bladder cancer and deteriorated cancer progression. LncRNA MEG3 could sponge the expression of miR-96 and inhibit proliferation, retard cell cycle and promote cell apoptosis. Vishuamitra et al. found that miR-96 transfection attenuated lymphoma.Citation31 MiR-96 was also shown to function as a tumor-promoter due to invasive ability improvement in hepatocellular carcinoma cells,Citation32 human bladder urothelial carcinomas,Citation20 non-small cell lung cancer,Citation33 and breast cancer.Citation34 In spite of the confusing role of miR-96, it is confirmed in this study as a promoter. Previously, long intergenic non-protein coding RNA 2381(LOC400043) was revealed as a miRNA sponge for miR-28-3p and miR-96-5p by applying a series of bioinformatics techniques and validated with biological experiments.Citation35 Sensitivity and specificity of multiple genetic and epigenetic biomarkers including lncRNAs and miRNAs targeting hyaluronoglucosaminidase 1 (HYAL1) were compared, among which miR-210, miR-96 and urothelial cancer associated 1 (UCA1) showed better performance as diagnostic markers. Therefore, the combination of miR-210, miR-96 and lncRNA-UCA1 has the highest accuracy in diagnosis prediction.Citation36 However, the correlation between lncRNA and miRNA was neglected. This study, on the contrary, revealed lncRNA MEG3 as a miR-96 sponger in bladder cancer, and both of them were correlated with diagnostic statistics, indicating them as diagnostic biomarkers.
Furthermore, we proved that lncRNA MEG3 sponged miR-96 and increased TPM1, thus inhibiting cell progression. MiR-21 has been reported repeatedly to target at tumor suppressor gene TPM1 and negatively regulate TPM1 in multiple cancers.Citation37–Citation39 However, the correlation between miR-96 and TPM1 was firstly confirmed in this study and in bladder cancer, which may enrich future studies. As in our study, RT-qPCR and western blot showed that miR-96 directly target at TPM1 and downregulated its expression. Thus a regulating network was formed: lncRNA MEG3 sponged miR-96, which increased directly the expression of TPM1, a tumor suppressor. Through this mechanism, lncRNA MEG3 inhibited bladder cancer progression in vitro and in vivo. Besides, lncRNA MEG3/miR-96/TPM1 all appeared to be diagnostic biomarkers.
It was novel that the present study might provide some experimental data of lncRNA MEG3/miR-96/TPM1 regulation network. But there still were some limitations in our study. For instance, the way how TPM1 affect BC was still unclear. The further study should screen a pathway which could be regulated by MEG3/miR-96/TPM1 by bioinformatics analysis and verify the pathway related protein expression by western blot.
In summary, this study proved that lncRNA MEG3 inhibited proliferation, retarded cell cycle and promoted apoptosis and confirmed the regulation network: lncRNA MEG3 sponged miR-96, which increased directly the expression of TPM1, a tumor suppressor. Besides, lncRNA MEG3 suppression/miR-96 overexpression/TPM1 suppression were found to be related with severer diagnosis including higher disease staging, severer invasiveness and metastases. Our findings suggested that MEG3 could be a target for detection and effective therapy for bladder urothelial carcinoma in the future.
Supplemental Material
Download MS Word (19.1 KB)Disclosure statement
No potential conflict of interest was reported by the authors.
Supplementary material
Supplemental data for this article can be accessed on the publisher’s website.
Additional information
Funding
Related Research Data
References
- Duan W, Du L, Jiang X, Wang R, Yan S, Xie Y, Yan K, Wang Q, Wang l, Zhang L, et al. Identification of a serum circulating lncRNA panel for the diagnosis and recurrence prediction of bladder cancer. Oncotarget. 2016;7(48):78850–78858. doi:10.18632/oncotarget.12880.
- Cazier JB, Rao SR, McLean CM, Walker AK, Wright BJ, Jaeger EE, Kartsonaki C, Marsden L, Yau C, Camps C, et al. Whole-genome sequencing of bladder cancers reveals somatic CDKN1A mutations and clinicopathological associations with mutation burden. Nat Commun. 2014;5:3756. doi:10.1038/ncomms5972.
- Siegel RL, Miller KD, Jemal A. Cancer statistics, 2016. CA Cancer J Clin. 2016;66(1):7–30. doi:10.3322/caac.21332.
- Dettlaff K, Stawny M, Ogrodowczyk M, Jelińska A, Bednarski W, Wątróbska-Świetlikowska D, Keck RW, Khan OA, Mostafa IH, Jankun J. Formulation and characterization of EGCG for the treatment of superficial bladder cancer. Int J Mol Med. 2017;40(2):329–336. doi:10.3892/ijmm.2017.3024.
- Siegel RL, Miller KD, Cancer Statistics JA. 2017. CA Cancer J Clin. 2017;67(1):7–30. doi:10.3322/caac.21387.
- Babjuk M, Burger M, Zigeuner R, Shariat SF, van Rhijn BW, Compérat E, Sylvester RJ, Kaasinen E, Böhle A, Palou Redorta J, et al. EAU guidelines on non-muscle-invasive urothelial carcinoma of the bladder: update 2013. Eur Urol. 2013;64(4):639–653. doi:10.1016/j.eururo.2013.06.003.
- Zhu J, Liu S, Ye F, Shen Y, Tie Y, Zhu J, Wei L, Jin Y, Fu H, Wu Y, et al. Long Noncoding RNA MEG3 Interacts with p53 Protein and Regulates Partial p53 Target Genes in Hepatoma Cells. PLoS One. 2015;10(10):1932–6203. doi:10.1371/journal.pone.0139790.
- Gordon FE, Nutt CL, Cheunsuchon P, Nakayama Y, Provencher KA, Rice KA, Zhou Y, Zhang X, Klibanski A. Increased expression of angiogenic genes in the brains of mouse meg3-null embryos. Endocrinology. 2010;151(6):1945–7170. (Electronic).
- Kruer TL, Dougherty SM, Reynolds L, Long E, De Silva T, Lockwood WW, et al. Expression of the lncRNA Maternally Expressed Gene 3 (MEG3) Contributes to the Control of Lung Cancer Cell Proliferation by the Rb Pathway. Plos One. 2016;11(11):1932–6203. (Electronic).
- Gordon F, Nutt C, Cheunsuchon P, Nakayama Y, Provencher K, Rice K, Zhou Y, Zhang X, Klibanski A. 2010. Increased expression of angiogenic genes in the brains of mouse meg3-null embryos. Endocrinology. 151(6):2443–2452.
- Braconi C, Kogure T, Valeri N, Huang N, Nuovo G, Costinean S, Negrini M, Miotto E, Croce CM, Patel T. microRNA-29 can regulate expression of the long non-coding RNA gene MEG3 in hepatocellular cancer. Oncogene. 2011;30(47):4750–4756. doi:10.1038/onc.2011.193.
- Wang P, Ren Z, Sun P. Overexpression of the long non-coding RNA MEG3 impairs in vitro glioma cell proliferation. J Cell Biochem. 2012;113(6):1868–1874. doi:10.1002/jcb.24055.
- Duan W, Du L, Jiang X, Wang R, Yan S, Xie Y, Yan K, Wang Q, Wang L, Zhang X, et al. Identification of a serum circulating lncRNA panel for the diagnosis and recurrence prediction of bladder cancer. Oncotarget. 2016;7(48):78850–78858. doi:10.18632/oncotarget.12880.
- Lu KH, Li W, Liu XH, Sun M, Zhang ML, Wu WQ, Xie WP, Hou YY. Long non-coding RNA MEG3 inhibits NSCLC cells proliferation and induces apoptosis by affecting p53 expression. BMC Cancer. 2013;13:461. doi:10.1186/1471-2407-13-461.
- Zhou Y, Zhong Y, Wang Y, Zhang X, Batista DL, Gejman R, Ansell PJ, Zhao J, Weng C, Klibanski A. Activation of p53 by MEG3 non-coding RNA. J Biol Chem. 2007;282(34):24731–24742. doi:10.1074/jbc.M702029200.
- Bartel D. MicroRNAs: target recognition and regulatory functions. Cell. 2009;136(2):215–233. doi:10.1016/j.cell.2009.01.002.
- Sarkar F, Li Y, Wang Z, Kong D, Ali S. Implication of microRNAs in drug resistance for designing novel cancer therapy. Drug Resist Updat. 2010;13(3):57–66. doi:10.1016/j.drup.2010.02.001.
- Guo Y, Liu H, Zhang H, Shang C, Song Y. miR-96 regulates FOXO1-mediated cell apoptosis in bladder cancer. Oncol Lett. 2012;4(3):561–565. doi:10.3892/ol.2012.775.
- Wu Z, Liu K, Wang Y, Xu Z, Meng J, Gu S. 2015. Upregulation of microRNA-96 and its oncogenic functions by targeting CDKN1A in bladder cancer. Cancer Cell Int. 15:107. doi:10.1186/s12935-015-0235-8.
- Wang Y, Luo H, Li Y, Chen T, Wu S, Yang L. hsa-miR-96 up-regulates MAP4K1 and IRS1 and may function as a promising diagnostic marker in human bladder urothelial carcinomas. Mol Med Rep. 2012;5(1):260–265. doi:10.3892/mmr.2011.621.
- Qi L, Bart J, Tan L, Platteel I, Sluis T, Huitema S, Harms G, Fu L, Hollema H, Berg A. Expression of miR-21 and its targets (PTEN, PDCD4, TM1) in flat epithelial atypia of the breast in relation to ductal carcinoma in situ and invasive carcinoma. BMC Cancer. 2009;9:163. doi:10.1186/1471-2407-9-163.
- Nijak A, Alaerts M, Kuiperi C, Corveleyn A, Suys B, Paelinck B, Saenen J, Van Craenenbroeck E, Van Laer L, Loeys B, et al. Left ventricular non-compaction with Ebstein anomaly attributed to a TPM1 mutation. Eur J Med Genet. 2018;61(1):8–10.
- Wang J, Guan J, Lu Z, Jin J, Cai Y, Wang C, Wang F. Clinical and tumor significance of tropomyosin-1 expression levels in renal cell carcinoma. Oncol Rep. 2015;33(3):1326–1334. doi:10.3892/or.2015.3733.
- Chen C, Zhang L, Liu J, Han H, Chen N, Yao A, Kang S, Gao W, Shen H, Zhang L, et al. Bioinformatics analysis of differentially expressed proteins in prostate cancer based on proteomics data. Onco Targets Ther. 2016;9:1545–1557. doi:10.2147/OTT.S98807.
- Khori V, Amani Shalamzari S, Isanejad A, Alizadeh AM, Alizadeh S, Khodayari S, Khodayari H, Shahbazi S, Zahedi A, Sohanaki H, et al. Effects of exercise training together with tamoxifen in reducing mammary tumor burden in mice: possible underlying pathway of miR-21. Eur J Pharmacol. 2015;765:179–187. doi:10.1016/j.ejphar.2015.08.031.
- Thorsen K, Sørensen K, Brems-Eskildsen A, Modin C, Gaustadnes M, Hein A, Kruhøffer M, Laurberg S, Borre M, Wang K, et al. Alternative splicing in colon, bladder, and prostate cancer identified by exon array analysis. Mol Cell Proteomics. 2008;7(7):1214–1224. doi:10.1074/mcp.M700590-MCP200.
- Meng ZW, Pan W, Hong HJ, Chen JZ, Chen YL. Macroscopic types of intrahepatic cholangiocarcinoma and the eighth edition of AJCC/UICC TNM staging system. Oncotarget. 2017;8(60):101165–101174. doi:10.18632/oncotarget.20932.
- Ying L, Huang Y, Chen H, Wang Y, Xia L, Chen Y, Liu Y, Qiu F. Downregulated MEG3 activates autophagy and increases cell proliferation in bladder cancer. Mol Biosyst. 2013;9(3):407–411. doi:10.1039/c2mb25386k.
- Zhang X, Rice K, Wang Y, Chen W, Zhong Y, Nakayama Y, Zhou Y, Klibanski A. Maternally expressed gene 3 (MEG3) noncoding ribonucleic acid: isoform structure, expression, and functions. Endocrinology. 2010;151(3):939–947. doi:10.1210/en.2009-0657.
- Zhu J, Liu S, Ye F, Shen Y, Tie Y, Zhu J, Wei L, Jin Y, Fu H, Wu Y, Zheng X. Long Noncoding RNA MEG3 Interacts with p53 Protein and Regulates Partial p53 Target Genes in Hepatoma Cells. PLoS ONE. 2015;10(10):e0139790. doi:10.1371/journal.pone.0139790.
- Vishwamitra D, Li Y, Wilson D, Manshouri R, Curry CV, Shi B, Tang XM, Sheehan AM, Wistuba II, Shi P, et al. MicroRNA 96 is a post-transcriptional suppressor of anaplastic lymphoma kinase expression. Am J Pathol. 2012;180(5):1772–1780. doi:10.1016/j.ajpath.2012.01.008.
- Chen R, Xia Y, Xue T, Ye S. Suppression of microRNA-96 expression inhibits the invasion of hepatocellular carcinoma cells. Mol Med Rep. 2012;5(3):800–804. doi:10.3892/mmr.2011.695.
- Guo H, Li Q, Li W, Zheng T, Zhao S, Liu Z. MiR-96 downregulates RECK to promote growth and motility of non-small cell lung cancer cells. Mol Cell Biochem. 2014;390(1–2):155–160. doi:10.1007/s11010-014-1966-x.
- Zhang J, Kong X, Li J, Luo Q, Li X, Shen L, Chen L, Fang L. miR-96 promotes tumor proliferation and invasion by targeting RECK in breast cancer. Oncol Rep. 2014;31(3):1357–1363. doi:10.3892/or.2013.2934.
- Militello G, Weirick T, John D, Döring C, Dimmeler S, Uchida S. Screening and validation of lncRNAs and circRNAs as miRNA sponges. Brief Bioinform. 2017;18(5):780–788. doi:10.1093/bib/bbw053.
- Eissa S, Matboli M, Essawy N, Kotb Y. Integrative functional genetic-epigenetic approach for selecting genes as urine biomarkers for bladder cancer diagnosis. Tumour Biol. 2015;36(12):9545–9552. doi:10.1007/s13277-015-3722-6.
- Ahmed M, Mardaryev A, Lewis C, Sharov A, Botchkareva N. MicroRNA-21 is an important downstream component of BMP signalling in epidermal keratinocytes. J Cell Sci. 2011;124(Pt 20):3399–3404. doi:10.1242/jcs.086710.
- Zhu S, Wu H, Wu F, Nie D, Sheng S, Mo Y. MicroRNA-21 targets tumor suppressor genes in invasion and metastasis. Cell Res. 2008;18(3):350–359. doi:10.1038/cr.2008.24.
- Zhu S, Si M, Wu H, Mo Y. MicroRNA-21 targets the tumor suppressor gene tropomyosin 1 (TPM1). J Biol Chem. 2007;282(19):14328–14336. doi:10.1074/jbc.M611393200.