
ABSTRACT
Background: Circulating tumor cells (CTCs) and relevant autophagy Beclin-1 genes expression are critical biomarkers for tumorigenesis and tumor progress. Here we investigated the relationship of dynamic changes of CTCs and Beclin-1 expression of CTCs with renal cell carcinoma (RCC) prognosis.
Materials and methods: A total of 69 patients with RCC were enrolled and divided into two groups based on the postoperative status of distant metastasis, including metastasis-free group (n = 58) and metastatic group (n = 11). Demographic characteristics of each patient were recorded in detail. All 69 enrolled patients had received multiple CTC tests and peripheral blood samples were obtained at three different time points (1 day before operation, 6 months and 12 months after operation). Peripheral blood samples were drawn before each time point and CTCs were separated by using Can Patrol CTC enrichment technique. CTCs were divided into epithelial, mesenchymal and mixed phenotype based on different surface biomarkers. RNA in situ hybridization assay was used to detect the expression of Beclin1 gene.
Results: The percentages of epithelial, mesenchymal and mixed CTCs were 11.64%, 28.04% and 60.32%, respectively. There were no significant differences of initial CTCs counts between metastasis-free group (8.43 ± 5.15) and metastatic group (7.71 ± 3.82) (P > 0.05). As for metastatic group, the number of mixed CTCs at 12 months postoperatively was significantly higher than that of mixed CTCs preoperatively and 6 months postoperatively (P < 0.05). In the metastatic group, the number of Beclin1 positive CTCs was significantly higher than that of Beclin1 negative CTCs preoperatively (P < 0.05), moreover, there were several significantly changes of Beclin1 positive CTCs with different types and at different time points.
Conclusion: The recurrence or metastasis of RCC was uncorrelated with initial CTCs counts, but probably related with the variation trend of CTCs, especially mesenchymal CTCs and Beclin1 positive CTCs.
Keywords:
Introduction
Kidney cancer is one of the 10 most common cancers in both men and women, representing 3.7% of all adult malignancies, and renal cell carcinoma (RCC) is the most common form which is responsible for up to 85% of kidney cancer casesCitation1. Incidence predominates in men with the male-to-female ratio of 1.5:1, and peaks at age of 64 yearsCitation2. Although the 5-year relative survival rates have improved over the past several decades, the overall prognosis of RCC is still poor due to high risk of recurrence and metastasesCitation3. Distant metastases have been found in approximately 17% RCC patients at the time of diagnosisCitation2. Currently, the tumor, lymph node, metastasis (TNM) system has been recognized as one of the strongest prognostic systems in the clinical outcome of patients with RCCCitation4. The 5-year recurrence free-survival rate of stage I RCC patients exceeds 92%, whereas the risk of recurrence for stage II and III RCC is up to 40%Citation5. However, the TNM-based approach mainly evaluates cancer at a population level instead of a more “personalized” approach.
Circulating tumor cells (CTCs) are rare cancer cells released from tumors into the bloodstream which play an essential role in mediating cancer metastases. The CTCs counts have been associated with poor prognosis in many tumors, including breast, prostate and colorectal cancerCitation6. More importantly, the number of CTCs can provide real-time information on clinical behavior of tumors and individually predict clinical outcome for each patientCitation7. CTCs can undergo an epithelial-to-mesenchymal transition (EMT) which results in losing epithelial character and morph into a mesenchymal typeCitation8. Based on cell surface markers, CTCs can be generally classified into three subtypes, including epithelial CTCs (EpCAM, CK8, CK18 and CK19), mesenchymal CTCs (Vimentin, N-cadherin, SNAIL, Twist, ZEB1/2) and mixed CTCsCitation9. Generally, CTCs often exhibit combinations of epithelial and mesenchymal features, reinforcing the role of EMT in the process of cancer cell dissemination and implantation. In longitudinal studies of individual patients, the fraction of mesenchymal CTCs has been associated with the drug resistance and disease progressionCitation10. Some groups have reported that the presence of CTCs was correlated with lymph node status and metastases in RCCCitation11. However, the correlation between dynamic changes of CTCs and synchronous metastases is still controversial.
Besides CTCs enumeration, the further understanding of CTCs genetic expression can monitor clinical outcome more preciselyCitation12. Beclin-1, an autophagy associated gene, plays an important role in tumorigenesisCitation13. Nishikawa et al.Citation14 proved that autophagy associated gene Atg5 and Beclin1 were significant predictors of RCC recurrence after radical nephrectomy. However, Deng et al.Citation15 reported that RCC patients with low expression level of autophagy markers exhibited poor prognosis. Therefore, the correlation of Beclin-1 with CTCs in patients with RCC is still limited known.
In the present study, we retrospectively investigated 60 cases with RCC by using dynamic enumeration of CTCs. Different phenotypes and Beclin1 expression of CTCs were also analyzed in the prognosis and recurrence of RCC. The aim of this study was to identify the correlation between different phenotypic and genetic CTCs and clinical outcome of RCC.
Materials and methods
Study design and patients
This retrospective, single-center study was performed based on a protocol approved by the institutional review board at the Second Affiliated Hospital of Xi’an Jiaotong University and in accordance with the Good Clinical Practice (GCP) guidelines and the principles of the Declaration of Helsinki. We reviewed the medical records of adult patients with RCC who received the whole treatments in this hospital from June 2015 to May 2018 (N = 314). The inclusion criteria included patients with age larger than 18 years old, pathologically confirmed RCC, excluding preoperative existence of distant metastasis, having undergone radical or partial nephrectomy, receiving postoperative radiochemotherapy according to NCCN 2015 guidelines of kidney cancerCitation15, agreement with complete 12-month follow-up study for multiple CTC tests. The exclusion criteria included preoperative metastatic RCC, incomplete clinical evaluations, incomplete follow-up study, history of any urological surgery, receiving any treatments in other groups, benign final pathology or upper tract urothelial cell carcinoma, and severe psychological problems. Informed consent had been signed by all participants. This study was registered at Research Registry (UIN: research registry 3758).
Demographic and clinical characteristics
A total of 69 patients with RCC were enrolled in this study and they were divided into two groups based on the postoperative status of distant metastasis, including organ metastases (extra-kidney metastases and intra-kidney metastases) and bone metastases (cranial metastases, vertebral metastases, truncal bone metastases, and metastases in the extremities). 69 patients had been divided into metastasis-free group (n = 58) and metastatic group (n = 11). Demographic characteristics of each patient were recorded in detail, including gender, age, pathological type and grading, tumor diameter, renal score, TNM staging and surgical treatments were comprehensively analyzed. Furthermore, the tumor diameters and renal scores were compared between patients with and without distant metastasis.
Blood samples preparation and CTC detection
All 69 enrolled patients had received multiple CTC tests and peripheral blood samples were obtained at three different time points (1 day before operation, 6 months and 12 months after operation). Peripheral blood samples (7.5 ml, anticoagulated with EDTA) were drawn from all participants before each time point. Mononuclear cells (MNC) were isolated by adding erythrocyte lysis buffer (154 mM NH4Cl, 10 mM KHCO3 and 0.1 mM EDTA, Sigma, St. Louis, USA). After centrifugation (1500 rpm, 5 min), the blood samples were resuspended in PBS buffer. CTCs were separated by using Can Patrol CTC enrichment technique (SurExam, Guangzhou, China) according to detailed procedures provided by Wu et al.Citation16. Furthermore, CTCs were divided into epithelial, mesenchymal and mixed phenotype based on the morphological and biological biomarkers. Epithelial CTCs were detected with labeling epithelia markers, such as EpCAM, CK8, CK18 and CK19. Mesenchymal CTCs were tested by labeling mesenchymal markers, including Vimentin and Twist.
RNA in situ hybridization assay
The expression levels of Beclin-1, EpCAM, CK8, CK18, CK19, Vimentin and Twist were detected by RNA in situ hybridization technique. The detailed procedures were described as following. White blood cells were loaded into 24 wells cell culture plates. All cells were treated with proteinase. Subsequently, targeted gene genomic DNA sequences were detected with capture probes including preamplifier sequence, the amplifier sequence and the labeled probeCitation17. Epithelial markers EpCAM, CK8, CK18 and CK19 were labeled with Alexa Fluor 594. Mesenchymal markers Vimentin and Twist were labeled with Alexa Fluor 488. White blood cells were stained by Alexa Fluor 750 conjugated anti-CD45. Beclin1 gene was detected with Alexa Fluor 647 labeled capture probe. The capture probe sequence for Beclin-1 (5ʹ®3ʹ) was as follows: TCAAATCTCACCAGACGGACCTGTGAGTAAGTAGTGTCCACATCACCCTGTTGATTAGAGTGGACTGTACTGAAGGCAGAAGAAGGGTGGCTAGACAGAGGAGCTATTTCTCGGTGATACAAGTGTACACAGATGCCTGACACTGAAGCTCATGGCGAAT.
Capture probe sequences for the EpCAM, CK8/18/19, Vimentin and twist genes had been described by Wu et al.Citation16. Cell nucleus was stained with 4ʹ,6ʹ-diamidino- 2-phenylindole (DAPI) (Sigma, St. Louis, USA) for 5 min.
Statistical analysis
Statistical analysis was performed using Statistical Product and Service Solutions software (SPSS 19.0, Inc., Chicago). The results were presented as mean ± standard deviation (SD). Student’s t-test, one-way ANOVA and 2way ANOVA were applied for continuous data, and chi-square test for categorical data. As for non-normal distribution samples, Wilcoxon two sample test, Kruskal-Wallis test were used. A value of P < 0.05 was considered statistically significant.
Results
Demographic characteristics
A total of 69 patients (22 women and 47 men) with RCC were enrolled in this study and they were divided into two groups based on the postoperative status of distant metastasis, including metastasis-free group (n = 58) and metastatic group (n = 11). The mean time of recurrence or metastasis of metastatic group was 10.2 ± 3.5 months after initial surgical treatments. The mean age of all 69 patients was 57.5 ± 11.1 y (range, 27–82). The mean age of metastatic group (59.7 ± 7.8 y) was slightly higher than the mean age of metastasis-free group (57.1 ± 11.6 y), however, there were no significant differences between two groups (P > 0.05). The sex ratio of the whole patients was approximately 7 vs. 3 (Male vs. Female). As shown in , the most common pathological type of RCC in this study was clear-cell carcinoma (85.5%) and the main pathological grade was grade II (71.1%). There were no significant differences of pathological types and grading between metastasis-free group and metastatic group (P > 0.05). However, the percentage of T1 stage in metastatic group (27.3%) was significantly lower than that of metastatic-free group (63.6%) (P < 0.05) and the percentage of T2 stage in metastatic group (63.6%) was significantly higher than that of metastatic-free group (31.1%) (P < 0.05). Moreover, there were significant differences of surgical treatments between metastasis-free group (mainly partial nephrectomy, 70.7%) and metastatic group (mainly radical nephrectomy, 81.8%) (P < 0.05).
Table 1. Demographic characteristics of patients with RCC.
Furthermore, the tumor diameters and renal scores were compared between patients with and without distant metastasis. As shown in , the diameter of RCC in metastatic group (7.15 ± 1.78 cm) was significantly larger than that of metastasis-free group (4.64 ± 1.32 cm) (P = 0.002). Moreover, the renal score of metastatic group (9.91 ± 0.70, median 10) was significantly higher than that of metastasis-free group (7.58 ± 1.60, median 8) (P < 0.001).
Table 2. The tumor diameter and renal score in the metastasis-free group and metastatic group.
Initial ctcs counts
The numbers of three CTCs types were detected in all 69 patients before surgery. The initial number of CTCs in all 69 patients was 8.21 ± 4.77. As shown in , the percentages of epithelial, mesenchymal and mixed CTCs were 11.64%, 28.04% and 60.32%, respectively. As shown in , there were no significant differences of initial CTCs counts between metastasis-free group (8.43 ± 5.15) and metastatic group (7.71 ± 3.82) (P > 0.05). Moreover, the initial numbers of epithelial, mixed and mesenchymal CTCs in metastasis-free group were 0.91 ± 0.57, 5.20 ± 2.24 and 2.30 ± 1.41, respectively. The initial numbers epithelial, mixed and mesenchymal CTCs in metastatic group were 0.85 ± 0.46, 4.42 ± 2.35 and 2.42 ± 1.40, respectively. There were no significant differences of three types CTCs counts between two groups (P > 0.05).
Figure 1. Three types of CTCs in kidney cancers. Left panel showed the images of epithelial, mixed and mesenchymal CTCs. Epithelial CTCs presented only Alexa Fluor 594 (Red color) labeled epithelial markers (EpCAM and CK8/18/19), mesenchymal CTCs exhibited only Alexa Fluor 488 (Green color) labeled mesenchymal markers (Vimentin and Twist), and mixed CTCs having both epithelial and mesenchymal markers were stained with both green and red immunofluorescent dyes. Right panel showed the distribution of three CTCs types in kidney cancers.
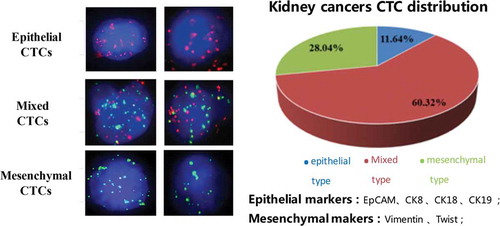
Figure 2. Initial CTCs counts in two groups before surgery.
Dynamic changes of ctcs counts
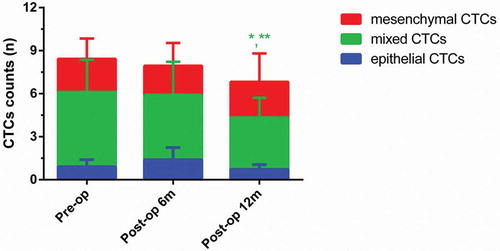
As shown in , at 6 months postoperatively, the numbers of epithelial, mixed and mesenchymal CTCs in metastatic group were 2.66 ± 1.78, 6.33 ± 3.03 and 2.66 ± 1.30, respectively. At 12 months postoperatively, the numbers of epithelial, mixed and mesenchymal CTCs in metastatic group were 2.20 ± 1.83, 9.80 ± 5.03 and 4.60 ± 2.39, respectively. As for metastatic group, the number of mixed CTCs at 12 months postoperatively was significantly higher than that of mixed CTCs preoperatively and 6 months postoperatively (P < 0.05). As shown in , at 6 months postoperatively, the numbers of epithelial, mixed and mesenchymal CTCs in metastasis-free group were 1.39 ± 0.84, 4.52 ± 2.30 and 2.02 ± 1.5840, respectively. At 12 months postoperatively, the numbers of epithelial, mixed and mesenchymal CTCs in metastasis-free group were 0.72 ± 0.33, 3.63 ± 1.37 and 2.47 ± 1.98, respectively. As for metastasis-free group, the number of mixed CTCs at 12 months postoperatively was significantly lower than that of mixed CTCs preoperatively and 6 months postoperatively (P < 0.05).
Figure 3. Dynamic changes of three CTCs types in the metastatic group. (Data were presented as mean ± SD and P < 0.05 was considered statistically significant. Pre-op: preoperatively, post-op 6m: 6 months postoperatively, post-op 12m: 12 months postoperatively. * P < 0.05 Post-op 12m vs. Pre-op; ** P < 0.05 Post-op 12m vs. Post-op 6m.).
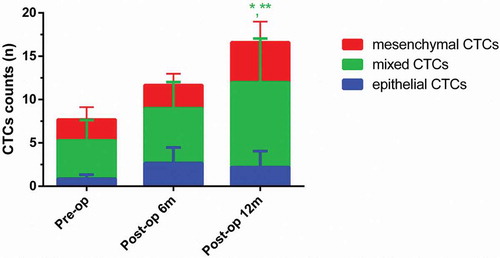
Figure 4. Dynamic changes of three CTCs types in the metastasis-free group. (Data were presented as mean ± SD and P < 0.05 was considered statistically significant. Pre-op: preoperatively, post-op 6m: 6 months postoperatively, post-op 12m: 12 months postoperatively. * P < 0.05 Post-op 12m vs. Pre-op; ** P < 0.05 Post-op 12m vs. Post-op 6m.).
The expression of beclin-1 in ctcs
RNA in situ hybridization assay was utilized for assessing Beclin-1 expression in CTCs (). As for all 69 patients, the number of Beclin1 positive mixed CTCs preoperatively was significantly higher than that of Beclin1 negative mixed CTCs preoperatively (P < 0.05) and the number of Beclin1 positive all CTCs preoperatively was significantly higher than that of Beclin1 negative all CTCs preoperatively (P < 0.05) (). In the metastatic group, the number of Beclin1 positive CTCs was significantly higher than that of Beclin1 negative CTCs preoperatively (P < 0.05). However, there were significant differences between numbers of Beclin1 positive CTCs and Beclin1 negative CTCs in the metastasis-free group (P > 0.05) ().
Figure 5. Beclin-1 expression in CTCs. Epithelial markers were labeled with Alexa Fluor 594 (Red color); mesenchymal markers were labeled with Alexa Fluor 488 (Green color); Beclin-1 marker was labeled by Alexa Fluor 647 (Purple color). Right panel showed the distribution of three CTCs types in kidney cancers.
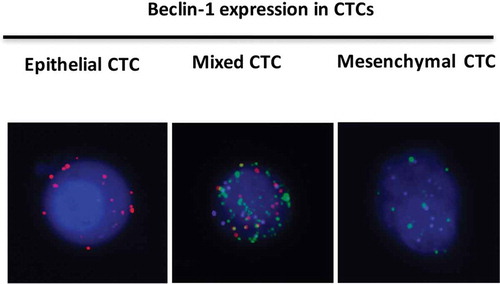
Figure 6. The expression of Beclin1 in different types of CTCs preoperatively. (Data were presented as mean ± SD and P < 0.05 was considered statistically significant. * P < 0.05 Beclin1 (+) mixed CTCs vs. Beclin1 (-) mixed CTCs; ** Beclin1 (+) all CTCs vs. Beclin1 (-) all CTCs).
Figure 7. The expression of Beclin1 in CTCs preoperatively in the metastasis-free group and metastatic group. (Data were presented as mean ± SD and P < 0.05 was considered statistically significant. * P < 0.05 Beclin1 (+) CTCs vs. Beclin1 (-) CTCs in the metastatic group).
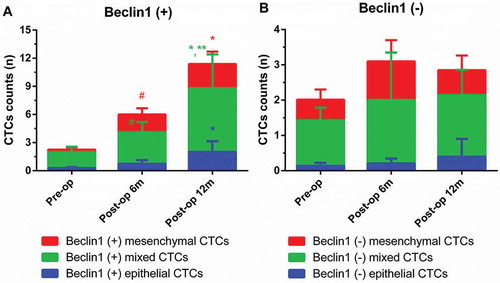
Furthermore, dynamic changes of Beclin1 expression in CTCs were investigated in metastatic group (). As for Beclin1 positive CTCs, the number of Beclin1 positive epithelial CTCs at 12 months postoperatively (2.00 ± 1.14) was significantly higher than that of Beclin1 positive epithelial CTCs preoperatively (0.25 ± 0.15) (P < 0.05); the number of Beclin1 positive mixed CTCs at 6 months postoperatively (3.43 ± 1.07) was significantly higher than that of Beclin1 positive mixed CTCs preoperatively (1.75 ± 0.55) (P < 0.05); the number of Beclin1 positive mixed CTCs at 12 months postoperatively (6.80 ± 3.61) was significantly higher than that of Beclin1 positive mixed CTCs preoperatively or at 6 months postoperatively (P < 0.05); the number of Beclin1 positive mesenchymal CTCs at 6 months postoperatively (1.86 ± 0.67) was significantly higher than that of Beclin1 positive mixed CTCs preoperatively (0.25 ± 0.19) (P < 0.05); the number of Beclin1 positive mesenchymal CTCs at 12 months postoperatively (2.60 ± 1.30) was significantly higher than that of Beclin1 positive mixed CTCs preoperatively (P < 0.05). As for Beclin1 negative CTCs, there were no significant differences within different types of CTCs at different time points (P > 0.05).
Figure 8. Dynamic changes of Beclin1 expression in CTCs in metastatic group. (Data were presented as mean ± SD and P < 0.05 was considered statistically significant. Pre-op: preoperatively, post-op 6m: 6 months postoperatively, post-op 12m: 12 months postoperatively. * P < 0.05 Post-op 12m vs. Pre-op; ** P < 0.05 Post-op 12m vs. Post-op 6m; # P < 0.05 Post-op 6m vs. Pre-op.).
Discussion
Kidney cancer is one of the most common cancers involving in adults and RCC is the most common form, representing approximately 85% of cases. Clear-cell, papillary and chromophobe are the most common solid renal cell carcinomas within the kidney and account for 85–90% of all renal malignanciesCitation18,Citation19. In the present study, the most common pathological type of RCC in this study was clear-cell carcinoma and the main pathological grade was grade II. Moreover, we reported that the diameter of RCC and renal score in metastatic group was significantly higher than that of metastasis-free group, indicating that the RCC diameter and renal score might be related with the recurrence or metastasis of RCC. Sunela et al.Citation20 also suggested that the relapses or distant metastasis occurred less frequently among patients with small tumors (≤ 3.0 cm).
Currently, the overall prognosis of RCC is still poor due to high risk of recurrence and metastases and distant metastases have been found in approximately 17% RCC patients at the time of diagnosisCitation2. The patients with RCC are often asymptomatic at the early stage of the disease. Therefore, early specific diagnostic marker is a critical factor for renal cancer treatment. Traditionally, TNM staging system can only evaluate prognosis of RCC at a population level instead of individually prediction. The CTCs counts have been associated with poor prognosis in many tumors and the number of CTCs can provide real-time information on clinical behavior of tumors and individually predict clinical outcome for each patientCitation6,Citation7. In this study, a combination of EpCAM, CK8, CK18 and CK19 was used as the surface marker of epithelial CTCs, which was more sensitive than using only EpCAM. Maertens et al.Citation21 reported that only EpCAM marker might lost many real RCC patients, since part of patients with RCC had low expression level or no expression of EpCAM. Liu et al.Citation22 indicated that double positive markers such as CA9 and CD147 could increase positive rate to 97.1%. We found that there were no significant differences of initial CTCs counts between metastasis-free group and metastatic group, indicating that the risk of recurrence or metastasis was uncorrelated with initial CTCs counts. However, according to the results of 12-month follow-up study, we found that the number of mixed CTCs at 12 months postoperatively was significantly different with that of mixed CTCs preoperatively and 6 months postoperatively in the both metastatic and metastasis-free group, indicating that the risk of recurrence or metastasis was correlated with dynamic changes of CTCs counts, especially the variation trend of mixed CTCs counts. Similarly, Rossi et al.Citation23 suggested that the presence of EpCAM-positive, live CTCs could predict progression in individual patient with metastatic RCC and the decrease of CTCs counts was found in non-progressed patients and higher CTCs values in the progressed group indicated a failure of treatment.
Beclin-1, an autophagy associated gene, plays an important role in tumorigenesisCitation13. Subsequently, the expression of autophagy-related gene Beclin1 was detected in CTCs of patients with RCC in order to further investigate the correlation between CTCs and the risk of recurrence or metastasis. The results of this study showed that the number of Beclin1 positive CTCs was significantly higher than that of Beclin1 negative CTCs preoperatively in the metastatic group, suggesting that the expression of Beclin1 might be associated with metastasis. Yang et al.Citation24 indicated that Beclin-1 regulated by miR-30a-5p played a notable role in the drug-resistance of small cell lung cancer, which contributed to tumor recurrence and metastasis, leading to treatment failure. Similarly, Nishikawa et al.Citation14 proved that autophagy associated gene Atg5 and Beclin1 were significant predictors of RCC recurrence after radical nephrectomy. Furthermore, we found that there were several significantly changes of Beclin1 positive CTCs with different types and at different time points, indicating that the variation trend of Beclin1 positive CTCs might be closely correlated with the risk of recurrence or metastasis. Zheng et al.Citation25 also reported that high expression level of Beclin1 in CTCs might enhance the ability of anti-apoptosis leading to the tumor recurrence or metastasis. Therefore, we suggested that the recurrence or metastasis of RCC was uncorrelated with initial CTCs counts, but probably related with the variation trend of CTCs, especially mesenchymal CTCs and Beclin1 positive CTCs.
There were still several limitations within this study, including insufficient number of enrolled patients, lack of long time period follow-up research, and not a prospective, randomized controlled trail. At present, this result may not be taken as an affirmative conclusion due to such limitations. More qualified cases will be very necessary to further confirm the correlation between initial CTCs counts and prognosis of RCC.
Conclusion
The recurrence or metastasis of RCC was uncorrelated with initial CTCs counts, but probably related with the variation trend of CTCs, especially mesenchymal CTCs and Beclin1 positive CTCs.
Disclosure of Potential Conflicts of Interest
No potential conflicts of interest were disclosed.
Acknowledgments
Thanks for the technical support from Dr. Chen Xiang (Department of Medicine, Pfizer).
References
- Barata PC, Rini BI. Treatment of renal cell carcinoma: current status and future directions. CA Cancer J Clin. 2017 Nov;67(6):507–524. doi:10.3322/caac.21411.
- Siegel RL, Miller KD, Jemal A. Cancer Statistics, 2017. CA Cancer J Clin. 2017 Jan;67(1):7–30. doi:10.3322/caac.21387.
- Choueiri TK, Motzer RJ. Systemic therapy for metastatic renal-cell carcinoma. N Engl J Med. 2017 Jan 26;376(4):354–366. doi:10.1056/NEJMra1601333.
- Amin MB, Greene FL, Edge SB, Compton CC, Gershenwald JE, Brookland RK, Meyer L, Gress DM, Byrd DR, Winchester DP. The eighth edition AJCC cancer staging manual: continuing to build a bridge from a population-based to a more “personalized” approach to cancer staging. CA Cancer J Clin. 2017 Mar;67(2):93–99. doi:10.3322/caac.21388.
- Janowitz T, Welsh SJ, Zaki K, Mulders P, Eisen T. Adjuvant therapy in renal cell carcinoma-past, present, and future. Semin Oncol. 2013 Aug;40(4):482–491. doi:10.1053/j.seminoncol.2013.05.004.
- Harouaka R, Kang Z, Zheng SY, Cao L. Circulating tumor cells: advances in isolation and analysis, and challenges for clinical applications. Pharmacol Ther. 2014 Feb;141(2):209–221. doi:10.1016/j.pharmthera.2013.10.004.
- Tseng JY, Yang CY, Liang SC, Liu RS, Jiang JK, Lin CH. Dynamic changes in numbers and properties of circulating tumor cells and their potential applications. Cancers. 2014 Dec 16;6(4):2369–2386. doi:10.3390/cancers6042369.
- Jackson JM, Witek MA, Kamande JW, Soper SA. Materials and microfluidics: enabling the efficient isolation and analysis of circulating tumour cells. Chem Soc Rev. 2017 Jul 17;46(14):4245–4280. doi:10.1039/c7cs00016b.
- Ankeny JS, Court CM, Hou S, Li Q, Song M, Wu D, Chen JF, Lee T, Lin M, Sho S, et al. Circulating tumour cells as a biomarker for diagnosis and staging in pancreatic cancer. Br J Cancer. 2016 Jun 14;114(12):1367–1375. doi:10.1038/bjc.2016.121.
- Lambert AW, Pattabiraman DR, Weinberg RA. Emerging biological principles of metastasis. Cell. 2017 Feb 9;168(4):670–691. doi:10.1016/j.cell.2016.11.037.
- Bluemke K, Bilkenroth U, Meye A, Fuessel S, Lautenschlaeger C, Goebel S, Melchior A, Heynemann H, Fornara P, Taubert H. Detection of circulating tumor cells in peripheral blood of patients with renal cell carcinoma correlates with prognosis. Cancer Epidemiol Biomarkers Prev. 2009 Aug;18(8):2190–2194. doi:10.1158/1055-9965.EPI-08-1178.
- Nel I, Gauler TC, Bublitz K, Lazaridis L, Goergens A, Giebel B, Schuler M, Hoffmann A-C, Wu M-H. Circulating tumor cell composition in renal cell carcinoma. PloS one. 2016;11(4):e0153018. doi:10.1371/journal.pone.0153018.
- Zhong Y, Wang QJ, Li X, Yan Y, Backer JM, Chait BT, Heintz N, Yue Z. Distinct regulation of autophagic activity by Atg14L and Rubicon associated with Beclin 1-phosphatidylinositol-3-kinase complex. Nat Cell Biol. 2009 Apr;11(4):468–476. doi:10.1038/ncb1854.
- Nishikawa M, Miyake H, Liu B, Fujisawa M. Expression pattern of autophagy-related markers in non-metastatic clear cell renal cell carcinoma: association with disease recurrence following radical nephrectomy. J Cancer Res Clin Oncol. 2015 Sep;141(9):1585–1591. doi:10.1007/s00432-015-1923-4.
- Motzer RJ, Jonasch E, Agarwal N, Beard C, Bhayani S, Bolger GB, Chang SS, Choueiri TK, Costello BA, Derweesh IH, et al. Kidney cancer, version 3.2015. J Natl Compr Cancer Network. 2015 Feb;13(2):151–159.
- Wu S, Liu S, Liu Z, Huang J, Pu X, Li J, Yang D, Deng H, Yang N, Xu J, et al. Classification of circulating tumor cells by epithelial-mesenchymal transition markers. PloS one. 2015;10(4):e0123976. doi:10.1371/journal.pone.0123976.
- Tsongalis GJ. Branched DNA technology in molecular diagnostics. Am J Clin Pathol. 2006 Sep;126(3):448–453. doi:10.1309/90BU6KDXANFLN4RJ.
- Perazella MA, Dreicer R, Rosner MH. Renal cell carcinoma for the nephrologist. Kidney Int. 2018 Apr 13;94:471–483. doi:10.1016/j.kint.2018.01.023.
- Capitanio U, Montorsi F. Renal cancer. Lancet. 2016 Feb 27;387(10021):894–906. doi:10.1016/S0140-6736(15)00046-X.
- Sunela KL, Lehtinen ET, Kataja MJ, Kujala PM, Soimakallio S, Kellokumpu-Lehtinen PL. Development of renal cell carcinoma (RCC) diagnostics and impact on prognosis. BJU Int. 2014 Feb;113(2):228–235. doi:10.1111/bju.12242.
- Maertens Y, Humberg V, Erlmeier F, Steffens S, Steinestel J, Bögemann M, Schrader AJ, Bernemann C. Comparison of isolation platforms for detection of circulating renal cell carcinoma cells. Oncotarget. 2017 Oct 20;8(50):87710–87717. doi:10.18632/oncotarget.21197.
- Liu S, Tian Z, Zhang L, Hou S, Hu S, Wu J, Jing Y, Sun H, Yu F, Zhao L, et al. Combined cell surface carbonic anhydrase 9 and CD147 antigens enable high-efficiency capture of circulating tumor cells in clear cell renal cell carcinoma patients. Oncotarget. 2016 Sep 13;7(37):59877–59891. doi:10.18632/oncotarget.10979.
- Rossi E, Fassan M, Aieta M, Zilio F, Celadin R, Borin M, Grassi A, Troiani L, Basso U, Barile C, et al. Dynamic changes of live/apoptotic circulating tumour cells as predictive marker of response to sunitinib in metastatic renal cancer. Br J Cancer. 2012 Oct 9;107(8):1286–1294. doi:10.1038/bjc.2012.388.
- Yang X, Bai F, Xu Y, Chen Y, Chen L. Intensified beclin-1 mediated by low expression of mir-30a-5p promotes chemoresistance in human small cell lung cancer. Cell Physiol Biochem. 2017;43(3):1126–1139. doi:10.1159/000481754.
- Zheng B, Zhu H, Gu D, Pan X, Qian L, Xue B, Yang D, Zhou J, Shan Y. MiRNA-30a-mediated autophagy inhibition sensitizes renal cell carcinoma cells to sorafenib. Biochem Biophys Res Commun. 2015 Apr 3;459(2):234–239. doi:10.1016/j.bbrc.2015.02.084.