
ABSTRACT
Nontumour cells in the tumour microenvironment, especially fibroblasts, contribute to tumour progression and metastasis. The occurrence and evolution of colorectal cancer (CRC) is closely related to cancer-associated fibroblasts (CAFs). The aim of this work was to evaluate the effects of the growth factors and cytokines secreted by CAFs on CRC progression. The secreted cytokines were examined in CAFs by Human Cytokine Antibody array. We screened 37 differentially secreted cytokines in the culture supernatants of CAFs and NFs. CLEC3B, attractin, kallikrein 5 and legumain were selected for further verification. CLEC3B was more highly expressed in the stroma of CRC tissues than the other 3 cytokines. Immunohistochemistry revealed that CLEC3B expression was associated with serosal invasion by CRC. Patients with co-expression of CLEC3B and α-SMA had worse survival outcomes than those with only CLEC3B or α-SMA expression. CLEC3B secreted from CAFs may promote tumour migration. Knockdown of endogenous CLEC3B in CAFs markedly decreased CRC cell migration, while recombinant human CLEC3B clearly promoted CRC cell migration and actin remodelling. In conclusion, our findings suggest that CAFs promote the CRC cell migration and skeletal reorganization by secreting CLEC3B. CLEC3B might be a potential therapeutic molecule for CRC treatment.
Introduction
Colorectal cancer (CRC) is one of the most common cancers worldwide, with approximately 1.2 million new cases each year. Although recent improvements in surgery and chemotherapy underlie the increased survival of patients with primary CRC, the patient survival rate worsens once metastasis and relapse of CRC occur.Citation1–Citation3 To improve survival for CRC patients, efforts to elucidate the invasion and metastasis mechanisms of CRC are still imperative. In early cancer research, most researchers focused on cancer cells alone. However, recent studies have indicated that tumour growth and metastasis are determined by both tumour cells and stromal cells.Citation4–Citation6 Thus, furthering our understanding of the role of tumour stromal cells in CRC will help to elucidate how the tumour microenvironment contributes to the growth and metastasis of CRC.
The tumour microenvironment plays an important role in tumour progression. The tumour microenvironment is a complex tissue environment comprising the extracellular matrix (ECM) and various types of stromal cells, such as macrophages, inflammatory cells, cancer-associated fibroblasts (CAFs), and mesenchymal stem cells.Citation6–Citation10 CAFs are actively involved in tumourigenesis.Citation11,Citation12 Importantly, many studies have highlighted a pro-tumourigenic role for CAFs via the secretion of various growth factors, cytokines, and chemokines and the degradation of ECM proteins.Citation13,Citation14 All of these microenvironmental factors, especially CAFs, make tremendous contributions to tumour growth and metastasis by secreting growth factors and cytokines such as MMP9, TGFβ, CXCL12, and IL-6.Citation15–Citation18 Their roles consist of creating a structural matrix around cancer cells, favouring a variety of tumour-specific mechanisms such as the epithelial–mesenchymal transition, and stimulating the production of proteases that can degrade adjacent tissues, thereby increasing the likelihood of tumour development, invasion, and metastasis.Citation19 Although several reports have focused on the contribution of CAFs to CRC progression, the molecular basis of this contribution has not been fully elucidated.
In the present study, we established primary fibroblasts from fresh surgical CRC specimens (CAFs) and adjacent normal mucosal tissues (NFs) and analysed the features of these fibroblasts in terms of the proliferation and migration of CRC cells to investigate the cytokines that are secreted from CAFs.
Results
CAFs are associated with human CRC progression
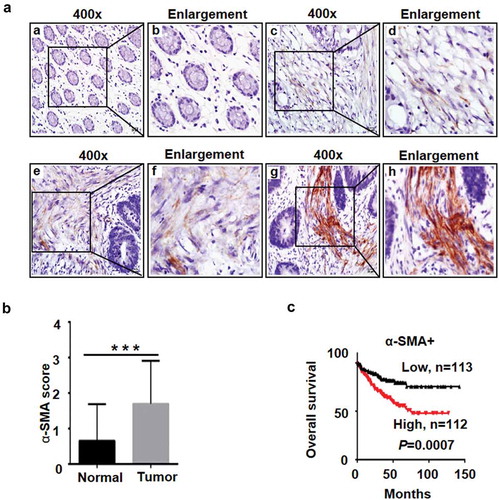
α-Smooth-muscle actin (α-SMA) has been reported to be a typical marker of activated CAFs, and α-SMA is only expressed in CAFs, not in NFs. To further distinguish the features of CAFs, immunohistochemistry (IHC) for α-SMA was performed, and the results showed that α-SMA protein was located in CRC stromal cells and that the expression of α-SMA increased markedly in 62% (58/93) of CRC tumour tissue compared with adjacent nontumour tissue (). As summarized in , the results of the correlation between α-SMA expression and the clinicopathological features of CRC revealed that high α-SMA expression was significantly associated with serosal invasion (P = 0.040) and lymph node metastasis (P < 0.001). In addition, Kaplan-Meier survival analysis indicated that patients with high expression of α-SMA had short overall survival times (). These data suggest that α-SMA-positive CAFs play an important role in CRC invasion and metastasis as well as in patient survival.
Table 1. Correlation between the clinicopathological features and α-SMA expression.
Figure 1. The levels of α-SMA expression in CRC tissues by IHC.
a, Representative images of α-SMA expression in normal intestinal epithelial and CRC specimens examined by IHC. α-SMA was negatively (a, b) or weakly expressed in normal intestinal mucosa but positively expressed in CRC stromas (c and d display weak signals, e and f display moderate signals, and g and h display strong signals.). b, IHC of α-SMA in CRC tumour tissues versus nontumour tissues. Mean ± SD, N = 93, ***P < 0.001 compared with the α-SMA score in normal tissue. c, Kaplan-Meier analysis of α-SMA expression with overall survival data for CRC from GSE17538 in the GEO database.
Characterization of CAFs from fresh CRC tissues
We successfully isolated CAFs and NFs from CRC tissues and their normal counterparts, respectively. α-SMA protein was highly expressed in CAFs and located in the CAF cytoplasm, while α-SMA protein expression was negative in NFs ().
Figure 2. The cell cycle distributions of CAFs and NFs.
a, Fibroblasts were isolated from human CRC tissues and normal counterparts, and the expression of α-SMA protein, a marker of CAFs, was examined by immunofluorescence staining. b, the expression of α-SMA protein in NFs and CAFs was detected by immunocytochemistry. The expression of α-SMA protein was higher in CAFs than in NFs. c, Representative histograms depicting the cell cycle profiles of the indicated cells. Cells were stained with PI and analysed by flow cytometry. D. Proportion of cells in various phases of the cell cycle. SD from 3 independent experiments. * P < 0.05; ** P < 0.01.
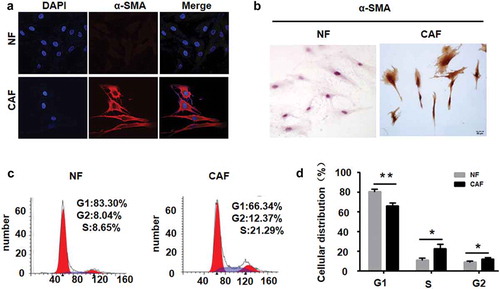
The results of flow cytometry showed that the percentages of CAFs in the S phase and G2 phase were higher than those of NFs in these phases (P < 0.05). This result indicated that CAFs from CRC tissues had stronger proliferative activity than NFs from nontumour tissues ().
CAFs promote CRC cell proliferation and migration
To determine the role of CAFs in CRC tumourigenesis and progression, we established a co-culture system of CAFs and CRC cell lines SW480 and SW620. The results of the CCK8 proliferation assay showed that compared with the medium and NF groups, CAFs significantly promoted the proliferation of SW480 and SW620 cells (), suggesting that CAFs may play a role in promoting CRC cell growth.
Figure 3. CAFs promote CRC cell proliferation and migration.
a, SW480 and SW620 cells were co-cultured with NFs (SW480/NF, SW620/NF), CAFs (SW480/CAF, SW620/CAF), or medium (SW480/Med, SW620/Med). CAFs promoted the proliferation of SW480 and SW620 cells as measured by CCK8 assay. ***P < 0.001 compared with the SW480/Med group (day 4) and SW620/Med group (day 5 and day 6). **P < 0.01 compared with the SW480/Med group (day 2, day 3, day 5 and day 6) and SW620/Med group (day 3 and day 4); N = 3. b-c, CAFs markedly increased the migration of SW480 and SW620 cells as measured by transwell migration assays. *P < 0.05; **P < 0.01; N = 3. Each bar represents the mean ± SD of three independent experiments.
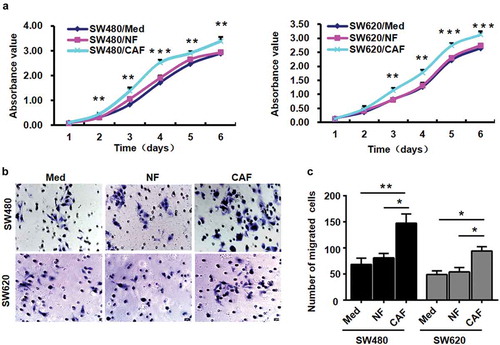
Since CAFs were associated with CRC invasion and metastasis, we investigated whether CAFs affected the migration of CRC cell lines SW480 and SW620 by transwell migration assay. As shown in , compared with the control group, CAFs markedly increased the migration of SW480 and SW620 cells, indicating that CAFs may increase the migration potential of CRC cells.
Characterization of the secretomes of CAFs and NFs isolated from CRC tissues and paired nontumour tissues
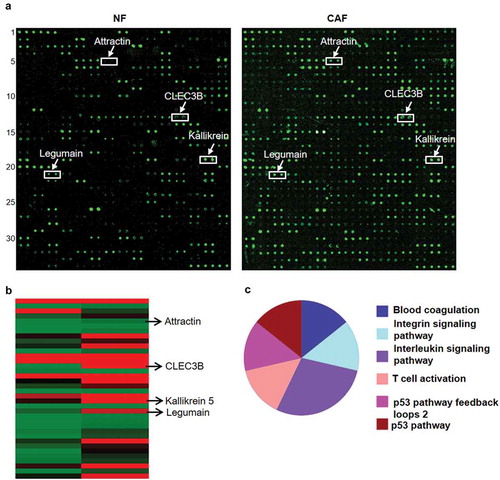
CAFs make tremendous contributions to tumour growth and metastasis by secreting growth factors and cytokines, and CAFs increase CRC cell proliferation and migration in vitro. To identify some cytokines that might be involved in the enhancement of CRC cell growth and metastasis, we collected the supernatants of CAFs and NFs isolated from 3 cases of fresh CRC tissues and paired nontumour tissues for cytokine chip analysis (). Compared with NFs, CAFs showed upregulation of 34 cytokines and downregulation of 3 cytokines ( and ). The signalling pathway analyses were performed with Protein Analysis Through Evolutionary Relationships (PANTHER) Software and revealed that the 37 cytokines identified above were involved in blood coagulation, integrin signalling pathway, the interleukin signalling pathway, T cell activation and p53 pathways (). Of the differentially expressed cytokines, there is little knowledge regarding 4 cytokines, namely, CLEC3B, attractin, kallikrein 5 and legumain. Therefore, we selected them for further validation.
Table 2. The differential cytokines in culture supernatant between CAF and NF.
Figure 4. Chemokine expression in conditioned medium from CAFs and normal fibroblasts.
a, signalling pathways affected in CAFs. The cytokines that were differentially expressed CAFs and NFs were detected with RayBio® human biotin-label-based cytokine antibody arrays. a, A representative image of a chemokine microarray after screening of conditioned medium from CAFs and NFs. The white arrows indicate the most deregulated cytokines in CAFs and NFs. b, Heat map of the 37 differentially expressed secreted cytokines. c, the pie chart for the signalling pathway analysis was generated with Protein Analysis Through Evolutionary Relationships (PANTHER) Software.
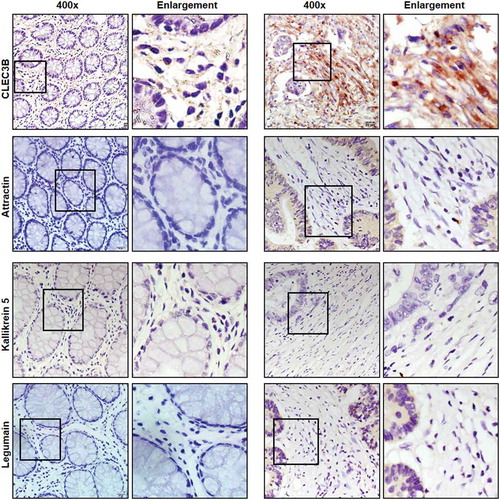
Immunohistochemical staining was performed to validate the expression of the four selected candidate stromal biomarkers, namely, CLEC3B, attractin, kallikrein 5 and legumain, in the CRC samples. Only CLEC3B was strongly expressed in the CRC stroma, with little or no expression in the normal colon mucosa (). The expression of attractin and legumain was more intense in tumour cells than in the stroma. Kallikrein was not detected in either the tumour or the stroma.
Figure 5. Validation of stromal biomarkers CLEC3B, attractin, kallikrein and legumain in patients with CRC.
Immunohistochemical staining of CRC and normal colorectal mucosa using antibodies against CLEC3B, attractin, kallikrein and legumain.
CAFs promote CRC cell migration by secreting CLEC3B
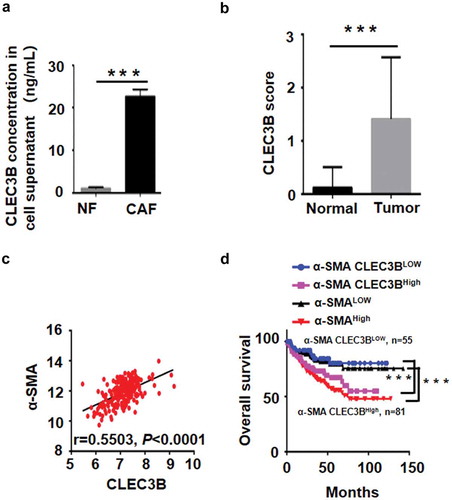
To further determine whether CLEC3B promotes the malignant progression of CRC, we analysed the cell supernatants of CAFs and NFs by ELISA. The secreted levels of CLEC3B in CAF supernatants from 8 cases were significantly higher than those in paired NF supernatants (). The IHC results showed that CLEC3B expression levels were significantly higher in CRC tumour stroma than in adjacent normal tissues (). Moreover, analysis of the clinicopathological characteristics of all 93 tissue samples showed that CLEC3B levels were closely associated with tumour serosal invasion (P = 0.009, ). Pearson analyses revealed closely positive correlations between the expression of α-SMA and CLEC3B (). When α-SMA and CLEC3B were combined, patients with higher expression of α-SMA and CLEC3B had worse survival (). Accordingly, we hypothesized that CLEC3B+ CAFs that accumulated in the tumour stroma promoted tumour invasion, resulting in poor survival.
Table 3. Correlation between the clinicopathological features and CLEC3B expression.
Figure 6. CLEC3B secreted by CAFs promotes CRC progression.
a, CLEC3B expression in the supernatant was measured by ELISA. The CLEC3B protein levels in the supernatants of 8 CAFs were significantly higher than those in the supernatants of 8 NFs, ***P < 0.001. b, IHC of CLEC3B in CRC tumour tissues versus nontumour tissues. ***P < 0.001 compared with the CLEC3B score in normal tissue. c, The correlation between α-SMA and CLEC3B in the GSE17538 data of the GEO database. d, Kaplan-Meier analysis of concurrent α-SMA and CLEC3B expression with overall survival in CRC in the GSE17538 data of the GEO database.
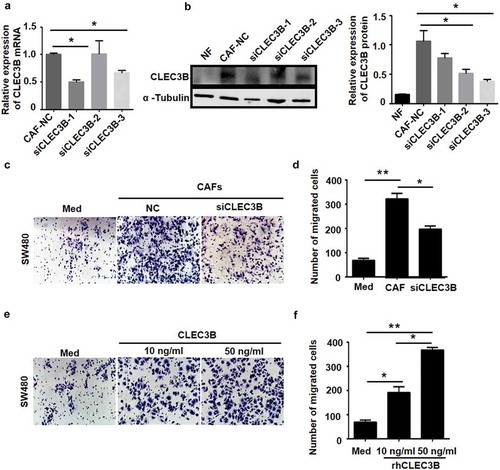
To further determine whether the altered CLEC3B level in CAFs was related to CRC cell migration, we knocked down endogenous CLEC3B in CAFs using siRNA specifically targeting CLEC3B (). The results of the transwell assay demonstrated that compared with the medium control cells, CAFs markedly increased SW480 cell migration, while silencing CLEC3B expression in CAFs markedly decreased SW480 cell migration (). Recombinant human CLEC3B (rhCLEC3B) was added to the medium of SW480 cells, and the results demonstrated that compared with the control cells, the rhCLEC3B-treated SW480 cells exhibited obvious migration with increasing concentrations of CLEC3B (). These data suggest that CLEC3B secreted from CAFs promote CRC cell migration.
Figure 7. CLEC3B secreted by CAFs promotes CRC cell migration.
a-b, RNAi silencing of CLEC3B in siRNA-transduced CAFs. qRT-PCR and western blotting assays were used to determine silencing efficiency, and α-tubulin was used as the loading control. siCLEC3B-3 showed the highest silencing efficiency, *P < 0.05 compared to the negative control (NC) group. c-d, Silencing of CLEC3B in CAFs markedly decreased SW480 cell migration as measured by transwell migration assays (left). Each bar represents the mean ± SD of three independent experiments (right). (e-f) Transwell migration assays for SW480 cells treated with rhCLEC3B at different concentrations (10 ng/ml and 50 ng/ml) added to the culture medium in the lower chambers (left). Each bar represents the mean ± SD of three independent experiments (right). *P < 0.05 and **P < 0.01.
CLEC3B mediates actin remodelling in CRC cells
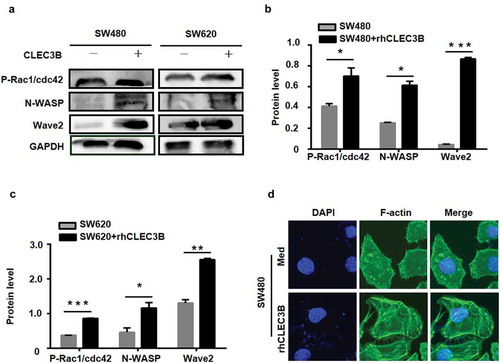
We examined the expression of proteins involved in actin nucleation and polymerization and found that the expression of P-Rac1/Cdc42, N-WASP and Wave2 increased in SW480 and SW620 cells treated with rhCLEC3B, compared with control cells (). Confocal microscopy showed that treatment with rhCLEC3B modestly increased the expression level of F-actin and triggered actin cytoskeleton rearrangement in SW480 cells compared with control cells (). These results suggest that CAFs promote actin remodelling by secreting CLEC3B.
Figure 8. CLEC3B mediates actin remodelling in CRC cells.
a, the expression of cytoskeletal proteins in SW480 and SW620 cells treated with rhCLEC3B was detected by western blotting. b-c, Quantification of protein expression normalized to GAPDH. *P < 0.05, **P < 0.01 and ***P < 0.001 compared with the control group. d, Confocal microscopy of F-actin staining in SW480 cells treated with rhCLEC3B at a concentration of 50 ng/ml.
Discussion
Whether in normal colorectal tissues or CRC tissues, fibroblasts constitute a major cell type in the tissue microenvironment and contribute to tissue remodelling in development and tissue homeostasis by providing structural scaffolding and growth regulatory mediators.Citation20 NFs are separated from normal colorectal tissues and spread throughout the lamina propria adjacent to the colorectal mucosal epithelium. NFs are in a resting state and are negative for α-SMA.Citation21 Fibroblasts of the tumour stroma are known as CAFs. CAFs are the main cellular constituents of stroma associated with primary and metastatic CRC. In this study, by using α-SMA as a marker to identify CAFs, we identified differentially expressed genes in CAFs that were primarily cultured from human CRC specimens compared with NFs from normal/non-malignant colorectal tissue obtained from surgical resections. Flow cytometry analysis showed that the percent of CAFs in the S phase was higher than that of NFs in the S phase, indicating that CAFs were proliferatively active and that NFs, which were α-SMA negative, were in a resting state.
CAFs are also linked to the occurrence, development and prognosis of malignant tumours. However, the role of CAFs in CRC development has not been fully elucidated. In this study, IHC results showed that CAF infiltration was strongly increased in CRC tissues compared with normal colorectal mucosa. These observations prompted us to further explore the roles of CAFs in regulating the occurrence and evolution of CRC. We analysed the correlation between the presence and distribution of CAFs and the clinicopathological features of CRC patients, and the results suggested that CAFs played an important role in CRC invasion and metastasis. Moreover, consistent with these findings, both the colony size and number of HCT116 cells have been shown to be significantly larger when cultured with CAFs than when cultured with NFs in a three-dimensional co-culture system.Citation22 This previous finding is supported by our observation that in an in vitro co-culture system comprising CAFs and SW480 or SW620 CRC cells, CAFs play an important role in CRC progression by promoting SW480 or SW620 CRC cell proliferation and migration.
These observations prompted us to explore the specific mechanism of CAF-induced CRC cell migration. Previous studies have shown that CAFs make tremendous contributions to tumour growth and metastasis by secreting growth factors and cytokines. For example, CAFs can secrete epidermal growth factor (EGF), hepatocyte growth factor (HGF), fibroblast growth factor (FGF)-1, and vascular endothelial growth factor (VEGF), which mediate cell proliferation, anti-apoptosis activity, cytoskeletal rearrangements, and cell invasion.Citation23–Citation26 However, the role of CAFs in CRC development has not been fully elucidated. In the present study, to identify some cytokines that might be involved in the enhancement of CRC cell growth and metastasis, we collected the supernatants of CAFs and NFs isolated from fresh CRC tissues and paired nontumour tissues, respectively, for cytokine chip analysis. Interestingly, the cytokine chip results showed that CLEC3B levels were much higher than those of other cytokines, suggesting that CLEC3B secreted by CAFs may be involved in the occurrence and progression of CRC.
CLEC3B, also known as tetranectin (TN), is a plasminogen-kringle-4-binding protein that is detected in various endocrine tissues and in epithelial and mesenchymal cells, including fibroblasts, monocytes, and neutrophils.Citation27,Citation28 Studies have shown that abnormal CLEC3B expression plays an important role in tumourigenesis and metastasis in gastric adenocarcinoma, breast cancer, cervical cancer, ovarian cancer, carcinoma of the urinary bladder, and melanoma.Citation29–Citation34 Additionally, CLEC3B can be detected in the serum, in the stroma and in tumour cells of different tumour types, with varying distribution patterns. In breast cancer, CLEC3B was found to exhibit mainly cytoplasmic staining, while in other tumours, CLEC3B expression was predominantly or even completely restricted to the tumour stroma. However, the role of CLEC3B in CRC development has not been fully elucidated. CLEC3B has a specific affinity for the kringle-4 region of plasminogen (Plg), which is a key component of the plasminogen activator system (PAS). The PAS can degrade the ECM and participate in tumour cell infiltration and metastasis. Therefore, we examined the role of CLEC3B secreted by CAFs in CRC development. Knockdown of endogenous CLEC3B in CAFs markedly decreased CRC cell migration, suggesting that CLEC3B played an important role in CRC progression. Conversely, recombinant human cytokine CLEC3B clearly promoted CRC cell migration and actin remodelling. Most importantly, CLEC3B expression was associated with tumour serosal invasion by CRC. These observations indicated that CLEC3B may serve as a valuable biomarker for CAF-based monitoring of CRC development in humans.
In summary, our study provides the first proof that CLEC3B+ CAFs, a main component of the tumour stroma, play an important role in the occurrence and progression of CRC. Furthermore, CLEC3B secreted from CAFs mediates actin remodelling in CRC cells. However, the results did not validated how CLEC3B interacted with CRC cells. So, the regulatory mechanism of CLEC3B on the target CRC cells will need to be investigated in detail.
Materials and methods
Clinical specimens
A total of 93 archived, formalin-fixed paraffin-embedded human CRC specimens were collected from the department of pathology, Nanfang Hospital, Southern Medical University, China. All of these cases were clinically and histologically diagnosed as CRC. The disease stage was determined according to the tumour size, lymph node involvement and distant metastasis classification system. The patients comprised 56 males and 37 females, ranging in age from 27 to 76 years (mean, 56 years).
Tumour specimens or normal colorectal samples were collected using a standard surgical technique. The study was approved by the ethics committee of Nanfang Hospital, Southern Medical University, China. Before using these clinical materials for research purposes, we obtained informed consent from all patients. None of the patients had received any preoperative chemotherapy or radiotherapy.
Primary cell culture
Fresh colorectal cancer tissues and their paired normal colorectal mucosa counterparts were cut up with sterile scissors and then dissociated enzymatically using type IV collagenase (1.5 mg/ml, Sigma, C5138) and hyaluronidase (0.5 mg/ml, Sigma, H1115000). The homogenized tissues were passed through a narrow fire-polished Pasteur pipette and 40-μm cell strainer to generate single-cell suspensions. Primary cells were then plated at a density of 1 × 10Citation5 viable cells in 25-cm2 adherent flasks in DMEM (Gibco, 11965–092) containing 20% foetal bovine serum (FBS) (Gibco, 10100147) in 5% CO2 at 37°C. After cell adherence for 2 h (most were macrophages), the supernatant was moved to another 25-cm2 adherent flasks for continued adherence. Finally, CAFs and NFs were obtained.
Cell culture
The human CRC cell lines (SW480 and SW620, derived from asurgical specimen of a primary colon adenocarcinoma and alymph node metastasis of the same patient.) were initially purchased from American Type Culture Collection (ATCC, 61926859 and 61867814). SW620 and SW480 cells were cultured in RPMI 1640 medium (Gibco, 11875–119) containing 10% FBS.
Immunocytochemistry (ICC) and immunohistochemistry (IHC) staining
Cultured primary cells were grown on glass coverslips and fixed in 4% paraformaldehyde. Sections of colorectal tumours (T) and normal mucosa (N) were fixed in 4% paraformaldehyde and embedded in paraffin. The sections were submerged in EDTA antigen-retrieval buffer and microwaved. Slides were blocked with peroxidase blockers and subsequently incubated with primary antibodies, namely, anti-α-SMA (Proteintech, AF1032) or anti-CLEC3B (Abcam, ab108999), at 4°C overnight. After washing, the slides were sequentially incubated with immuno-Detector Biotin-Link and immuno-Detector HRP label for 10 min each. Staining was completed with diaminobenzidine (DAB), and sections were restained with haematoxylin.
Immunohistochemical evaluations of α-SMA and CLEC3B were performed by light microscopy. The stained slides were evaluated semi-quantitatively, as reported previously. In brief, tumour and stromal cell staining was assessed as 0 = negative or weak immunostaining in <1% of the stroma, 1 = focal expression in 1–10% of the stroma, 2 = positive in 11–50% of the stroma, or 3 = positive in 51–100% of the stroma. These evaluations were performed for the entire tumour area, and scores of 2–3 were defined as positive for our analysis.Citation35
Immunofluorescence staining
For immunofluorescence staining, cultured cells or frozen tissue sections were fixed with 4% paraformaldehyde for 30 min and permeabilized with 0.5% Triton X-100 for 10 min at room temperature. The cells and tissue sections were then incubated with primary antibodies at 4°C overnight followed by washing with PBS and incubation with fluorescent secondary antibodies in the dark at room temperature for 1 h. The sections were mounted using an anti-fade mounting solution containing 4,6-diamidino-2-phenylindole (DAPI). The staining was examined, and images were captured using an Olympus Confocal laser scanning microscope FV1200.
Bioinformatics analysis of overall survival of CRC patients
GSE17538 data were used to analyse the correlation between the expression of genes of interest and the overall survival of patients. The chip platform was the Affymetrix Human Genome U133 Plus 2.0 Array. The expression values of the genes in this study were extracted from the expression profiling data. The expression values of the genes in this study were sorted from low to high, and the genes were divided into low and high expression groups. Thus, each group had expression values for 113 cases. Then, the survival rates of the two groups were analysed with the Kaplan-Meier method to obtain survival curves.
Human cytokine antibody arrays
Serum-free conditioned media from CAFs and NFs were collected following incubation for 24 h and filtered through a 0.22-μm mesh. Culture supernatants were added to antibody arrays against 493 unique cytokines (RayBio, AAH-BLG-493) and processed according to the manufacturer’s protocol. The array slides were also scanned by GenePix 4000B, and the data were calculated by GenePix Pro 6.0. Significantly changed cytokines (P < 0.05) were over 2.0-fold upregulated or 0.5-fold downregulated, and when the value of the signal in NFs or CAFs was greater than 200, the cytokine was included.
Enzyme-linked immunosorbent assay (ELISA)
Cell supernatants were separated by centrifugation at 2,000 g for 15 min at 4°C and immediately stored in aliquots at 80°C. The concentrations of cytokine CLEC3B were determined by ELISA using commercially available kits (Huamei Biotech, CSB-EL005531HU) according to the manufacturer’s instructions. Briefly, flat-bottomed 96-well microtiter plates were coated with anti-cytokine antibody and incubated overnight. The optical density was measured on a plate reader at 490 nm. The results were expressed in pg/ml or ng/ml, and the optical density of the samples was compared with the standard curves.
Cell cycle analysis
Cell cycle distributions were examined by measuring the cellular DNA content using flow cytometry. Cells at 80–90% confluence were synchronized for 36 h in RPMI-1640 medium containing 0.5% FBS and then released by culturing in RPMI-1640 medium containing 10% FBS for 12 h. A total of 1 × 10⁶ cells were collected and fixed with 70% cold ethanol. After treatment with RNase A (10 μg/mL) for 30 min at 37°C, the cells were resuspended in 0.5 ml of propidium iodide (PI) solution (50 μg/mL in 0.1% sodium citrate with 0.1% NP-40). Cell cycle distributions were analysed by FACScan cytometry (BD Bioscience).
Cell proliferation assay in vitro
SW480 cells and SW620 cells co-cultured with NFs or CAFs were harvested by trypsinization after 48 h. Cells were seeded in 96-well plates at 1 × 10Citation3/well and incubated for 1, 2, 3, 4, 5 or 6 days. Cell proliferation was evaluated using Cell Counting Kit-8 (CCK-8, Dojindo, CK04) according to the manufacturer’s instructions. Briefly, 10 μl of CCK-8 solution was added to culture medium and incubated for 2 h. The absorbance at 450 nm was measured with a reference wavelength of 650 nm. All experiments were repeated three times.
In vitro cell migration assay
SW480 and SW620 cells in serum-free medium (200 μl containing 1 × 10Citation5 cells) were added to the top chambers of transwells (Corning Star, 353097) with 8-mm pore sizes. The bottom chamber was seeded with NFs or CAFs containing in medium containing 10% FBS as a chemoattractant. The cells were incubated at 37°C for 36 h to allow migration. Cells that had migrated through the membrane and attached to the lower surface of the membrane were stained using a fixative/staining solution containing 0.1% crystal violet, 1% formalin and 20% ethanol for visualization and quantified under a microscope. The experiments were repeated three times.
RNA interference
The siRNAs targeting human CLEC3B were screened to determine the optimum sequence. The sequence (sense: 5-ACG GCA AGU GGU UCG ACA ATT-3, anti-sense: 5-UUG UCG AAC CAC UUG CCG UTT-3) targeting human CLEC3B was tested and used in our experiments. All siRNA nucleotides were synthesized using 2ʹ-O-ACE phosphonamidites (GenePharma Co.). CAFs were transfected with siRNA with Lipofectamine 3000. The knockdown efficiency was confirmed by real-time PCR (RT-PCR) and western blotting.
RNA extraction and quantitative real-time PCR
Total RNA of CAFs was extracted using TRIzol reagent (Takara, 9109) according to the manufacturer’s instructions. RNA was reverse transcribed to cDNA with a Reverse Transcription Kit (Takara, D6110A). Quantitative RT-PCR (qRT-PCR) analysis was performed using SYBR Green Master Mix (Takara, RR420), and the analysis was performed in triplicate. The results were normalized to the expression of GAPDH. The CLEC3B primers were (forward) 5′-CCC AGA CGA AGA CCT TCC AC-3′ and (reverse) 5′-CGC AGG TAC TCA TAC AGG GC-3′.
Western blotting
Proteins were lysed in RIPA buffer (KeyGen Biotech, KGP702-100) containing 100 mmol/L phenyl methane sulfonyl fluoride (PMSF) and quantified by bicinchoninic acid (BCA) protein quantitative assay (KeyGen Biotech, KGP902). Protein lysates were separated using 10% SDS-PAGE and transferred onto PVDF membranes (Roche, 3010040001). Then, the membranes were incubated with specific antibodies against CLEC3B, P-Rac1/cdc42, N-WASP and Wave2 (Cell Signaling Technology, 8606T) followed by incubation with the appropriate second antibodies. Finally, the membranes were visualized using an enhanced chemiluminescence (ECL) detection system (KeyGen Biotech, KGP1123) according to the manufacturer’s instructions. The results were normalized to the expression of α-tubulin or GAPDH (Proteintech, 10494–1).
Statistical analysis
SPSS version 13.0 was used for all statistical analyses. Comparisons between groups for statistical significance were performed with a 2-tailed paired Student’s t-test. A chi-square test was utilized to analyse the correlation between the clinicopathological features of CRC and α-SMA or CLEC3B expression. Cell proliferation and migration in vitro were compared using one-way ANOVA. Survival curves were plotted using the Kaplan-Meier method and compared with the log-rank test. A P value < 0.05 was considered statistically significant.
Compliance with ethical standards
Conflict of interest the authors declare that they have not competing interest.
Additional information
Funding
Related Research Data
References
- Siegel R, Ma J, Zou Z, Jemal A. Cancer statistics, 2014. CA Cancer J Clin. 2014;64:9–29. doi:10.3322/caac.21208.
- Chu E. Colorectal cancer (CRC) continues to be a major public health problem in the United States and throughout the world. Cancer J. 2010;16:195. doi:10.97/PPO.0b013e3181defd95.
- März L, Piso P. Treatment of peritoneal metastases from colorectal cancer. Gastroenterol Rep. 2015;3:298–302. doi:10.1093/gastro/gov044.
- Medyouf H. The microenvironment in human myeloid malignancies: emerging concepts and therapeutic implications. Blood. 2017;129:1617–1626. doi:10.1182/blood-2016-11-696070.
- Chung HW, Lim JB. Role of the tumor microenvironment in the pathogenesis of gastric carcinoma. World J Gastroenterol. 2014;20:1667–1680. doi:10.3748/wjg.v20.i7.1667.
- Tong H, Ke JQ, Jiang FZ, Wang XJ, Wang FY, Li YR, Lu W, Wan XP. Tumor-associated macrophage-derived CXCL8 could induce ERalpha suppression via HOXB13 in endometrial cancer. Cancer Lett. 2016;376:127–136. doi:10.1016/j.canlet.2016.03.036.
- Junttila MR, de Sauvage FJ. Influence of tumour micro-environment heterogeneity on therapeutic response. Nature. 2013;501:346–354. doi:10.1038/nature12626.
- Paggetti J, Haderk F, Seiffert M, MJanji B, Distler U, Ammerlaan W, Kim YJ, Adam J, Lichter P, Solary E, et al. Exosomes released by chronic lymphocytic leukemia cells induce the transition of stromal cells into cancer-associated fibroblasts. Blood. 2015;126:1106–1117. doi:10.1182/blood-2014-12-618025.
- Comito G, Giannoni E, Segura CP, Barcellos-de-Souza P, Raspollini MR, Baroni G, Lanciotti M, Serni S, Chiarugi P. Cancer-associated fibroblasts and M2-polarized macrophages synergize during prostate carcinoma progression. Oncogene. 2014;33:2423–2431. doi:10.1038/onc.2013.
- Shangguan L, Ti X, Krause U, Hai B, Zhao Y, Yang Z, Liu F. Inhibition of TGF-beta/Smad signaling by BAMBI blocks differentiation of human mesenchymal stem cells to carcinoma-associated fibroblasts and abolishes their protumor effects. Stem Cells. 2012;30:2810–2819. doi:10.1002/stem.
- Curtis M, Kenny HA, Ashcroft B, Mukherjee A, Johnson A, Zhang Y, Helou Y, Batlle R, Liu X, Gutierrez N, et al. Fibroblasts mobilize tumor cell glycogen to promote proliferation and metastasis. Cell Metab. 2018. doi:10.1016/j.cmet.2018.08.007.
- Huelsken J, Hanahan D. A subset of cancer-associated fibroblasts determines therapy resistance. Cell. 2018;172(4):643–644. doi:10.1016/j.cell.2018.01.028.
- Su S, Chen J, Yao H, Liu J, Yu S, Lao L, Wang M, Luo M, Xing Y, Chen F, et al. CD10(+)GPR77(+) cancer-associated fibroblasts promote cancer formation and chemoresistance by sustaining cancer stemness. Cell. 2018;172(4):841–856.e16. doi:10.1016/j.cell.2018.01.009.
- Zhao XL, Lin Y, Jiang J, Tang Z, Yang S, Lu L, Liang Y, Liu X, Tan J, Hu XG, et al. High-mobility group box 1 released by autophagic cancer-associated fibroblasts maintains the stemness of luminal breast cancer cells. J Pathol. 2017;243(3):376–389. doi:10.1002/path.4958.
- Huynh PT, Beswick EJ, Coronado YA, Johnson P, O’Connell MR, Watts T, Singh P, Qiu S, Morris K, Powell DW, et al. CD90(+) stromal cells are the major source of IL-6, which supports cancer stem-like cells and inflammation in colorectal cancer. Int J Cancer. 2016;138:1971–1981. doi:10.1002/ijc.29939.
- Zhu X, Wang K, Zhang K, Xu F, Yin Y, Zhu L, Zhou F. Galectin-1 knockdown in carcinoma-associated fibroblasts inhibits migration and invasion of human MDA-MB-231 breast cancer cells by modulating MMP-9 expression. Acta Biochim Biophys Sin. 2016;48:462–467. doi:10.1093/abbs/gmw019.
- Ellem SJ, Taylor RA, Furic L, Larsson O, Frydenberg M, Pook D, Pedersen J, Cawsey B, Trotta A, Need E, et al. A pro-tumourigenic loop at the human prostate tumour interface orchestrated by oestrogen, CXCL12 and mast cell recruitment. J Pathol. 2014;234:86–98. doi:10.1002/path.4386.
- Zheng X, Xu M, Yao B, Wang C, Jia Y, Liu Q. IL-6/STAT3 axis initiated CAFs via up-regulating TIMP-1 which was attenuated by acetylation of STAT3 induced by PCAF in HCC microenvironment. Cell Signal. 2016;28:1314–1324. doi:10.1016/j.cellsig.2016.06.009.
- Shan S, Lv Q, Zhao Y, Liu C, Sun Y, Xi K, Xiao J, Li C. Wnt/beta-catenin pathway is required for epithelial to mesenchymal transition in CXCL12 over expressed breast cancer cells. Int J Clin Exp Pathol. 2015;8:12357–12367.
- Servais C, Erez N. From sentinel cells to inflammatory culprits: cancer-associated fibroblasts in tumour-related inflammation. J Pathol. 2013;229:198–207. doi:10.1002/path.4103.
- Du HD, Wu CP, Zhou L, Tian J. Separation and cultivation of laryngeal carcinoma-associated fibroblasts and biological influence on a laryngeal carcinoma cell line. Acta Otolaryngol. 2013;133:755–760. doi:10.3109/00016489.2013.766925.
- Kikuchi Y, Kashima TG, Nishiyama T, Shimazu K, Morishita Y, Shimazaki M, Kii I, Horie H, Nagai H, Kudo A, et al. Periostin is expressed in pericryptal fibroblasts and cancer-associated fibroblasts in the colon. J Histochem Cytochem. 2008;56:753–764. doi:10.1369/jhc.2008.951061.
- Chu TY, Yang JT, Huang TH, Liu HW. Crosstalk with cancer-associated fibroblasts increases the growth and radiation survival of cervical cancer cells. Radiat Res. 2014;181:540–547. doi:10.1667/RR13583.
- Valenti G, Quinn HM, Heynen GJJE, Lan L, Holland JD, Vogel R, Wulf-Goldenberg A, Birchmeier W. Cancer stem cells regulate cancer-associated fibroblasts via activation of hedgehog signaling in mammary gland tumors. Cancer Res. 2017;77:2134–2147. doi:10.1158/0008-5472.
- Bai YP, Shang K, Chen H, Ding F, Wang Z, Liang C, Xu Y, Sun MH, Li YY. FGF-1/-3/FGFR4 signaling in cancer-associated fibroblasts promotes tumor progression in colon cancer through Erk and MMP-7. Cancer Sci. 2015;106:1278–1287. doi:10.1111/cas.12745.
- Ock CY, Nam AR, Bang JH, Kim TY, Lee KH, Han SW, Im SA, Kim TY, Bang YJ, Oh DY. The distinct signatures of VEGF and soluble VEGFR2 increase prognostic implication in gastric cancer. Am J Cancer Res. 2015;5:3376–3388.
- Fuhlendorff J, Clemmensen I, Magnusson S. Primary structure of tetranectin, a plasminogen kringle 4 binding plasma protein: homology with asialoglycoprotein receptors and cartilage proteoglycan core protein. Biochemistry. 1987;26:6757–6764.
- Caterer NR, Graversen JH, Jacobsen C, Moestrup SK, Sigurskjold BW, Etzerodt M, Thøgersen HC. Specificity determinants in the interaction of apolipoprotein(a) kringles with tetranectin and LDL. Biol Chem. 2002;383:1743–1750. doi:10.1515/BC.2002.195.
- Verspaget HW, Clemmensen I, Ganesh S, Christensen L, Sier CF, Griffioen G, Lamers CB. Tetranectin expression in human colonic neoplasia. Histopathology. 1994;25:463–467. doi:10.1111/j.1365-2559.1994.tb00008.x.
- Looi ML, Karsani SA, Rahman MA, Dali AZ, Ali SA, Ngah WZ, Yusof YA. Plasma proteome analysis of cervical intraepithelial neoplasia and cervical squamous cell carcinoma. J Biosci. 2009;34:917–925. doi:10.1007/s12038-009-0106-3.
- Obrist P, Spizzo G, Ensinger C, Fong D, Brunhuber T, Schäfer G, Varga M, Margreiter R, Amberger A, Gastl G, et al. Aberrant tetranectin expression in human breast carcinomas as a predictor of survival. J Clin Pathol. 2004;57:417–421. doi:10.1136/jcp.2003.010058.
- De Vries TJ, De Wit PE, Clemmensen I, Verspaget HW, Weidle UH, Bröcker EB, Ruiter DJ, Van Muijen GN. Tetranectin and plasmin/plasminogen are similarly distributed at the invasive front of cutaneous melanoma lesions. J Pathol. 1996;179:260–265. doi:10.1002/(SICI)1096-9896(199607)179:3<260::AID-PATH586>3.0.CO;2-T.
- Arvanitis DL, Kamper EF, Kopeikina L, Stavridou A, Sgantzos MN, Kallioras V, Athanasiou E, Kanavaros P. Tetranectin expression in gastric adenocarcinomas. Histol Histopathol. 2002;17:471–475. doi:10.14670/HH-17.471.
- Brunner A, Ensinger C, Christiansen M, Heiss S, Verdorfer I, Mikuz G, Tzankov A. Expression and prognostic significance of Tetranectin in invasive and non-invasive bladder cancer. Virchows Arch. 2007;450:659–664. doi:10.1007/s00428-007-0409-4.
- Henry LR, Lee HO, Lee JS, Klein-Szanto A, Watts P, Ross EA, Chen WT, Cheng JD. Clinical implications of fibroblast activation protein in patients with colon cancer. Clin Cancer Res. 2007;13:1736–1741. doi:10.1158/1078-0432.CCR-06-1746.