
ABSTRACT
Measurement of a tumor’s overall genomic instability has gathered recent interest over the identification of specific genomic imbalances, as it may provide a more robust measure of tumor aggressiveness. Here we demonstrate the association of tumor genomic instability in the prediction of disease recurrence in patients with clinically localized clear cell renal cell carcinoma (ccRCC). Genomic copy number analysis was performed using SNP-based microarrays on tumors from 103 ccRCC patients. The number of copy number alterations (CNAs) for each tumor was calculated, and a genomic imbalance threshold (GIT) associated with high stage and high-grade disease was determined. Cox proportional hazards regression analyzes were performed to assess the effect of GIT on recurrence-free survival adjusting for known confounders. In the cohort, copy number losses in chromosome arms 3p, 14q, 6q, 9p, and 1p and gains of 5q and 7p/q were common. CNA burden significantly increased with increasing stage (p < .001) and grade (p < .001). The median CNA burden associated with patients presenting with advanced stage (IV) and high-grade (III/IV) tumors was ≥9, defining the GIT. On regression analysis, GIT was a superior predictor of recurrence (Hazard Ratio 4.44 [CI 1.36–14.48], p = .01) independent of stage, with similar results adjusting for grade. These findings were confirmed using an alternative measure of genomic instability, weighted Genomic Integrity Index. Our data support a key role for genomic instability in ccRCC progression. More importantly, we have identified a GIT (≥ 9 CNAs) that is a superior and independent predictor of disease recurrence in high-risk ccRCC patients.
Introduction
The management of patients with localized renal cell carcinoma remains challenging due to the lack of robust and generalizable predictors for disease recurrence. Currently, tumor histological factors remain the basis of risk stratification. Unfortunately, significant heterogeneity exists within each histopathological category, limiting their ability to provide individualized predictions. Given the limitations of clinicopathological factors to accurately risk-stratify patients with localized RCC, the focus has turned to identifying genomic markers associated with cancer recurrence and survival.
Advances in genetic sequencing technology have shifted the focus of molecular diagnostics to the identification of specific mutations and disease pathways in the hope that they might allow for more accurate disease risk prediction and individualized treatment strategies.Citation1 In RCC, the genomic revolution has provided the basis for the development of the targeted agents widely utilized in the current treatment of advanced disease. Unfortunately, these genomic advances have not been able to be translated into individualized risk prediction in the clinic, mainly due to the lack of validation and conflicting results across cohorts.Citation2–Citation4
Genomic instability, defined as a global measure of genomic alterations, has been postulated as a key driver in tumorigenesis with prognostic implications.Citation5 Genomic instability, as a measure of disease prognosis, has seen a reemergence with increasing studies showing its improved prognostication over individual mutations.Citation6–Citation8 In RCC, Ball et al.Citation9 first reported an association between somatic copy number burden and recurrence-free survival (RFS) using data from The Cancer Genome Atlas (TCGA).Citation1 Recently, the Tracking Renal Cell Cancer Evolution through Therapy (TRACERx) Renal Consortium,Citation10 which aimed to analyze the evolutionary trajectories of advanced RCC, found that the most important determinants of patient outcome are genomic diversity and chromosome complexity. In patients with localized disease, those presenting with high chromosomal complexity and low tumor heterogeneity were more likely to have rapid disease progression.
Here, we corroborate the value of genomic instability, as measured by somatic copy number alteration (sCNA) burden, for the accurate selection of clear cell RCC (ccRCC) patients at high risk of recurrence. We demonstrate this using two independent measures of chromosomal complexity: the weighted Genomic Integrity Index (wGII)Citation11 and a novel genomic instability threshold (GIT) calculated based on sCNA burden observed in patients with advanced stage and high-grade disease. Both measures were then assessed in a cohort of patients with localized ccRCC for its association with disease recurrence.
Results
Clinicopathological features
The analytic cohort included 103 ccRCC patients who underwent tumor resection and had microarray analysis performed on a tumor tissue sample. A summary of the cohort’s clinicopathological characteristics is presented in . The median age of the cohort was 59 years (28–84 years), with 68% male and 95% of Caucasian ethnicity. All tumors were ccRCC per selection criteria. The cohort was enriched with high-risk pathology, with 69% of tumors characterized as having high nuclear grades (III or IV), and 40% of the patients presenting with advanced disease (Stage IV).
Table 1. Cohort characteristics.
Genomic findings
As expected, loss of 3p was the most frequent finding, occurring in 99 of 103 (96%) cases. Among tumors with 3p loss, 90 sustained deletions and 9 had either monosomy 3 or copy neutral loss of heterozygosity (cnLOH) involving all or part of chromosome 3. A total of 99 ccRCCs (96%) has loss of one copy of the VHL gene, and 92 (89%) also exhibited loss of one copy of tumor suppressor genes SETD2, BAP1 and PBRM1.
A total of 58 (56%) ccRCCs showed gains of all or, in most (45) cases, part of chromosome arm 5q. The smallest region of overlap (SRO) of 5q gains was 5q34q35.2. The stanniocalcin 2 gene, STC2, and the kidney and brain expressed gene, WWC1/KIBRA, are two noteworthy candidates in this chromosomal region. Only 2 of the 58 ccRCCs with 5q gains did not overlap 5q35.3, the location of SQSTM1 – a gene previously implicated in ccRCC.Citation12
Losses of 14q were observed in 42 cases (41%), 39 of which showed monosomy of chromosome 14, and 3 cases had interstitial deletions. The SRO of chromosomal losses encompassed two candidate tumor suppressor genes, PTPD1 and SEL1L. Two of the three cases with interstitial deletions overlapped a broader region that includes the location of HIF1A, another gene implicated in ccRCC.Citation13
Losses affecting 9p were identified in 33 ccRCCs (32%). Most of these tumors had monosomy 9 or, in one case, cnLOH of chromosome 9. Another 3 cases had interstitial deletions of 9p, with the SRO encompassing CDKN2A. A summary of the major genomic findings is presented in .
Table 2. Most frequent genomic imbalances observed in 103 clear cell RCCs.
Genomic imbalance threshold analysis
The median number of sCNAs per tumor in the cohort was 6 (range, 1–33), with male patients having more sCNAs than females (median = 7 vs. 4, p=0.043). No difference in sCNA burden was seen with respect to age or ethnicity (). CNA burden significantly increased with increasing stage (median CNA = 3, 6, 7, and 10 for Stage I–IV, respectively; p<0.001) and grade (median CNA = 2.5, 4.5, 7, and 10 for Grades I–IV, respectively; p<0.001), as shown in . Median CNA burden for patients presenting with advanced stage or high-grade disease was 9, defining the GIT. To assess the robustness of this finding, we compared number of CNAs with an alternative measure of genomic instability, the wGII. For the full analytic cohort, the median wGII was 13.0% (range: 1.9% to 95.3%; mean: 20.5%). The wGII was highly correlated with CNA number as a measure of genomic instability (Spearman correlation = 0.93, p<0.001) (). The wGII increased with stage and grade, consistent with the CNA findings (Supplemental Table S1).
Figure 1. Copy number alterations stratified by nuclear grade (left) and pathological stage (right) in the 103 ccRCC cohort.
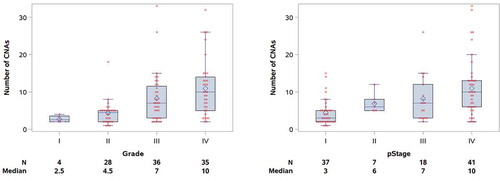
Figure 2. Scatter plot showing correlation of number of CNAs and wGII for each of the 103 ccRCC samples, identified by pathological stage.

Table 3. Association of number of genomic imbalances with patient and tumor characteristics.
To examine the association of chromosomal complexity with recurrence, we included 60 patients who presented with localized disease (pStage I to III) treated through 2016. Of these, 11 (18.3%) patients developed a recurrence (8 to lung, 1 nephrectomy bed, 1 pancreas, and 1 liver) at a median follow-up of 13.6 months. The median sCNA burden and wGII for those who experienced a recurrence was (7 and 18.4%) vs. (4 and 8.0%) for those who did not (p=0.007; p=0.005). There were 15 patients with recurrence or death, including 11 patients with recurrence (5 of these patients had died), and 4 patients who died without documented recurrence.
Using the GIT threshold, those presenting with ≥9 CNAs were found to be significantly more likely to develop a recurrence (unadjusted Hazard Ratio (HR) 6.69 [CI 2.15–20.8], p=0.001); RFS at 24 months was 93.7% (95%CI = 81.6%-97.9%) for those with <9 CNAs compared to only 46.7% (95%CI = 11.5–76.5%) for those with ≥9 (). With adjustment for stage, size, and grade (in separate models due to small number of events), GIT remained statistically significantly associated with recurrence (). The previously established threshold of ≥9 CNA was further confirmed as the best discriminatory threshold for prediction of disease recurrence in the cohort using recursive partitioning analyses (Figure S1).
Figure 3. Kaplan-Meier survival curves of recurrence-free survival of 60 patients with localized ccRCC as a function of the Genomic Imbalance Threshold (GIT).
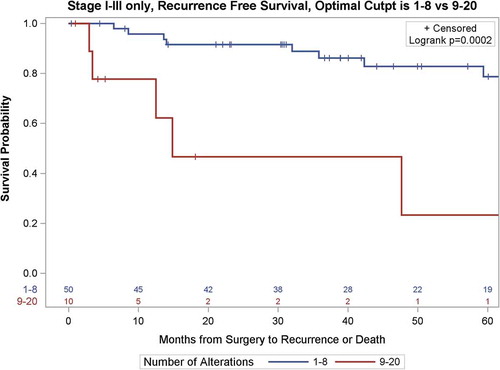
Table 4. Results of Cox proportional hazards models assessing the association between time to recurrence or death and number of genomic imbalances, CNA included as either a categorical or continuous variable.
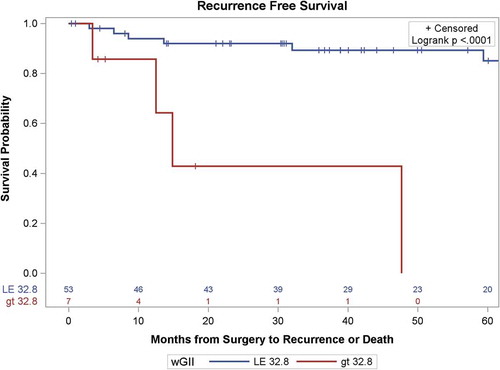
Using the wGII threshold of 32.8%, as defined by Turajlic et al.,Citation10 RFS differed significantly by wGII-T groups (p<0.001, ). The wGII-T threshold was strongly associated with RFS (HR = 7.50, 95% CI = 2.18–25.7, p=0.001), which remained significant with adjustment for stage or grade. In comparing the predictive utility of GIT (CNA <9 vs. ≥9) with wGII-T (wGII<32.8 vs. ≥32.8) for the recurrence outcome, Harrell’s concordance statistic was similar for the two thresholds. For GIT, Harrell’s C was 0.67 (95% CI 0.54–0.79), and for wGII-T, Harrell’s C was 0.63 (95% CI 0.51–0.75) (Table S3). The overlapping confidence intervals indicate the predictive utilities do not differ for this cohort.
Figure 4. Kaplan-Meier survival curves of recurrence-free survival of patients with localized ccRCC as a function of the Weighted Genomic Integrity Index, split at 32.8% of genome involvement, the threshold determined by Turaljic et al. (2018A).Citation10
Discussion
The large number of structural abnormalities present in cancer genomes is largely attributed to genomic instability, which is defined by DNA alterations, encompassing single nucleotide to whole chromosome changes.Citation14 Various causes of genomic instability have been proposed ranging from DNA damage-induced stress and telomere dysfunction to mitotic checkpoint failure.Citation15 While these proposals vary in their supposition, what has been clear is that increasing level of genomic instability is associated with poor prognosis.Citation5–Citation7 Our data support the vital role that genomic instability plays in ccRCC progression, based on two independent measures of genomic instability/chromosomal complexity. Moreover, we have identified a simple and generalizable measure of such instability/complexity, dubbed GIT, which we proposed as a novel prognostic marker of ccRCC disease recurrence/progression, and which was validated by another known measure of chromosomal complexity – the wGII.
In our 103 ccRCC cohort, we noted a significant correlation between genomic complexity (CNA burden or wGIII) and tumor stage (p<.001) and nuclear grade (<0.001), demonstrating the impact that genomic instability has on disease progression. These results are consistent with the karyotypic findings of Kardas et al.,Citation16 who performed cytogenetic analysis on 75 patients with ccRCC and noted that metastasizing tumors exhibited a significantly higher number of chromosome alterations than those that did not metastasize (5.5 vs. 2.9 aberrations per tumor, respectively). Furthermore, sarcomatoid differentiation (sRCC), a histological variant associated with advanced disease, were found to be enriched for genomic imbalances compared to other RCC histologies (mean sCNA: sRCC, 18; ccRCC, 5.5; chromophobe RCC, 7.2; papillary RCC, 6.5; p<0.001).Citation17
With regard to the risk of recurrence, our results demonstrate that increasing genomic instability (GIT: stage-adj HR 4.44 [CI 1.36–14.5], p=0.01 and wGII: HR = 7.50, 95% CI = 2.18–25.7, p =0.001) is significantly associated with RFS independent of stage, grade and size (). These results are consistent with those of Ball et al.,Citation9 in their assessment of TCGA data in which somatic copy number burden was associated with RFS (HR 3.13 [CI 1.20–8.10], p=0.02). More importantly, our identification of a GIT, defined as a sCNA burden of ≥9, was found to be highly correlated with the more complex measure of genomic instability, wGII ().
The use of genomic alterations as predictors of RCC survival outcomes has been conflicting, and it has mostly focused on the identification of a specific individual sCNACitation2,Citation4,Citation12,Citation18,Citation19, or a combination of recurrent sCNA.Citation20 Loss of 9p has been the most well documented genomic alteration associated with RCC survival.Citation3,Citation18 The critical locus in 9p is CDKN2A, which encodes p16INK4a and p14ARF, components of the RB and p53 pathways, respectively. Loss of 14q,Citation12,Citation19 and gains of 8q,Citation2 potentially dysregulating the HIF1A and MYC genes residing in those respective chromosome arms, have also been associated with a decreased CSS and shorter overall survival (OS). In a recent multi-center prospective study and validation cohorts of matched primary metastasis biopsies from 101 patients with ccRCC, loss of 9p and gains of 14q were found to be a highly selected drivers of ccRCC-related metastasis and mortality; however, no single sCNA had the comparative predictive ability of the overall chromosome complexity threshold.Citation10 The inability to validate the predictive value of specific genomic imbalances across different cohorts remains the main limitation on the implementation of such information in the clinical setting. Some have argued that focusing on specific chromosomal imbalances neglects the interplay between different genomic alterations, and thus favor a global alteration assessment.
A total of 58 (56%) ccRCCs showed gains of all or, in most (45) cases, part of chromosome arm 5q. The smallest region of overlap (SRO) of 5q gains was 5q34q35.2. The stanniocalcin 2 gene, STC2, and the kidney and brain expressed gene, WWC1/KIBRA, are two noteworthy candidates in this chromosomal region. Only 2 of the 58 ccRCCs with 5q gains did not overlap 5q35.3, the location of SQSTM1 – a gene strongly implicated in ccRCC.Citation12
With regard to the frequent gains of distal 5q, Dondeti et al.Citation21 have reported that the STC2 is overexpressed and acts as an oncogene in about 30% of ccRCCs. Notably, stanniocalcins are a family of hormones that regulate calcium-phosphate homeostasis, but how overexpression of STC2 contributes mechanistically to kidney oncogenesis is currently uncertain. The SQSTM1 gene product, p62, is a multifunctional protein that plays a role in regulating NRF2, NF-κB, and mTOR, as well as having a ubiquitin-like role in facilitating the degradation of specific proteins by autophagy.Citation15
As regards the biologic roles of genes involved in the CNAs that are not well currently well studied in ccRCC LATS1 at chromosome 6q25.1, which is frequently deleted in ccRCCs is noteworthy. LATS kinases are known modulate the functions of various oncogenic or tumor suppressive effectors, including the canonical Hippo effectors YAP/TAZ, the Aurora mitotic kinases, estrogen receptor signaling, and the tumor suppressive transcription factor p53.Citation22 Another notable finding was the recurrent loss of both PTPD1 (chromosome 14q31.3) and SRC (20q11.23), as previous work has shown that the tyrosine phosphatase PTPD1 is a positive regulator of Src-epidermal growth factor signaling. PTPD1 is stably complexed with actin, Src tyrosine kinase, and focal adhesion kinase (FAK) at adhesion plaques. PTPD1 has been shown to modulate Src-FAK signaling at adhesion sites to promote cell adhesion and migration.Citation23 Thus, how losses of LATS1 and PTPD1 might play a role in the pathogenesis of some ccRCCs is worthy of future investigation.
Here, we provide such an assessment, which we dub GIT, found to be predictive of recurrence in a cohort of ccRCC patients. The CNA burden used in the GIT is much simpler to determine than the weighed wGII, which is based on the proportion of each chromosome involved. In our cohort, predictive discrimination of the GIT is comparable to that of the wGII-T, suggesting this CNA-based tool may prove useful, particularly in a routine clinical setting. While the threshold will require validation in independent and larger cohorts, it provides a global and simple assessment of the genomic instability of a tumor in question.
The inclusion of genomic information into current prediction models have proposed but seldomly adopted in clinical practice. Klatte and colleagues introduced a recurrence nomogram with the inclusion of the 9p deletion to add a biological component to other histological factors.Citation3 Rini et al. recently introduced the recurrence score, a 16-gene panel consisting of genes associated with vasculogenesis, cell growth and division, immune response and inflammation, from nearly 1,000 nephrectomy patients.Citation24 The recurrence score was noted to be an independent predictor of recurrence (HR 3.37 [CI 2·23-5·08], p<0·001) after stratification by stage and adjustment for tumor size, grade, or Leibovich score. The inclusion of genetic information into the current prediction models is essential, given the significant prediction limitations with the currently available models. A recent validation on the eight most commonly utilized RCC prediction models on the ASSURE population showed that these models are no better than TNM staging for the prediction of recurrence.Citation25
There are several limitations that should be noted, however. The SNP-based microarray analysis reported here was performed based on several conditional criteria, i.e., tumors with high-risk features and those presenting with multifocal disease, possibly introducing a degree of selection bias in the cohort analyzed. This selection bias was evident in the analysis of the cohort, which was heavily skewed toward patients with advanced stage (III: 15.9% and IV: 39.4%) and high-grade disease (67.3%). One might argue that this population of patients provides an ideal cohort for this analysis, as it allows for the identification of a clear genomic imbalance threshold, as well as then validating its predictive ability in a population at high risk of recurrence. Another limitation of the study is the assumption that tumors are homogeneous entities, and that the genomic information obtained from a representative section of the tumors represents the biology of the whole malignancy. In our study, we selected tissue for analysis from the highest-grade portion of the tumor identified during histopathological examination, hoping to at least account for its most aggressive biology. Lastly, is the limited number of patients used for the recurrence analysis (60 patients). While our cohort is comparable to other single institution cohorts,Citation2–Citation4,Citation12,Citation18,Citation19 it is much smaller than reports using the TCGA database which has genomic information from approximately 500 patients.Citation9,Citation20 Despite this, our cohort provides an excellent discovery set, as it provides a high-risk patient population that is comparable to those used in adjuvant trials. Moreover, long-term follow-up data (≥2 years from surgery) was available in more than 80% of our cohort, allowing for an accurate assessment of disease recurrence.
In conclusion, we have validated the role of genomic instability in the progression of ccRCC. More importantly, we have identified a genomic instability threshold (≥9 sCNAs), which was found to be a superior and independent predictor of disease recurrence in a cohort of patients with high-risk localized ccRCC. The robustness of our findings were validated by comparing them with an alternative and established measure of genomic instability, the wGII.
Materials and methods
Patient selection
A total of 103 ccRCC patients undergoing tumor resection underwent SNP-based microarray analysis between January 2002 and March 2017. Inclusion criteria was per institutional protocol, which selected tumors with high-risk features (pStage, tumor grade, evidence of nodal or metastatic disease) or those presenting with multifocal disease. In those with multifocal tumors, the lesion with the higher stage or grade was selected for microarray analysis. All resected tumors were examined by experienced oncological pathologists, and tissue used for microarrays was reviewed for histological identity and tumor percentage on frozen section. All tumors were reevaluated by a single pathologist (T.A.-S.) to confirm the original diagnoses. Given histological heterogeneity within the tumor, tissue for microarray analysis was sampled from the section with the highest tumor grade. Clinical data were extracted from a prospectively maintained database that included patient age at time and date of surgery, gender, clinical and pathological stage, nuclear grade, histology, recurrence dates, and disease and vital status at last known follow-up. All patients provided written consent for inclusion in the prospectively collected, institutional review board-approved kidney cancer database.
Snp-array analysis
Tumors were classified pathologically according to the system proposed by the International Society of Urological Pathology and later adopted by the WHO in 2016.Citation26 Pathological review of H&E-stained tissue directly adjacent to the area used for the single-nucleotide polymorphism (SNP) array was performed to ensure that tumor region used was phenotypically homogeneous to maximize the percentage of malignant cells. The median percentage of tumor cells present in tissue samples was 90% (range: 50-100%). Total genomic DNA was extracted, and microarray analysis was performed as described.Citation27,Citation28
Samples obtained prior to November 2010 (n = 17) were analyzed using Affymetrix Genome-wide Human SNP array 6.0. Samples obtained between November 2010 and March 2012 were analyzed using Cytogenetics 2.7M arrays (Affymetrix), and samples examined after April 2012 were analyzed using Affymetrix CytoScan HD arrays. All samples were processed for clinical purposes; therefore, extensive validation was performed to ensure uniformity between all analytic platforms to conform with CLIA standards.
Statistical analysis
The number of CNAs for each sample was determined by the same cytogeneticist (J.R.T.). The wGII,Citation11 calculated as the average across autosomal chromosomes of the percentage of gained/lost genomic material, was calculated for each sample (detailed in Appendix 1). The GIT was defined as the median CNA burden associated with advanced stage (Stage IV) and high-grade disease (Fuhrman grades III/IV). Spearman’s correlation was used to assess the association between CNAs and wGII.
Recurrence was defined as any recurrence (local or distant) following complete resection of localized disease. For survival analyzes, outcome was calculated from the time of surgery to the time of recurrence or death, with patients alive without recurrence being censored at the date of their last follow-up visit or contact. All patients who died from kidney cancer-related causes had local or distant recurrence prior to death. Patients treated as of 12/31/2016 were included in the recurrence analytic cohort. The wGII and sCNA burdens were evaluated as continuous and dichotomous variables. For wGII, the proposed threshold of 32.8% by Trujalic et al.Citation10 was used. For our novel GIT measure, a threshold of sCNA = ≥9 was employed. The threshold was obtained using the Kruskal-Wallis test, based on differences in clinicopathological characteristics (stage and grade). Recurrence-free survival probabilities were estimated for the wGII and GIT groups using the Kaplan-Meier method, and compared with log rank tests. The GIT threshold was further validated with recursive partitioning analyzes using conditional inference trees to identify the threshold value associated with decreased RFS. This was done using the cTree implementation in the PARTY package in R (3.4.0).
Cox proportional hazards regression was used to estimate HR on time to recurrence or death from RCC and chromosomal complexity, adjusting for risk factors. In these analyzes, sCNA burden was defined in two forms: wGII groups (wGII<38.2% vs. wGII≥38.2%) and GIT groups (sCNA≥9 vs. CNA<9). Risk factors, including age, grade, and stage, race and gender, were assessed individually for association with recurrence outcome. Factors that were associated at a level of significance of p<0.10 were included in multivariable analyzes, with each selected factor added in a separate model, due to the low number of events. Except as noted, analyzes were performed using SAS version 9.4 (Cary, NC), with p-values of <0.05 considered significant.
Financial Sources
No financial sources
Disclosure of Potential Conflicts of Interest
There are no conflicts of interest.
Supplemental Material
Download MS Word (60.3 KB)Supplementary material
Supplemental data for this article can be accessed on the publisher's website.
References
- The Cancer Genome Atlas Research Network, Creighton CJ, Morgan M, Gunaratne PH. Comprehensive molecular characterization of clear cell renal cell carcinoma. Nature. 2013;499:43–49.
- Klatte T, Kroeger N, Rampersaud EN, Birkhäuser FD, Logan JE, Sonn G, Riss J, Rao PN, Kabbinavar FF, Belldegrun AS, et al. Gain of chromosome 8q is associated with metastases and poor survival of patients with clear cell renal cell carcinoma. Cancer. 2012;118:5777–5782. doi:10.1002/cncr.v118.23.
- Klatte T, Rao PN, de Martino M, LaRochelle J, Shuch B, Zomorodian N, Said J, Kabbinavar FF, Belldegrun AS, Pantuck AJ, et al. Cytogenetic profile predicts prognosis of patients with clear cell renal cell carcinoma. J Clin Oncol. 2009;27:746–753. doi:10.1200/JCO.2007.15.8345.
- La Rochelle J, Klatte T, Dastane A, Rao N, Seligson D, Said J, Shuch B, Zomorodian N, Kabbinavar F, Belldegrun A, et al. Chromosome 9p deletions identify an aggressive phenotype of clear cell renal cell carcinoma. Cancer. 2010;116:4696–4702. doi:10.1002/cncr.v116:20.
- Carter SL, Eklund AC, Kohane IS, Harris LN, Szallasi Z. A signature of chromosomal instability inferred from gene expression profiles predicts clinical outcome in multiple human cancers. Nat Genet. 2006;38:1043–1048. doi:10.1038/ng1861.
- Hieronymus H, Murali R, Tin A, Yadav K, Abida W, Moller H, Berney D, Scher H, Carver B, Scardino P, et al. Tumor copy number alteration burden is a pan-cancer prognostic factor associated with recurrence and death. Elife. 2018;7:e37294. doi:10.7554/eLife.37294.
- Hieronymus H, Schultz N, Gopalan A, Carver BS, Chang MT, Xiao Y, Heguy A, Huberman K, Bernstein M, Assel M, et al. Copy number alteration burden predicts prostate cancer relapse. Proc Natl Acad Sci U S A. 2014;111:11139–11144. doi:10.1073/pnas.1411446111.
- Graham NA, Minasyan A, Lomova A, Cass A, Balanis NG, Friedman M, Chan S, Zhao S, Delgado A, Go J, et al. Recurrent patterns of DNA copy number alterations in tumors reflect metabolic selection pressures. Mol Syst Biol. 2017;13:914. doi:10.15252/msb.20167159.
- Ball MW, Gorin MA, Drake CG, Hammers HJ, Allaf ME. The landscape of whole-genome alterations and pathologic features in genitourinary malignancies: an analysis of the cancer genome atlas. Eur Urol Focus. 2017;3:584–589. doi:10.1016/j.euf.2017.01.007.
- Turajlic S, Xu H, Litchfield K, Rowan A, Horswell S, Chambers T, O’Brien T, Lopez JI, Watkins TBK, Nicol D, et al. Deterministic evolutionary trajectories influence primary tumor growth: TRACERx Renal. Cell. 2018;173:595–610.e11. doi:10.1016/j.cell.2018.03.043.
- Endesfelder D, Burrell R, Kanu N, McGranahan N, Howell M, Parker PJ, Downward J, Swanton C, Kschischo M. Chromosomal instability selects gene copy-number variants encoding core regulators of proliferation in ER+ breast cancer. Cancer Res. 2014;74:4853–4863. doi:10.1158/0008-5472.CAN-13-2664.
- Mitsumori K, Kittleson JM, Itoh N, Delahunt B, Heathcott RW, Stewart JH, McCredie MRE, Reeve AE. Chromosome 14q LOH in localized clear cell renal cell carcinoma. J Pathol. 2002;198:110–114. doi:10.1002/(ISSN)1096-9896.
- Klatte T, Seligson DB, Riggs SB, Leppert JT, Berkman MK, Kleid MD, Yu H, Kabbinavar FF, Pantuck AJ, Belldegrun AS, et al. Hypoxia-inducible factor 1 alpha in clear cell renal cell carcinoma. Clin Cancer Res. 2007;13:7388–7393. doi:10.1158/1078-0432.CCR-07-0411.
- Lengauer C, Kinzler KW, Vogelstein B. Genetic instabilities in human cancers. Nature. 1998;396:643–649. doi:10.1038/25292.
- Li L, Shen C, Nakamura E, Ando K, Signoretti S, Beroukhim R, Cowley G, Lizotte P, Liberzon E, Bair S, et al. SQSTM1 is a pathogenic target of 5q copy number gains in kidney cancer. Cancer Cell. 2013;24:738–750. doi:10.1016/j.ccr.2013.10.025.
- Kardas I, Mrozek K, Babinska M, Krajka K, Hadaczek P, Lubinski J, Roszkiewicz A, Kuziemska E, Limon J. Cytogenetic and molecular findings in 75 clear cell renal cell carcinomas. Oncol Rep. 2005;13:949–956.
- Ito T, Pei J, Dulaimi E, Menges C, Abbosh PH, Smaldone MC, Chen DYT, Greenberg RE, Kutikov A, Viterbo R, et al. Genomic copy number alterations in renal cell carcinoma with sarcomatoid features. J Urol. 2016;195:852–858. doi:10.1016/j.juro.2015.10.180.
- El-Mokadem I, Fitzpatrick J, Bondad J, Rauchhaus P, Cunningham J, Pratt N, Fleming S, Nabi G. Chromosome 9p deletion in clear cell renal cell carcinoma predicts recurrence and survival following surgery. BrJ Cancer. 2014;111:1381–1390. doi:10.1038/bjc.2014.420.
- Monzon FA, Alvarez K, Peterson L, Truong L, Amato RJ, Hernandez-McClain J, Tannir N, Parwani AV, Jonasch E. Chromosome 14q loss defines a molecular subtype of clear-cell renal cell carcinoma associated with poor prognosis. Mod Pathol. 2011;24:1470–1479. doi:10.1038/modpathol.2011.107.
- Hakimi AA, Mano R, Ciriello G, Gonen M, Mikkilineni N, Sfakianos JP, Kim PH, Motzer RJ, Russo P, Reuter VE, et al. Impact of recurrent copy number alterations and cancer gene mutations on the predictive accuracy of prognostic models in clear cell renal cell carcinoma. J Urol. 2014;192:24–29. doi:10.1016/j.juro.2014.01.088.
- Dondeti VR, Wubbenhorst B, Lal P, Gordan JD, D’Andrea K, Attiyeh EF, Simon MC, Nathanson KL. Integrative genomic analyses of sporadic clear cell renal cell carcinoma define disease subtypes and potential new therapeutic targets. Cancer Res. 2012;72:112–121. doi:10.1158/0008-5472.CAN-11-1698.
- Furth N, Aylon Y. The LATS1 and LATS2 tumor suppressors: beyond the Hippo pathway. Cell Death Differ. 2017;24:1488–1501. doi:10.1038/cdd.2017.99.
- Carlucci A, Gedressi C, Lignitto L, Nezi L, Villa-Moruzzi E, Avvedimento EV, Gottesman M, Garbi C, Feliciello A. Protein-tyrosine phosphatase PTPD1 regulates focal adhesion kinase autophosphorylation and cell migration. J Biol Chem. 2008;283:10919–10929. doi:10.1074/jbc.M707248200.
- Rini B, Goddard A, Knezevic D, Maddala T, Zhou M, Aydin H, Campbell S, Elson P, Koscielny S, Lopatin M, et al. A 16-gene assay to predict recurrence after surgery in localised renal cell carcinoma: development and validation studies. Lancet Oncol. 2015;16:676–685. doi:10.1016/S1470-2045(15)70167-1.
- Correa AF, Jegede O, Haas NB, Flaherty KT, Pins MR, Messing EM, Manola J, Wood CG, Kane CJ, Jewett MAS, et al. Predicting renal cancer recurrence: defining limitations of existing prognostic models with prospective trial-based validation. J Clin Oncol. 2019;37:2062–2071. doi:10.1200/JCO.19.00107.
- Moch H, Cubilla AL, Humphrey PA, Reuter VE, Ulbright TM. The 2016 WHO classification of tumours of the urinary system and male genital organs-Part A: renal, penile, and testicular tumours. Eur Urol. 2016;70:93–105. doi:10.1016/j.eururo.2016.02.029.
- Pei J, Feder MM, Al-Saleem T, Liu Z, Liu A, Hudes GR, Uzzo RG, Testa JR. Combined classical cytogenetics and microarray-based genomic copy number analysis reveal frequent 3;5 rearrangements in clear cell renal cell carcinoma. Genes Chromosomes Cancer. 2010;9:610–619.
- Pei J, Jhanwar SC, Testa JR. Chromothripsis in a case of TP53-deficient chronic lymphocytic leukemia. Leuk Res Rep. 2012;1:4–6. doi:10.1016/j.lrr.2012.09.001.