
 ?Mathematical formulae have been encoded as MathML and are displayed in this HTML version using MathJax in order to improve their display. Uncheck the box to turn MathJax off. This feature requires Javascript. Click on a formula to zoom.
ABSTRACT
Background
Despite recent progress in screening survival-related genes, there have been few attempts to apply methods based on cancer stem cells (CSCs) for prognosis. We aimed to identify a CSC-based model to predict survival in colorectal cancer (CRC) patients.
Material/Methods
Differentially expressed genes between CRC and normal tissues and between CD133- and CD133+ cells were obtained from The Cancer Genome Atlas and Gene Expression Omnibus, and intersections were evaluated. Gene Ontology functional and Kyoto Encyclopedia of Genes and Genomes pathway enrichment analyzes were performed. STRING was used to investigate interactions between the encoded proteins and the Kaplan-Meier method to verify mRNAs associated with survival. A prognostic model based on CSCs was established via univariate and multivariate Cox regression. Receiver operating characteristic curve analysis was conducted to test the model’s sensitivity and specificity. The KS test was applied to provide evidence for relationships between expression levels of nine mRNAs in our model and pathological stage.
Results
In total, 155 common differentially expressed mRNAs were identified, and nine (AOC1, UCN, MTUS1, CDC20, SNCB, MAT1A, TUBB2B, GABRA4 and ALPP) were screened after regression analyses to establish a predictive model for classifying patients into high- and low-risk groups with significantly different overall survival times, especially for stage II and IV patients.
Conclusions
We developed a novel model that provides additional and powerful prognostic information beyond conventional clinicopathological factors for CRC survival prediction. It also provides new insight into the molecular mechanisms underlying the transition from normal tissues to CSCs and formation of tumor tissues.
Introduction
Colorectal cancer (CRC) is one of the most frequent malignant tumors in the world, ranking third and second for incidence and mortality in Europe and the United States, respectively.1,Citation2 Therefore, effective prevention and intervention of this disease are pivotal for overcoming this major public health threat. In 1997, scientists first isolated human leukemia stem cells from human acute myelogenous leukemia.Citation3 The theory of cancer stem cells (CSCs) has since been studied, and scientists have developed a CSC model assuming that tumors are hierarchically organized, whereby CSCs are at the top and responsible for the generation of heterogeneity within tumors.Citation4,Citation5 The term CSC is used because these tumor-initiating cells have abilities similar to those of normal stem cells, especially with regard to self-renew and differentiation.Citation6
There are three main hypotheses about the origin of CSCs.Citation7 First, CSCs mutate from stem cells, a hypothesis that is based on the fact that the limited life span of mature cells is not sufficient to accumulate the multiple carcinogenic mutations necessary.Citation8,Citation9 Second, CSCs may develop from progenitor cells: the number of progenitor cells in adult tissues is much larger than that of stem cells, leading to greater possibility of carcinogenic transformation.Citation7,Citation8 Third, cancer cells might be derived from differentiated cells via dedifferentiation.Citation10
Stem cells can be identified by special functional assays or by various surface markers.Citation11 One of the most reliable CSC markers is CD133 (prominin-1),Citation12 which has been found in a variety of cancers, including breast, colon, prostate, liver, pancreatic and lung cancers, as well as in head and neck squamous cell carcinoma.Citation13 Therefore, targeting CD133 appears to be a promising possibility for eradicating CSCs.Citation14 Therefore, in our research, CD133+ cells of CRC were regarded as CSCs for follow-up studies.Citation15
Regardless of the origin of CSCs, there may be a series of genes that are differentially expressed not only between CSCs and progeny cancer cells but also between CSCs and normal cells, and we speculate that these genes may affect patient survival time. Thus, to test our hypothesis, we used the Cancer Genome Atlas (TCGA), which provides genomic expression data for CRC, and the Gene Expression Omnibus (GEO) database, which contains differentially expressed mRNAs between CRC cells and CSCs, to obtain a gene set that roughly represents the proportion of differentially expressed genes mentioned above.
In recent decades, advances in early diagnosis and treatment have reduced the mortality rate of patients with CRC.Citation16,Citation17 However, because of the different pathological stages of tumors, the survival rate of CRC patients varies greatly, so the treatment of CRC to improve the prognosis of patients are remain serious challenges.Citation18
In this study, we applied a series of network-based analyses to identify potential prognostic factors in CRC. Using a TCGA dataset of 476 CRC patients and a gene chip of Caco-2 cells, with which a microarray analysis was performed using CD133+ and CD133- sorted Caco-2 cells from the GEO dataset, we found genes that, to some extent, represent the target of our hypothesis.
Results
Differentially expressed genes between CD133+ and CD133- Caco-2 cell lines of CRC in GEO and between CRC and normal tissues in TCGA
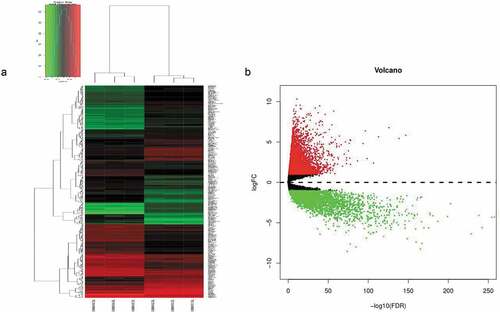
According to our cutoff criteria, a total of 393 differentially expressed genes (including 193 upregulated and 200 downregulated) between CD133- and CD133+ Caco-2 cells were collected from GEO dataset GSE24747, and 11,832 differentially expressed genes (including 4,226 downregulated and 7,606 upregulated) between normal colorectal and tumor tissues were collected from TCGA. The results visualized as a volcano map and heatmap () clearly distinguish the differentially expressed genes.
Figure 1. (a) Unsupervised hierarchical clustering analysis of the differentially expressed mRNAs between CD133- and CD133+ Caco-2 cells. (b) The differentially expressed genes between CRC and normal tissues, in which red indicates high expression, and green indicates low expression.
Significant genes that play an important role in the transformation from normal cells into cancer tissues and may be relevant to the prognosis of patients diagnosed with CRC
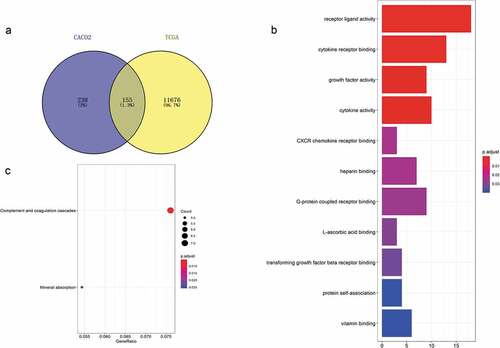
We intersected the differentially expressed genes from TCGA with those from GEO according to our hypothesis, with 155 genes obtained (shown in )). To explore the functions of these 155 genes in tumor cells, GO and KEGG functional enrichment analyses were performed in R. The results showed that 11 GO terms were enriched, which mainly clustered in the regulation of diverse receptor binding (such as GO:0005126~ cytokine receptor binding, GO:0045236~ CXCR chemokine receptor binding, GO:0001664 ~ G protein-coupled receptor binding, GO:0005160~ transforming growth factor beta receptor binding), the activity of various substances (including GO:0048018~ receptor ligand activity, GO:0008083~ growth factor activity, GO:0005125~ cytokine activity), the binding of several elements (such as GO:0008201~ heparin binding, GO:0031418 ~ L-ascorbic acid binding, GO:0019842~ vitamin binding) and protein self-association (GO:0043621) categories (shown in and )). KEGG pathways that were enriched mainly involve two pathways: hsa04610 (complement and coagulation cascades) and hsa04978 (mineral absorption) ()).
Table 1. Summary of colorectal cancer patient clinical characteristics based on the inclusion criteria.
Table 2. Enrichment analysis of GO terms for the 155 differentially expressed genes.
Figure 2. Acquisition of 155 differentially expressed genes and GO and KEGG functional enrichment analyses. (a) There were 393 differentially expressed genes between CD133- and CD133+ Caco-2 cells, 11,832 genes differentially expressed between colorectal tumor and normal tissues, and 155 genes coexisted among them. (b) GO functional enrichment and (c) KEGG pathway analyses of these 155 genes.
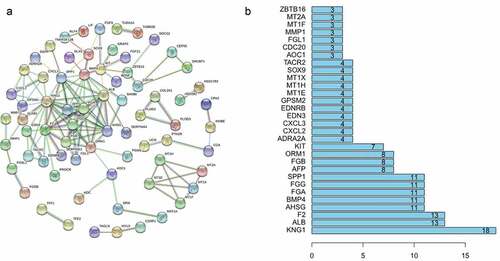
We next sought to determine whether the proteins expressed by these 155 genes interact with each other and utilized the online website STRING to analyze protein interactions, with high confidence set as 0.7. The results are shown in ), and the top 30 genes with the highest degree of correlation are illustrated in ).
Figure 3. (a) Protein association networks of 155 genes. (b) The top 30 genes with the highest degree of correlation.
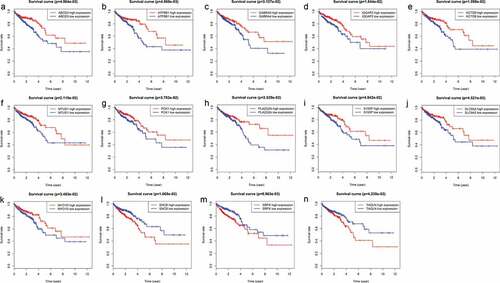
To determine which of the 155 genes are associated with patient prognosis, OS curves were generated using the K-M method, and two-sided log-rank tests were employed to compare differences in OS between the high- and low-risk patient groups. Ultimately, we found 14 genes (ABCD3, ATP8B1, SRPX, SNCB, KCTD9, IQGAP2, MTUS1, PLA2G2A, GABRA4, MYO1D, PCK1, TAGLN, SLC9A2 and S100P) that were associated with survival outcomes (P < .05); the survival curves are shown in .
Figure 4. Genes associated with patient’s survival outcomes by applying the K-M method in “survival” R package.
Establishment of a 9-mRNA signature associated with the OS of CRC patients
To construct the prediction model, we first evaluated correlations between the expression level of the 155 mRNAs and OS by univariate Cox regression analysis and found 22 mRNAs to be significantly correlated (P < .05). Stepwise multivariate Cox regression analysis was then performed, with 9 of these mRNAs (as shown in ) screened to establish the prediction model. The model was defined as the sum of the expression level of each mRNA weighted by its corresponding coefficient in multivariate Cox regression, as follows: RS = (−0.2682 × expression value of AOC1) + (0.1456 × expression value of UCN) +(−0.3614 × expression value of MTUS1) + (−0.4684 × expression value of CDC20) + (0.2023 × expression value of SNCB) + (0.1767 × expression value of MAT1A)+ (0.1152 × expression value of TUBB2B) + (−0.0869 × expression value of GABRA4)+ (0.1260 × expression value of ALPP).
Table 3. Overall information of 9 prognostic mRNAs associated with OS in CRC patient.
Risk stratification and ROC curve analyses indicate good performance of the 9-mRNA signature in predicting the OS of CRC patients
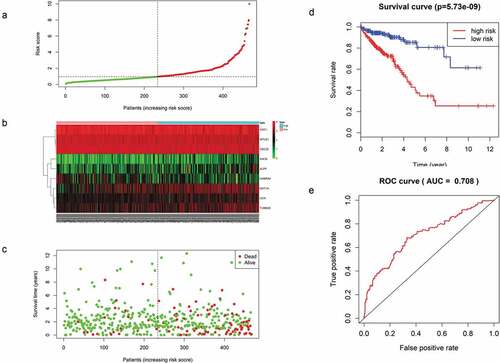
For each of these 467 patients, we calculated the RS based on the expression levels of these 9 mRNAs and classified them into a high- or low-risk group with the median RS as the cutoff point of 0.955. As a result, 233 patients were classified into the high-risk or low-risk group because their RS values were higher or lower, respectively, than the cutoff value ()). There was a significant difference in K-M survival curves between the two groups based on the RS values (p = 5.73e-09), and the 5-year OS ratios of high- and low-risk RSs patients were 43.1% and 85.3%, respectively ()). The prognostic ability of the 9-mRNA signature model was evaluated by calculating the AUC value of the ROC curve, whereby an AUC greater than 0.70 was considered to have good performance. In our study, the AUC value obtained was 0.708, indicating good sensitivity and specificity of the 9-mRNA signature model in predicting CRC patient OS ()). With the increase in RS, as shown in ), the expression levels of UCN, SNCB, MAT1A, TUBB2B, and ALPP showed an increasing trend, whereas those of AOC1, MTUS1, CDC20 and GABRA4 decreased. As shown in ), the mortality rate of patients diagnosed with CRC increased significantly with the increase in the RS calculated according to our model.
Figure 5. (a) Distribution of mRNA-related RSs in patients. (b) The expression heatmap of nine prognostic mRNAs. (c) The mortality of patients with an increase in the RS. (d) K-M survival curve analysis for the OS of CRC patients using the nine-mRNA signature. (e) ROC curve analysis of the nine-mRNA signature.
The prognostic value of the nine-mRNA signature is independent of conventional clinical factors
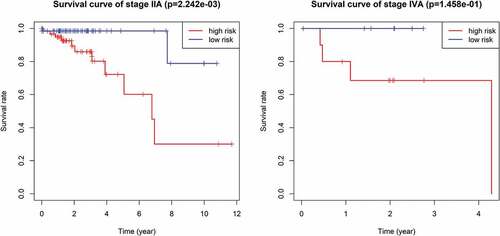
Multivariate Cox regression analysis showed that the 9-mRNA signature RS maintained independent predictive ability compared with other clinical factors (HR = 3.8438, 95% CI 2.36–6.26, P = 6.25e-08, as shown in ). Tumor lymph node metastasis (TNM) stage and age were also independent predictors of OS in CRC patients. Therefore, we conducted a further stratified analysis to examine whether the 9-mRNA signature can provide predictive value for patients in the same TNM stage or in the same age group. The log-rank test of phase II patients showed that the 9-mRNA signatures indeed was able to distinguish patients with significantly different survival times (P = 7.242e-05, )). Similar predictions for the 9-mRNA signature were observed in stage IV patients (P = 1.234e-02, )). However, there was no significant difference in the survival of stage I patients (P = .4208, )), and although the difference in the survival of stage III patients was obvious, the P value was 0.1721 ()), which was not statistically significant. To further verify the 9-mRNA signature would has prognostic significance in more precise staging, we subdivide stage II patients from the TCGA database into stage IIA, stage IIB and stage IIC. However, according to the database, there were only 9 cases of stage IIB, 2 cases of stage IIC and 134 cases of stage IIA. Therefore, we explored the differences in survival outcomes between the high-risk and low-risk groups of stage IIA patients based on the risk score of our model. The results showed that there is a significant difference in survival time, and the p value is 2.242e-03 ()). Among the patients with stage IV, there were 17 cases of stage IVA and only 1 case of stage IVB. Similarly, We found that there was a difference in survival time between the high and low risk groups of stage IVA patients, but it was no statistical significance, which may be related to the small sample size ()).The predictability of our model for the prognosis of patients in the same age group was also verified (less than 65 years old or more than 65 years old), and the results showed that the difference in survival outcomes of patients in both age groups was significantly different (P = 5.005e-06 in age >65 group and P = 2.327e-03 in age ≤65 group) ((e,f)).
Table 4. Multivariate Cox regression analysis of overall survival.
Figure 6. (A ~ F) Patients divided according to the pathological stages of the tumor or age and analyzed for differences in the corresponding survival based on the signature.
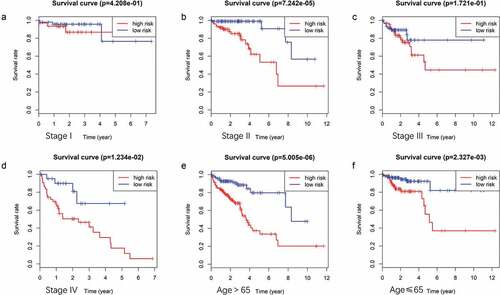
Figure 7. The survival difference of stage IIA and stage IVA between high and low risk groups of CRC patients.
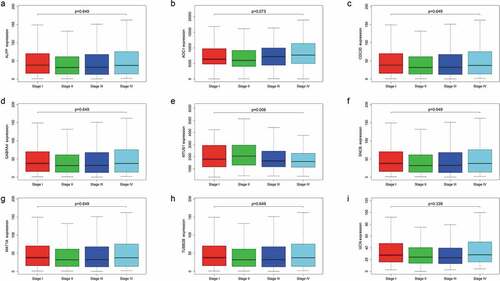
Finally, we compared the expression levels of the 9 mRNAs across four CRC subtypes and found that the levels of the other 8 mRNAs did not correlate significantly with TNM stage, except for MTUS1 (P = .006) (). Furthermore, We explored the correlation between these 9 mRNAs and mutation of Kras and Microsatellite instability, the results showed that MAT1A was significantly associated with Kras mutation, but other genes were not. UCN, ALPP, GABRA4 and MTUS1 were showed to have correlation with microsatellite instability according to our results. Thus, the 9-mRNA signature is not a subtype-specific marker and further indicates that the signature model is an independent prognostic factor associated with OS in patients with CRC.
Figure 8. Expression levels of the nine mRNAs across four colorectal cancer subtypes.
Discussion
CRC is a major public health issue and a major focus of gastrointestinal experts; although the incidence of CRC has declined significantly over the past 30 years, CRC is still the second leading cause of cancer-related death in many countries.Citation19 Tumors are heterogenetic tissues that contain CSCs.Citation20 Due to the tumorigenicity of CSCs, a more appropriate term may be “tumor-initiating cells” because they can produce all the cell types found in a particular tumor.Citation21 The CSC model of cancer suggests that tumorigenesis is a dynamic process in which normal cancer cells can dedifferentiate into CSCs, which in turn can differentiate into all types of cancer cells or CSCs with metastatic capacity.Citation22,Citation23 Tumor is considered to be a type of hierarchical tissue in which the pluripotent CSC is on top and responsible for the generation of tumor heterogeneity.Citation24 CSCs can even transdifferentiate into the vascular endothelium, forming vasculature to supply tumors.Citation25 Thus, we assume that there may be a series of genes both differentially expressed between CSCs and progeny tumor cells and between CSCs and normal cells. According to the relevant literature, CSCs express specific markers, which vary greatly according to the type and origin of the tumor, but there is no universal marker for CSCs. Most of the known CSC surface markers are derived from known embryonic or adult stem cell surface markers.Citation26 CD133, one of the best and least ubiquitous surface markers of CSCs, is a membrane-bound glycoprotein that is believed to be involved in primordial cell differentiation and the epithelial-mesenchymal transformation (EMT).Citation27 In addition, CD133 participates in cell proliferation through the Wnt signaling pathway and is associated with poor prognosis in CRC, glioma and hepatocellular carcinoma.Citation28
Because of the heterogeneity of tumors, traditional prognostic systems, such as the TNM staging system, often show imperfect estimates of risk stratification and clinical outcomes.Citation29 The present study involving a comprehensive analysis of mRNA expression data and patient survival information of 476 CRC patients documented in TCGA and a gene chip of Caco-2 cells, on which a microarray analysis was performed using CD133+ and CD133- sorted Caco-2 cells from GEO, revealed a set of genetic modifications as potential prognostic factors, with the value of the RS composed of these factors confirmed. In addition, based on the correlation between pathological stage and patient survival, we propose a new grouping system combining the RS and pathological stage for predicting the prognosis of stage II and IV CRC patients.
The carcinogenicity of colorectal CSCs is a multistep process characterized by a series of genetic alterations.Citation7,Citation10 Research on CSCs has begun to attract increasing attention, and computational annotations for assessing these mRNA functions have been proven to be effective.Citation30 We performed GO and KEGG enrichment analyses for our hypothetical gene sets to explore the functions of these 155 genes, and the results showed involvement in significant the biological processes and KEGG pathways mentioned above. The functions related to our enrichment results have been confirmed in previous studies. For example, studies have identified that hepatic stellate cells (liver-specific pericytes) can differentiate into tumor-related myofibroblasts under transforming growth factor beta (TGF-b) stimulation, which can promote the growth of tumors in the liver.Citation31 Another study found that GSDMC, a gene regulated by TGFBR2, promotes the proliferation of cancer cells during colorectal carcinogenesis.Citation32 It has also been reported that vitamin D inhibits proliferation and induces differentiation in CRC cells by inducing E-cadherin and inhibiting β-catenin signaling.Citation33 Furthermore, epidemiological studies have demonstrated the antitumor effect of vitamin D on CRC cells,Citation34 and overexpression of CXCR4 was found to promote EMT and infiltration of myeloid-derived suppressor cells (MDSCs) and macrophages in colonic tissue, accelerating colitis-associated and Apc mutation-driven colorectal tumorigenesis and progression.Citation35 Evidence has also been presented for a novel mechanism whereby LGR5 is coupled to the intracellular scaffold signaling protein IQGAP1 to regulate the actin cytoskeleton and cell-cell adhesion in CRC.Citation36 Using STRING, we identified interactions between the proteins expressed by the 155 genes, and further exploration showed that the expression level of 15 mRNAs correlated significantly with OS.
Finally, we developed a 9-mRNA signature that was able to predict the clinical outcome of CRC patients. To our knowledge, this is the first CSC-related predictive model using a cohort of more than 300 patients with CRC. The expression profiles of these common differentially expressed 155 mRNAs were analyzed by univariate and stepwise multiple Cox proportional hazards regression analyses. Nine RNAs were ultimately identified, and a prediction model based on the linear combination of these genes was established. The survival curves of patients with high RSs and low RSs were distinctively separated among the groups categorized by the predictive model. The AUC value obtained by ROC curve analysis was 0.708, which indicates that the model has high sensitivity and specificity. When considering other clinical factors, multivariate Cox regression analysis showed that the 9-mRNA signature was independent of traditional clinicopathological factors, including tumor stage, age, race and sex. Further stratified analysis indicated favorable discrimination by the 9-mRNA signature in predicting survival times of the same TNM stage and age group. This finding may provide an additional reference for clinicians to choose better personalized and effective treatments for patients with different survival risks and allows us to better understand the molecules involved in the transition from normal tissues to CSCs and the eventual formation of CRC tissues. However, further clinical studies are needed to verify the predictive effectiveness of this model, as is experimental research investigating the functions of the related mRNAs.
Materials and methods
Microarray information and the CRC patient dataset
The gene chip GSE24747, which was used for microarray analysis of CD133+ and CD133- sorted Caco-2 cells with three repeat samples each, was selected. After quality control using the affyPLM and affy packages and pretreatment with the RMA method in R language, the probe IDs obtained were converted into gene symbols. Missing values were supplemented with the limma package for subsequent differential expression gene analysis of the two cell types.
TCGA (http://cancergenome.nih.gov/) (as of March 2019) was used to collect preprocessed level 3 RNA-seq data and the corresponding clinical information for CRC samples. Patients included in the study were filtered by criteria of complete information for mRNA expression profiles and clinical characteristics (including age, sex, race, stage, survival status and survival time) ().
Screening of differentially expressed genes between CRC and normal tissues and mRNAs between CD133- and CD133+ Caco-2 cells
By setting the screening conditions as logFC>1 or logFC<(−1) and an adjusted P value<.05, the edgeR packageCitation37 in R language was employed to identify differentially expressed genes between CRC and normal tissues according to the inclusion criteria; the results were visualized as a volcano map using the gplots package in R. As described above, after pretreatment of the GEO dataset, we obtained genes that were significantly differentially expressed between CD133- and CD133+ Caco-2 cancer cells. Unsupervised hierarchical clustering was then performed based on the expression levels of these altered genes, as visualized as a heatmap ().According to our hypothesis, to obtain the differentially expressed genes between CSCs and normal tissues and progeny tumor cells, we examined intersections between these two gene sets, which revealed 155 mRNAs that, to a certain extent, represent our target candidate genes.
Functional enrichment, protein interaction and K-M survival analyses
To identify potential biological processes and pathways in which these significant mRNAs are involved, Gene Ontology (GO) biological function and Kyoto Encyclopedia of Genes and Genomes (KEGG) pathway enrichment analyses were carried out using clusterProfiler, org.hs.eg and pathview in R language, setting a p value <.05 as the cutoff criterion. To determine interactions among the corresponding protein products, the online website STRING (functional protein association networks) was used, and high confidence was set as 0.7. In addition, to explore which of these 155 genes correlate with the survival prognosis of CRC patients, the K-M method was applied, and overall survival (OS) curves between high- and low-risk patient groups were obtained.
Definition of the mRNA-related prognostic model
After univariate Cox analysis, eligible genes (p value < .05) were selected for multivariate Cox regression analysis using the survival R package. A 9-mRNA-based prognostic model was then established to assess the survival risk of each patient, as follows:
,
where K is the number of prognostic mRNAs, Ci represents the coefficient of the ith mRNA in multivariate Cox regression analysis, and Vi is the expression value of the ith mRNA. Ci > 0 was defined as a high-risk signal, and CI < 0 was defined as a protective mRNA.
Risk stratification (RS) and ROC curves
The RS of 476 patients was calculated according to the predictive signature model. The median RS was then used as the cutoff value to divide the patients into high- and low-risk groups. OS curves were generated using the K-M method, and the differences between the high- and low-risk patients were compared. The sensitivity and specificity of this prognostic model in predicting clinical outcomes were evaluated by calculating the area under the receiver operating characteristic (ROC) curve (AUC) using the survival ROC package.Citation38
Independence of the prognostic value of the nine-mRNA signature from other clinical variables and molecular features
To determine whether the predictive ability of the mRNA signature is independent of other clinical factors (including race, sex, stage and age) in CRC patients, multivariate Cox regression analysis was conducted with OS as the dependent variable and the mRNA signature and other conventional clinical factors as independent variables. For the clinical features with P < .05 in Cox regression analysis, further stratified analysis was performed to determine whether the mRNA signature has prognostic value for the same clinical factors. Furthermore, we used the KS test in R language to verify the relationship between the expression levels of the mRNAs in our model and four CRC subtypes. The correlation between these 9 mRNAs and mutation of Kras and Microsatellite instability were also explored and the results were showed in the supplementary files.
Supplemental Material
Download Zip (3.4 MB)Acknowledgments
The results shown here are in whole or part based upon data generated by the TCGA Research Network: http://cancergenome.nih.gov/and GEO database: https://www.ncbi.nlm.nih.gov/geo/.
Disclosure statement
The authors declare that there are no conflicts of interest.
Availability of data and materials
The data that support the findings of this study are openly available in the TCGA Research Network: http://cancergenome.nih.gov/ and GEO database: https://www.ncbi.nlm.nih.gov/geo/. Also can be availabled from the corresponding author upon reasonable request.
Additional information
Funding
References
- Siegel R, Ma J, Zou Z, Jemal A. Cancer statistics, 2014. CA Cancer J Clin. 2014;64(1):9–29. doi:10.3322/caac.21208.
- Bray F, Ferlay J, Soerjomataram I, Siegel RL, Torre LA, Jemal A. Global cancer statistics 2018: GLOBOCAN estimates of incidence and mortality worldwide for 36 cancers in 185 countries. CA Cancer J Clin. 2018;68(6):394–424. doi:10.3322/caac.21492.
- Bonnet D, Dick JE. Human acute myeloid leukemia is organized as a hierarchy that originates from a primitive hematopoietic cell. Nat Med. 1997;3(7):730–737. doi:10.1038/nm0797-730.
- Nguyen LV, Vanner R, Dirks P, Eaves CJ. Cancer stem cells: an evolving concept. Nature reviews. Cancer. 2012;12(2):133–143. doi:10.1038/nrc3184.
- Tysnes BB. Tumor-initiating and -propagating cells: cells that we would to identify and control. Neoplasia. 2010;12(7):506–515. doi:10.1593/neo.10290.
- Driessens G, Beck B, Caauwe A, Simons BD, Blanpain C. Defining the mode of tumour growth by clonal analysis. Nature. 2012;488(7412):527–530. doi:10.1038/nature11344.
- Moharil RB, Dive A, Khandekar S, Bodhade A. Cancer stem cells: an insight. J Oral Maxillofac Pathol. 2017;21(3):463. doi:10.4103/jomfp.JOMFP_132_16.
- Shah A, Patel S, Pathak J, Swain N, Kumar S. The evolving concepts of cancer stem cells in head and neck squamous cell carcinoma. The Scientific World Journal. 2014;2014:842491. doi:10.1155/2014/842491.
- Steinbichler TB, Dudás J, Skvortsov S, Ganswindt U, Riechelmann H, Skvortsova -I-I. Therapy resistance mediated by cancer stem cells. Semin Cancer Biol. 2018;53:156–167. doi:10.1016/j.semcancer.2018.11.006.
- Savage P. Chemotherapy curable malignancies and cancer stem cells: a biological review and hypothesis. BMC Cancer. 2016;16(1):906. doi:10.1186/s12885-016-2956-z.
- Paquet-Fifield S, Koh SL, Cheng L, Beyit LM, Shembrey C, Mølck C, Behrenbruch C, Papin M, Gironella M, Guelfi S. Tight junction protein claudin-2 promotes self-renewal of human colorectal cancer stem-like cells. Cancer Res. 2018;78(11):2925–2938. doi:10.1158/0008-5472.CAN-17-1869.
- Miraglia S, Godfrey W, Yin AH, Atkins K, Warnke R, Holden JT, Bray RA, Waller EK, Buck DW. A novel five-transmembrane hematopoietic stem cell antigen: isolation, characterization, and molecular cloning. Blood. 1997;90(12):5013–5021. doi:10.1182/blood.V90.12.5013.
- Ferrandina G, Petrillo M, Bonanno G, Scambia G. Targeting CD133 antigen in cancer. Expert Opin Ther Targets. 2009;13(7):823–837. doi:10.1517/14728220903005616.
- Schmohl JU, Vallera DA. CD133, selectively targeting the root of cancer. Toxins (Basel). 2016;8(6):6. doi:10.3390/toxins8060165.
- Fang DD, Kim YJ, Moore PA. Expansion of CD133 + colon cancer cultures retaining stem cell properties to enable cancer stem cell target discovery. Br J Cancer. 2010;102(8):1265–75.
- Kimberly D, Miller MPH. Cancer treatment and survivorship statistics, 2019. CA Cancer J Clin. 2019;69(5):363–385.
- Ting W, Chen L-M, Pao J-B, Yang Y-P, You B-J, Chang T-Y, Lan Y-H, Lee H-Z, Bao B-Y. Common genetic variants in Wnt signaling pathway genes as potential prognostic biomarkers for colorectal cancer. PLoS One. 2013;8(2):e56196–e56196. doi:10.1371/journal.pone.0056196.
- Duggan MA, Anderson WF, Altekruse S, Penberthy L, Sherman ME. The Surveillance, Epidemiology, and End Results (SEER) program and pathology. Am J Surg Pathol. 2016;40(12):e94–e102. doi:10.1097/PAS.0000000000000749.
- Corley DA, Peek JRM. When should guidelines change? A clarion call for evidence regarding the benefits and risks of screening for colorectal cancer at earlier ages. Gastroenterology. 2018;155(4):947–949. doi:10.1053/j.gastro.2018.08.040.
- Taniguchi H, Moriya C, Igarashi H, Saitoh A, Yamamoto H, Adachi Y, Imai K. Cancer stem cells in human gastrointestinal cancer. Cancer Sci. 2016;107(11):1556–1562. doi:10.1111/cas.13069.
- Boesch M, Spizzo G, Seeber A. Concise review: aggressive colorectal cancer: role of epithelial cell adhesion molecule in cancer stem cells and epithelial-to-mesenchymal transition. Stem Cells Transl Med. 2018;7(6):495–501. doi:10.1002/sctm.17-0289.
- Visvader JE, Lindeman GJ. Cancer stem cells in solid tumours: accumulating evidence and unresolved questions. Nat Rev Cancer. 2008;8(10):755–768. doi:10.1038/nrc2499.
- Al-Hajj M, Wicha MS, Benito-Hernandez A, Morrison SJ, Clarke MF. Prospective identification of tumorigenic breast cancer cells. Proc Natl Acad Sci USA. 2003;100(7):3983–3988. doi:10.1073/pnas.0530291100.
- Meacham CE, Morrison SJ. Tumour heterogeneity and cancer cell plasticity. Nature. 2013;501(7467):328–337. doi:10.1038/nature12624.
- Ricci-Vitiani L, Pallini R, Biffoni M, Todaro M, Invernici G, Cenci T, Maira G, Parati EA, Stassi G, Larocca LM. Tumour vascularization via endothelial differentiation of glioblastoma stem-like cells. Nature. 2010;468(7325):824–828. doi:10.1038/nature09557.
- Kim W-T, Ryu CJ. Cancer stem cell surface markers on normal stem cells. BMB Rep. 2017;50(6):285–298. doi:10.5483/BMBRep.2017.50.6.039.
- Abbasian M, Arab‐Bafrani Z. The most reliable surface marker for the identification of colorectal cancer stem-like cells: A systematic review and meta-analysis. J Cell Physiol. 2018;234(6):8192–8202.
- Rappa G, Fodstad O, Lorico A. The stem cell-associated antigen CD133 (Prominin-1) is a molecular therapeutic target for metastatic melanoma. Stem Cells. 2008;26(12):3008–3017. doi:10.1634/stemcells.2008-0601.
- Shackleton M, Quintana E, Fearon ER, Morrison SJ. Heterogeneity in cancer: cancer stem cells versus clonal evolution. Cell. 2009;138(5):822–829. doi:10.1016/j.cell.2009.08.017.
- Liao Q, Liu C, Yuan X, Kang S, Miao R, Xiao H, Zhao G, Luo H, Bu D, Zhao H. Large-scale prediction of long non-coding RNA functions in a coding–non-coding gene co-expression network. Nucleic Acids Res. 2011;39(9):3864–3878. doi:10.1093/nar/gkq1348.
- Tu K, Li J, Verma VK, Liu C, Billadeau DD, Lamprecht G, Xiang X, Guo L, Dhanasekaran R, Roberts LR. Vasodilator-stimulated phosphoprotein promotes activation of hepatic stellate cells by regulating Rab11-dependent plasma membrane targeting of transforming growth factor beta receptors. Hepatology. 2015;61(1):361–374. doi:10.1002/hep.27251.
- Miguchi M, Hinoi T, Shimomura M, Adachi T, Saito Y, Niitsu H, Kochi M, Sada H, Sotomaru Y, Ikenoue T. Gasdermin C is upregulated by inactivation of transforming growth factor β receptor type II in the presence of mutated Apc, promoting colorectal cancer proliferation. PLoS One. 2016;11(11):e0166422. doi:10.1371/journal.pone.0166422.
- Ferrer-Mayorga G, Gómez-López G, Barbáchano A, Fernández-Barral A, Peña C, Pisano DG, Cantero R, Rojo F, Muñoz A, Larriba MJ. Vitamin D receptor expression and associated gene signature in tumour stromal fibroblasts predict clinical outcome in colorectal cancer. Gut. 2017;66(8):1449–1462. doi:10.1136/gutjnl-2015-310977.
- Takada I, Makishima M. Control of inflammatory bowel disease and colorectal cancer by synthetic Vitamin D receptor ligands. Curr Med Chem. 2017;24(9):868–875. doi:10.2174/0929867323666161202145509.
- Yu X, Wang D, Wang X, Sun S, Zhang Y, Wang S, Miao R, Xu X, Qu X. CXCL12/CXCR4 promotes inflammation-driven colorectal cancer progression through activation of RhoA signaling by sponging miR-133a-3p. J Exp Clin Cancer Res CR. 2019;38(1):18–32. doi:10.1186/s13046-018-1014-x.
- Carmon KS, Gong X, Yi J, Wu L, Thomas A, Moore CM, Masuho I, Timson DJ, Martemyanov KA, Liu QJ. LGR5 receptor promotes cell–cell adhesion in stem cells and colon cancer cells via the IQGAP1–Rac1 pathway. J Biol Chem. 2017;292(36):14989–15001. doi:10.1074/jbc.M117.786798.
- Robinson MD, McCarthy DJ, Smyth GK. edgeR: a bioconductor package for differential expression analysis of digital gene expression data. Bioinformatics. 2010;26(1):139–140. doi:10.1093/bioinformatics/btp616.
- Heagerty PJ, Lumley T, Pepe MS. Time-dependent ROC curves for censored survival data and a diagnostic marker. Biometrics. 2000;56(2):337–344. doi:10.1111/j.0006-341X.2000.00337.x.