
ABSTRACT
Background
Unlike papillary thyroid cancer (PTC), anaplastic thyroid carcinoma (ATC) is extremely aggressive and rapidly lethal without effective therapies. However, the differences of master regulators and regulatory networks between PTC and ATC remain unclear. Methods: Three representative datasets comprising 32 ATC, 69 PTC, and 78 normal thyroid tissue samples were combined to form a large dataset. Differentially expressed genes (DEGs) were identified and enriched by limma package and gene set enrichment analysis, respectively. Subsequently, protein–protein interaction network and transcription factors (TFs) regulatory network were constructed to identify gene modules and master regulators. Further, master regulators were validated by RT-PCR and western blot. Finally, Kaplan-Meier plotter was applied to evaluate their prognostic values. Results: A total of 560 DEGs were identified as ATC-specific malignant signature. The regulatory network analysis showed that nine master regulators were significantly correlated with three gene modules and potentially regulated the expression of DEGs in three gene modules, respectively. Furthermore, CREB3L1, FOSL2, E2F1 and CAT were significantly associated with overall survival of thyroid cancer patients. FOXM1, FOSL2, MYBL2, AVEN and E2F1 were unfavorable factors of recurrence-free survival (RFS), while CAT was a favorable factor of RFS. RT-PCR and western blot confirmed that six TFs were obviously up-regulated in ATC tissues/cell line as compared with PTC and normal thyroid tissues/cell lines, respectively. In addition, 19 ATC-specific kinases were identified to illustrate the potential post-translational modification. Conclusions: Our findings provide a comprehensive insight into malignant mechanism of ATC, which may indicate their value in the future investigation of ATC.
Introduction
Thyroid cancer has become one of the most frequently diagnosed cancers worldwide, which is responsible for 5.1% of the total estimated female cancer burden in 2018.Citation1 Differentiated thyroid cancer (DTC), especially the papillary thyroid cancer (PTC), is the major type of thyroid cancer and has more than 90% cure rates. In contrast, anaplastic thyroid carcinoma (ATC) is one of the most aggressive endocrine malignancies that makes up 40% of all thyroid cancer deaths. The mean survival of ATC is only 6 months.Citation2 Unlike other thyroid cancers, the high frequency of extrathyroid extension, lymph node metastasis and distant metastasis in ATC patients underscores their extreme virulence.Citation3 Moreover, ATC is refractory to radioiodine ablation and traditional chemotherapy. Therefore, identifying the molecular differences of master regulators and regulatory networks between ATC and PTC are desperately needed.
In recent years, considerable studies have been made to elucidate the genetic complexity of ATC. Von Roemeling et al compared the mRNA expression in 12 ATCs and 13 normal thyroid tissues. They found aberrant lipid metabolism in ATC and identified fatty acid metabolism constituent stearoyl-CoA desaturase 1 (SCD1) as a novel oncogenic factor specifically correlated with aggressive thyroid cancer.Citation4 Tomas et al examined gene expression profiles of 60 thyroid tumors (11 ATC and 49 PTC) and 45 normal thyroid tissues and proposed a thyroid index that could distinguish PTCs from ATCs.Citation5 Using the same dataset, Hebrant et al demonstrated a 9-gene aggressive signature that clearly separated PTC and ATC. They also found several pathological features including dedifferentiation, glycolytic phenotypes, and epithelial to mesenchymal transition were much stronger in ATC.Citation6 Although these important advances have been achieved, the differences of master regulators and regulatory networks between ATC and PTC still remain mystic.
Large cohort gene expression studies provide a powerful tool in revealing novel oncogene pathways. Instead of individual studies, combining microarray gene expression data from multiple laboratories or array platforms can largely reduce systematic biases among different data sets. The rarity of ATC has leaded to the limitation of large cohort research, and small patient sample numbers, disease heterogeneity, and/or technical factors may cause inconsistent results between studies. To overcome the shortage, we integrated datasets from multiple studies to identify genes and pathways that uniquely and specifically changed in ATC.
In the current study, we screened the gene expression profiles from three datasets comprising 32 ATC, 69 PTC, and 78 normal thyroid tissue samples. The differentially expressed genes (DEGs) commonly shared by ATC and PTC were identified by the intersection of two comparisons. The ATC-specific malignant signature was screened by comparing ATC with normal thyroid tissue and PTC. Furthermore, gene set enrichment analysis was carried out to annotate the biological function of ATC-specific DEGs. Subsequently, transcription factors (TFs) regulatory network were constructed to identify the differences of master regulators between ATC and PTC. The prognostic relevance of ATC-specific master regulators in thyroid cancer were analyzed. Then, the expressions of ATC-specific master regulators were validated in independent patient samples. Finally, ATC-specific kinase landscape and the kinase-TFs regulatory network were also constructed.
Methods
Microarray data
Three representative microarray datasets (GSE29265, GSE65144, and GSE33630) comprising 32 anaplastic thyroid carcinomas (ATC), 69 papillary thyroid cancer (PTC), and 78 normal thyroid tissue samples were acquired from the Gene Expression Omnibus (GEO, http://www.ncbi.nlm.nih.gov/geo/). The microarray dataset of GSE29265 included 9 ATC, 20 PTC and 20 normal thyroids. The GSE65144 had 12 ATC and 13 normal thyroids,Citation4 and the GSE33630 dataset contained 11ATC, 49 PTC and 45 normal thyroids.Citation5 In addition, PTC samples in GSE29265 were consisted of 10 radiation-exposed and 10 non-exposed tissues. The PTC samples in GSE33630 comprised 22 radiation-exposed and 27 non-exposed tumors. These three datasets were all based on platform GPL570 (Affymetrix Human Genome U133 Plus 2.0 Array).
Data processing and identification of DEGs
To generate a large dataset, three microarrays described above were integrated together by surrogate variables analysis (sva) package. The sva package was widely applied for removing batch effects in high-throughput experiments.Citation7 Removing batch effects and estimating surrogate variables in differential expression analysis have been shown to reduce dependence, stabilize error rate estimates, and improve reproducibility.Citation8 The CEL files of three microarrays were merged and batches were adjusted by ComBat function. Robust Multichip Average algorithm was applied to conduct the background correction, normalization, and log2 transformation. Empirical Bayes method depending on the limma package was performed to identify ATC-specific genes by separately comparing ATC with PTC and normal thyroid samples.Citation9 For multiple testing, P values were adjusted by the Benjamini-Hochberg False Discovery Rate (FDR) algorithm. Additionally, the thresholds for DEGs filtration were set as |log2 fold change (FC)|≥1 and FDR<0.05. The consistent DEGs between ATC versus PTC and ATC versus normal thyroid tissues were considered as ATC-specific genes and were selected for further analysis.
Function annotation and pathway enrichment of DEGs
The R packages clusterProfiler, org.Hs.eg.db, and ggplot2 were applied to conduct Kyoto Encyclopedia of Genes and Genomes (KEGG) enrichment and Gene ontology (GO) annotation of the fundamental DEGs in thyroid cancer.Citation10 P values were adjusted using the Benjamini-Hochberg FDR method. The threshold was set as P < .05 and qvalue<0.2 to indicate statistically significant difference.
The Gene set enrichment analysis (GSEA) java software was used to interpret the biological function of ATC-specific genes under default settings (1000 permutations).Citation11 Eight major MSigDB (version 6.2) gene sets containing hallmark gene sets, positional gene sets, curated gene sets, motif gene sets, computational gene sets, GO gene sets, oncogenic gene sets and immunologic gene sets were chosen to perform GSEA.
Construction of protein–protein interaction (PPI) network and analysis of modules
Search Tool for the Retrieval of Interacting Genes (STRING, http://string-db.org/) database is widely applied to retrieve the PPI and to construct the PPI network.Citation12 The PPI network of ATC-specific DEGs was constructed by STRING and visualized by Cytoscape (v3.6.1). Then, Molecular Complex Detection (MCODE) was used to identify the key modules in the resulting PPI network.Citation13 The degree cutoff was set as five and k-core was set as two. Moreover, ClueGO was used to generate pathway interaction networks of each module.
Regulatory network construction and master regulator analysis
In order to identify the master regulators that targeted ATC-specific modules, the Cytoscape plugin iRegulon was applied to construct regulatory network.Citation14 The plugin previously described by Janky et al was depended on the typical ranking-and-recovery algorithm. The parameters were set to default when predicting TFs. Furthermore, TFs with normalized enrichment score (NES) >5 or targeting more than half of gene sets were chosen to generate the regulatory network. Additionally, Pearson correlation analysis between TFs and three modules were performed, respectively. TFs with Pearson r < −0.5 or >0.5 were considered as ATC-specific master regulators.
Screening of ATC-specific kinases and the phosphosite markers
To identify the ATC-specific kinases, the protein kinase list was retrieved from human kinome database (kinase.com) and was intersected with ATC-specific DEGs.Citation15 Further, PhosphoSitePlus (https://www.phosphosite.org) online tool was applied to retrieved the substrates of ATC-specific kinases. Finally, sequence logo was applied to indicate the phophosite markers. To construct the kinase-TFs interaction network, both ATC-specific kinases and master regulators were input into the STRING database to construct the PPI network.
Experimental validation of master regulators
To validate the master regulators identified above, 15 samples including six non-tumorous tissues, six PTC, and three ATC were acquired from patients with surgical resection. Pathological diagnosis of specimens was conducted at the time of assessment. Expression of candidate genes were detected by RT-PCR. Briefly, Trizol (Invitrogen, San Diego, CA, USA) was applied to extracted the total mRNA of each tissue. Subsequently, RNA was treated by the RT reagent kit (TAKARA, Dalian, China) and amplificated by the SYBR Premix Ex Taq Kit (TAKARA, Dalian, China). All the reactions were determined in triplicate. The primers were detailly listed in supplementary data (Table S1). The expression level of mRNA was calculated basing on the 2−ΔΔCt method. Results were expressed as the means ± standard deviation. Differences of multiple groups were calculated by One-way ANOVA within GraphPad Prism 5 software (GraphPad Software, Inc., La Jolla, CA, USA), respectively. P value <.05 was considered to be statistically significant. In vitro experiments were conducted in 8505 C (DSMZ, Cat# ACC-219), BCPAP (DSMZ Cat# ACC-273), and Nthy-ori 3–1 (ECACC, Cat# 90011609) cell lines. Western blot was employed to detect the protein expression of candidate TFs. The following primary antibodies were used: primary antibodies against E2F1, FOSL2, and AVEN were purchased from ABclonal (Wuhan, China). Anti-CREB3L1 antibody was from Abcam (Cambridge, USA). Antibodies against FOXM1 and B-Myb were purchased from Proteintech (Rosemont, USA), while anti-GAPDH antibody was obtained from Santa Cruz Biotechnology (Dallas, USA).
Kaplan-Meier survival analysis of master regulators in thyroid cancer
To assess the prognostic value of master regulators in thyroid cancer, a total of 502 patient samples with thyroid carcinoma from TCGA were split into two cohorts using the best cutoff of expression value computed by Kaplan-Meier plotter (www.kmplot.com).
Results
Patient samples and clinicopathological features
The clinicopathological features of patient samples from three microarray datasets were collected. The age, gender, and tumor size of ATC samples were not provided in three datasets. In GSE29265, there were 14 classical, 5 follicular, 1 solid PTC subtypes. The mean tumor size of PTC was 2.0 cm (0.6–6.0 cm). The PTC samples in GSE33630 comprised 21 classical, 16 follicular, 12 solid subtypes, and the mean tumor size was 2.2 cm (0.5–5.2 cm). The GSE65144 dataset only contained pathology variant of ATC. In the samples prepared for RT-PCR validation, the mean tumor sizes of PTC and ATC samples were 1.4 cm (0.6–2.0 cm) and 10.3 cm (7.0–14.0 cm), respectively. The clinicopathological information of patients was listed in Table 1.
Identification and gene function annotation of fundamental DEGs in thyroid cancer
To generate a large dataset, three microarray datasets containing GSE33630, GSE29265 and GSE65144 were downloaded and merged together with background correction (Figure S1(a)). Batch effects were removed by sva package (ComBat function) (Figure S1(b)). The boxplots showed that the median values of gene expression profile were almost at the same level after normalization, indicating that the pre-processing dataset was sufficient for the subsequent analysis (Figure S1(c)). Then, we also evaluated the potential effect of radiation exposure on the data analysis. No DEGs (FDR<0.05, |log2 FC|≥1) between sporadic and radiation-exposed PTC were found in the combined dataset or even in the original datasets (data not shown). Furthermore, the gene signatures of radiation exposure raised by Handkiewicz-Junak et al were also validated in the current analysis.Citation16 As shown in , these ten genes exhibited small differences between sporadic and radiation-exposed PTC both in the combined dataset and in the original datasets, indicating the radiation exposure factor in the current dataset has limited effect on our data analysis.
Figure 1. Identification and biological function annotation of thyroid cancer associated DEGs. (a-c) Expression of radiation signature in sporadic and radiation-exposed PTC from GSE29265, GSE33630, and combined dataset. (d-e) Consistently up- and down-regulated DEGs in ATC and PTC by comparing to normal thyroid tissues. (f-g) GO Biological Process annotation of up- and down-regulated DEGs, respectively. Top ten significantly enriched GO terms with lowest q value were plotted. (h-i) Pathway enrichment of up- and down-regulated DEGs by Kyoto Encyclopedia of Genes and Genomes (KEGG), respectively. Top ten significantly enriched pathways with lowest q value were plotted.
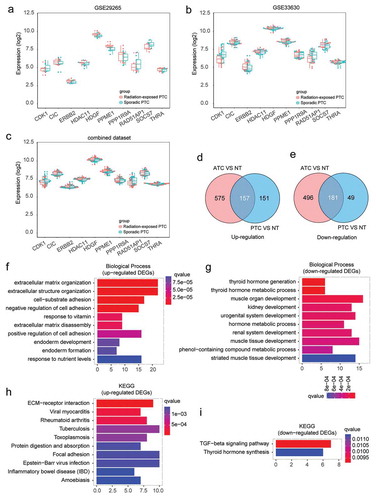
In order to explore the fundamental genes required for thyroid cancer, DEGs that commonly changed in ATC and PTC were identified. Compared with normal thyroid tissues, a total of 338 consistently changed DEGs (157 up-regulated and 181 down-regulated genes) were found in ATC and PTC ()). These DEGs were likely to play substantial roles in thyroid cancer initiation and progression.
The biological function of thyroid cancer related DEGs were then annotated by GO (biological process). The up-regulated DEGs were associated with extracellular matrix organization, extracellular structure organization, cell-substrate adhesion, negative regulation of cell adhesion, response to vitamin, extracellular matrix disassembly, positive regulation of cell adhesion, endoderm development, endoderm formation, and response to nutrient levels ()). The down-regulated DEGs were mainly enriched in thyroid hormone generation, thyroid hormone metabolic process, muscle organ development, kidney development, urogenital system development, hormone metabolic process, renal system development, muscle tissue development, phenol-containing compound metabolic process, and striated muscle tissue development ()). Pathway enrichment by KEGG suggested that the up-regulated DEGs were associated with ECM-receptor interaction, viral myocarditis, rheumatoid arthritis, tuberculosis, toxoplasmosis, protein digestion and absorption, focal adhesion, Epstein-Barr virus infection, inflammatory bowel disease (IBD), and amoebiasis ()). The down-regulated DEGs were enriched in TGF-beta signaling pathway and thyroid hormone synthesis ()). These enriched pathways or biological processes indicated pathological signals commonly occurred throughout both benign and aggressive thyroid cancer, which may be required for thyroid tumorigenesis and progression.
Identification of ATC-specific DEGs
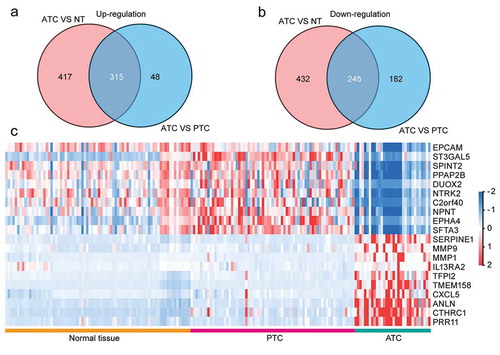
In order to identify the malignant signatures that specifically expressed in ATC, comparisons were made to discover consistently changed genes (FDR<0.05, |log2 FC|≥1) in ATC as compared with normal or PTC group. A total of 315 up-regulated DEGs and 245 down-regulated DEGs were obtained by the intersection of two comparisons (). Additionally, only 43% (315/732) up-regulated and 36% (245/677) down-regulated DEGs (ATC versus normal group) were consistently changed in the comparison of ATC and PTC. Moreover, 87% (315/363) up-regulated and 57% (245/427) down-regulated DEGs in ATC (ATC versus PTC) were consistently changed in the comparison of ATC and normal group ()). These results indicated that part of DEGs between ATC and PTC were redundantly identified, and applying intersection with DEGs between ATC and normal group could generate more specific ATC-associated malignant signature. Then, a heatmap of the top 10 up and down-regulated DEGs was displayed and these 20 DEGs could clearly distinguish ATC from normal thyroid tissues and PTC ()).
Figure 2. Identification of ATC-specific malignant signatures. (a) Intersection of consistently up-regulated DEGs in ATC as compared with normal thyroid tissues or PTC. (b) Intersection of consistently down-regulated DEGs in ATC as compared with normal thyroid tissues or PTC. (c) Heatmap of top 10 up and down-regulated DEGs in ATC.
Gene set enrichment analysis of ATC-specific DEGs
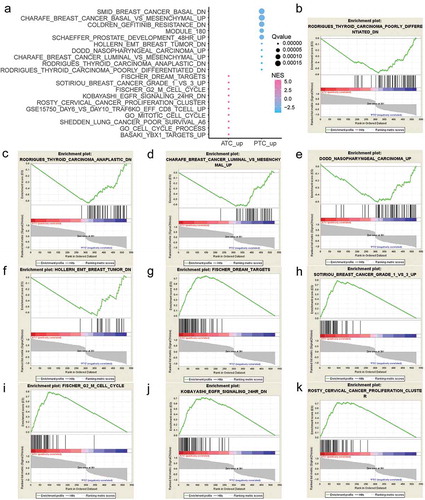
To explore the biological function of ATC-specific DEGs, gene set enrichment analysis (GSEA) was implemented between ATC and PTC groups to interpret gene expression profiles. By setting eight major MSigDB gene sets as references, 1135 and 344 gene sets are up-regulated in ATC and PTC, respectively. Moreover, 767 gene sets are significant at FDR < 25% in ATC, and 43 gene sets are significantly enriched at FDR < 25% in PTC. The top 20 gene sets that positively or negatively correlated with ATC are shown in ). Gene sets including FISCHER DREAM TARGETS, SOTIRIOU BREAST CANCER GRADE 1 VS 3 UP, FISCHER G2 M CELL CYCLE, KOBAYASHI EGFR SIGNALING 24 HR DN, ROSTY CERVICAL CANCER PROLIFERATION CLUSTER, GSE15750 DAY6 VS DAY10 TRAF6KO EFF CD8 T CELL UP, GO MITOTIC CELL CYCLE, SHEDDEN LUNG CANCER POOR SURVIVAL A6, GO CELL CYCLE PROCESS, and BASAKI YBX1 TARGETS UP were significantly correlated with ATC. The top 10 gene sets that negatively correlated with ATC were RODRIGUES THYROID CARCINOMA POORLY DIFFERENTIATED DN, RODRIGUES THYROID CARCINOMA ANAPLASTIC DN, CHARAFE BREAST CANCER LUMINAL VS MESENCHYMAL UP, DODD NASOPHARYNGEAL CARCINOMA UP, HOLLERN EMT BREAST TUMOR DN, SCHAEFFER PROSTATE DEVELOPMENT 48 HR UP, MODULE 180, COLDREN GEFITINIB RESISTANCE DN, CHARAFE BREAST CANCER BASAL VS MESENCHYMAL UP, and SMID BREAST CANCER BASAL DN. The top 10 enriched gene sets that positively or negatively correlated with ATC were plotted and displayed in .
Figure 3. Gene Set Enrichment Analysis (GSEA) of ATC-specific DEGs. (a) The top 20 gene sets that positively or negatively correlated with ATC. (b-f) Enrichment plot of top 5 enriched gene sets that up-regulated in PTC. (g-k) Enrichment plot of top 5 enriched gene sets that up-regulated in ATC. NES, normalized enrichment score.
Construction of PPI network
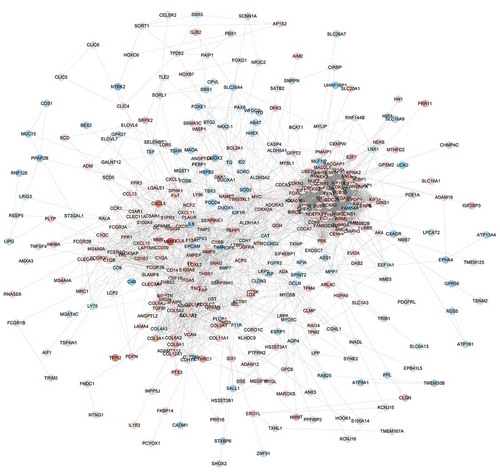
To systematically analyze the function of ATC-specific DEGs, the STRING database was applied to generate the PPI network. The showed that ATC-specific PPI network comprised 404 nodes interacting via 3395 edges. The top 5 nodes with highest degree in the PPI network were TOP2A (degree = 92), BIRC5 (degree = 77), CDK1 (degree = 75), CCNB1 (degree = 75), CCNA2 (degree = 73).
Figure 4. The protein-protein interaction network of ATC-specific DEGs. The PPI network was constructed by STRING and visualized by Cytoscape. Red nodes represented up-regulated DEGs. Blue nodes represented down-regulated DEGs.
Module analysis and gene function annotation
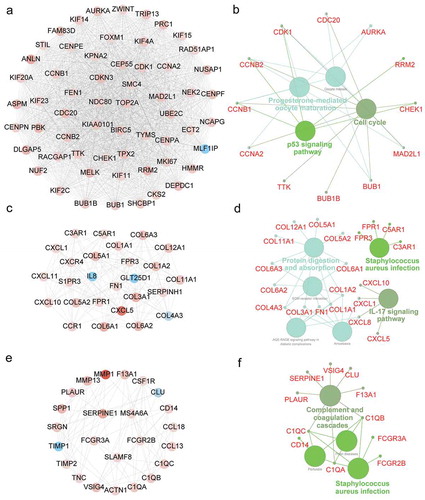
To identify the core modules in the PPI network, the Cytoscape plugin MCODE was employed. The Module 1 contained 59 key nodes, which were enriched in p53 signaling pathway, cell cycle, and progesterone-mediated oocyte maturation ()). Moreover, CDK1, CCNB2 and CCNB1were commonly involved in three pathways described above. The Module 2 consisted of 27 nodes, and they were associated with Staphylococcus aureus infection pathway, IL-17 signaling, and protein digestion and absorption (). Additionally, CXCL1 and CXCL8 were commonly shared by protein digestion and absorption and IL-17 signaling pathway. The Module 3 comprised 24 nodes, which were related with complement and coagulation and Staphylococcus aureus infection (). C1QA, C1QB and C1QC participated in both pathways above.
Figure 5. Module analysis of PPI network and gene function annotation. (a, c, e) Three most scored Modules in the PPI network were identified by MCODE algorithm. (b, d, f) Gene enrichment of Modules and construction of pathway interaction network were analyzed by GO (biological process) and KEGG in ClueGO.
Master regulators and regulatory network of ATC-specific DEGs
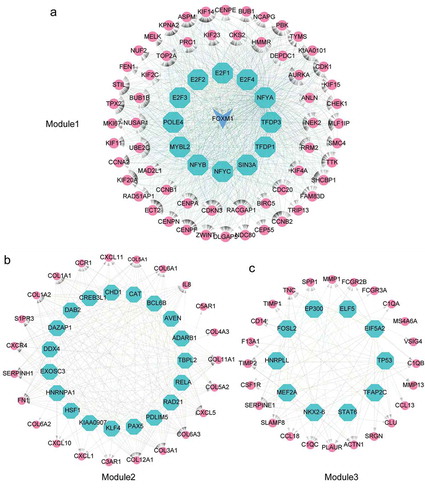
To demonstrate the master regulators that directly targeted the genes of three modules in ATC-specific PPI network, we used iRegulon to predict the transcription factors (TFs) and their targets. A total of 13 TFs were strongly enriched in the regulatory network of Module 1 ()). Intriguingly, FOXM1was not only a target of regulators, but also a master regulator of Module 1. NFYB, E2F1, E2F4, E2F2, TFDP3 and SIN3A were the TFs of FOXM1. Meanwhile, FOXM1 was significantly up-regulated in ATC and targeted more than 90% genes of Module1. NFYC, NFYB and FOXM1 were the top three TFs with normalized enrichment score (NES) of 12.859, 12.784 and 10.912, respectively. A total number of 19 TFs were considered as master regulators in the regulatory network of Module 2 ()). The highest NES in Module 2 were RELA (NES = 8.701), DDX4 (NES = 6.968) and CREB3L1 (NES = 6.298). In the regulatory network of Module 3, 10 TFs were identified, among which STAT6 (NES = 5.989), NKX2-6 (NES = 5.584), FOSL2 (NES = 5.327) were the top three enriched master regulators ()).
Figure 6. Identification of master regulators in regulatory network of ATC-specific modules. (a-c) Results of the regulatory analysis with iRegulon on three most scored modules. The red nodes represented regulated targets. The blue node was regulator and/or regulated target. The light cyan nodes indicated transcription factors.
Correlation analysis of master regulators and modules
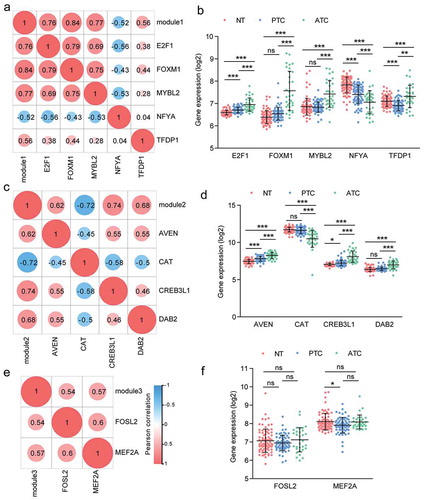
To identify the specific master regulators of three modules in the PPI network, we compared the expression profiles of all predicted TFs to expression profiles of targeted modules and analyzed the correlation between regulators and regulated genes. Depending on the correlation analysis, we found a total of 11 TFs were significantly correlated with three modules. In Module 1, E2F1, FOXM1, MYBL2 and TFDP1 were positively correlated with Module 1, while NFYA was negatively correlated with Module 1 ()). We noted that FOXM1 exhibited the highest correlation with Module 1 (Pearson r = 0.84, P value <.0001). Moreover, as the regulated target of E2F1, FOXM1 also exhibited high correlation with E2F1 (Pearson r = 0.79, P value <.0001) ()). Additionally, we found that NFYA negatively correlated with Module 1 (Pearson r = −0.52; P value < .0001) ()). The expression of NFYA was obviously declined in ATC tissues, which suggested that NFYA may function as a repressor gene of Module 1 ()). In Module 2, three TFs were positive correlation with Module 2, including AVEN, CREB3L1 and DAB2 ()). Additionally, the master regulator CAT showed negative correlation with Module 2 (Pearson r = −0.72; P value < .0001). CAT was also negatively correlated with CREB3L1 (Pearson r = −0.58; P value < .0001) and DAB2 (Pearson r = −0.5; P value < .0001) ()). AVEN, CAT, CREB3L1, and DAB2 were significantly changed in ATC as compared with normal and PTC group ()). There were two TFs exhibited high correlation with Module 3, containing FOSL2 and MEF2A (). Moreover, FOSL2 also showed positive correlation with MEF2A (Pearson r = 0.6; P value < .0001).
Figure 7. Correlation analysis of master regulators and three modules. (a, c, e) Pearson correlation analysis of TFs and modules. (b, d, f) The expression profile of TFs with Pearson r > 0.5 or < −0.5 were queried from microarray dataset. Results were showed as means ± SD in each group. * P < .05, ** P < .01, *** P < .001.
The landscape of ATC-specific kinase and phosphosite markers
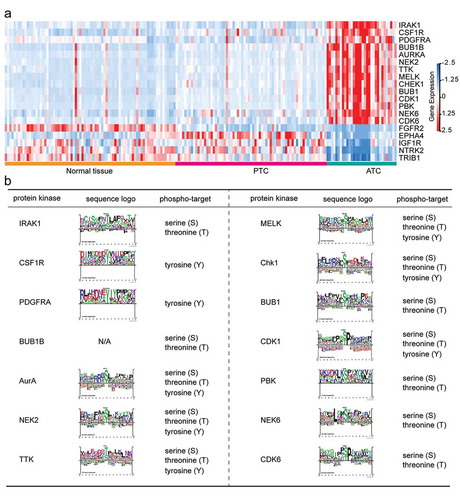
Dysregulations or mutations of kinases are known to play a causal role in tumorigenesis and cancer progression. Considerable studies are trying to turn these targets into valid drug candidates for emerging cancer therapies. In the present study, we also identified 19 ATC-specific kinases (14 up-regulated and 5 down-regulated kinases) that significantly changed in ATC as compared to PTC and normal tissues ()). These 19 ATC-specific kinases exhibited distinct expression manners as compared with PTC and normal tissues. Then, we also predicted the phospho-targets of 14 up-regulated kinases. Protein kinases including AurA (encoded by AURKA), TTK, MELK, Chk1 (encoded by CHEK1), NEK2, and CDK1 phosphorylated the threonine, serine and tyrosine sites of their substrates, while IRAK1, NEK6, BUB1B, BUB1, PBK, and CDK6 targeted the threonine and serine for phosphorylation modification ()). CSF1R and PDGFRA were tyrosine-specific kinases for their substrates. Finally, the consensus sequences of kinase substrates were depicted by sequence logo to suggest their phophosite markers ()). Except for BUB1B, the sequence logo of all kinases could be retrieved from PhosphoSitePlus database.
Figure 8. Identification of ATC-specific kinases and the phosphosite markers. (a) Heatmap of 19 featured kinases with expression values in different thyroid samples. (b) Phospho-target and the sequence logo of up-regulated protein kinases were listed.
Experimental validation of candidate TFs and construction of kinase-TFs regulatory network
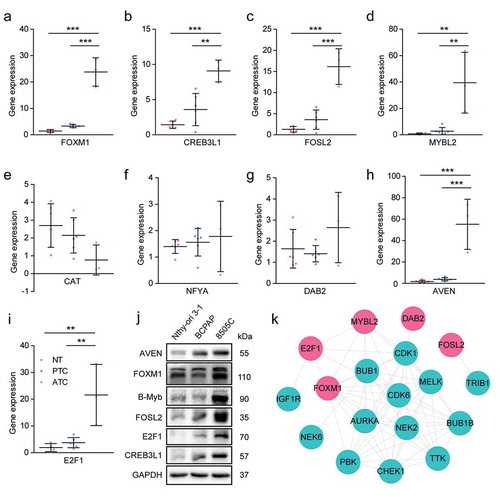
The expression pattern of candidate TFs were then validated by RT-PCR in ATC, PTC and normal thyroid tissues ()). The results showed that E2F1, FOXM1, MYBL2, AVEN, CREB3L1 and FOSL2 were significantly up-regulated in ATC when comparing with PTC and normal groups. CAT exhibited down-regulated trend in ATC. The expression level of NFYA was inconsistent with the microarray data, which may be due to the limitation of ATC sample numbers. Furthermore, six significant expressed TFs were also examined by western blot using cell lines. E2F1, FOXM1, B-Myb (encoded by MYBL2), AVEN, CREB3L1 and FOSL2 were obviously up-regulated in ATC cell line when comparing with PTC and normal cell lines ()). These results suggested that the identified TFs may act as master regulators during the malignant progression of thyroid cancer.
Figure 9. Experimental validation of candidate master regulators and construction of kinase-TFs interaction network. (a-i) The expression level of candidate master regulators was determined by RT-PCR. The sample numbers of each group were 6 normal thyroid tissues, 6 PTC and 3 ATC, respectively. NT, normal thyroid tissues. * P < .05, ** P < .01, *** P < .001. (j) Western blot analysis of candidate master regulators in Nthy-ori 3–1 (human thyroid follicular epithelial cell line), BCPAP (PTC cell line), and 8505 C (ATC cell line). (k) The PPI network of kinases and TFs. Red nodes indicated TFs, cyan nodes indicated protein kinases. TFs, transcription factors.
To provide a comprehensive view of mechanism underlying ATC aggressiveness, the kinase-TFs regulatory network was constructed. Among the 19 ATC-specific kinases, we only enrolled 14 up-regulated kinases and left the remaining five down-regulated kinases. The results indicated that several master regulators potentially interacted with protein kinases and may bear phosphorylation modification ()). DAB2 and FOSL2 showed single interaction with CDK1 and TRIB1, respectively. FOXM1 may be regulated by NEK2, MELK, AURKA, PBK, BUB1B, BUB1, CHEK1, and TTK. MYBL2 exhibited interaction with AURKA, MELK, CDK6, CDK1, and BUB1. Moreover, E2F1 showed potential interaction with CDK1, CDK6, and IGF1R. This regulatory network suggested that master regulators may facilitate the aggressive progression of thyroid cancer in coordination with protein kinases.
Survival analysis of ATC-specific master regulators
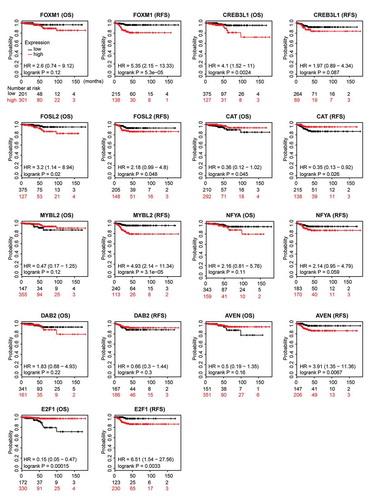
To evaluate the prognostic relevance of nine ATC-specific master regulators in thyroid cancer, the recurrence-free survival (RFS), overall survival (OS) and the best cutoff of gene expression were calculated by the Kaplan-Meier plotter. As shown in , high expressions of CREB3L1 (P = .0024), FOSL2 (P = .02), and E2F1 (P = .00015) were negatively associated with OS, while high expression of CAT (P = .045) was positively associated with OS. The analysis of RFS suggested that FOXM1 (P = .000053), FOSL2 (P = .048), MYBL2 (P = .000031), AVEN (P = .0067), and E2F1 (P = .0033) were unfavorable factors of prognosis, whereas CAT (P = .026) was a favorable factor of prognosis. Though these nine master regulators were identified from ATC, the prognostic relevance of these genes in thyroid cancer indicated their potential roles in facilitating tumor progression.
Figure 10. Prognostic relevance of nine ATC-specific master regulators in thyroid cancer. Overall survival (OS) and recurrence-free survival (RFS) of nine ATC-specific master regulators in thyroid cancer were retrieved from Kaplan-Meier plotter. Curves stratified by expression of FOXM1, CREB3L1, FOSL2, CAT, MYBL2, NFYA, DAB2, AVEN, and E2F1, respectively. Patients were split into low-expression group and high-expression group, according to the expression of nine genes above. Log-rank test was used to evaluate significance.
Discussion
In contrast to PTC, the extremely poor prognosis and limited therapeutic effect of ATC have caused considerable concern. Researchers have been focusing on the genomic or transcriptomic alteration in ATC leveraging different technologies.Citation4,Citation6,Citation17 However, the rarity and heterogeneity of ATC may raise confounding results in individual studies. In the current study, we generated a large dataset from three independent studies to explore the differences of regulatory networks between PTC and ATC. In accordance with the transcriptomic studies (data deposited as GSE65144) from Von Roemeling and colleagues,Citation4 our current dataset also showed that the oncogenic gene SCD1 was significantly increased by 5.0 and 2.4-fold in ATC as compared to normal tissues and PTC, respectively. Given that the radiation-associated thyroid cancer was reported to possess distinct molecular and driver mutation signatures,Citation16,Citation18,Citation19 we also explored the potential effect it could have on the data analysis. Under the current filtration criteria, no DEGs between sporadic and radiation-exposed PTC were found in our analyses, which was consistent with previous finding by Detours et al.Citation20 Though studies pointed out that there were small but significant differences between sporadic and radiation-exposed PTC,Citation16 our results indicated that the radiation factor elicited limited effect on the following analysis. Taking together, these results suggested that our combination of multiple datasets after removing batch effects could be feasible and sufficient for data analysis.
The malignant feature of ATC was driven by its complex molecular evolution. Identification of ATC-specific DEGs could provide a comprehensive view on tumor aggressiveness. In our current study, intersection of two comparisons was made to discover genes uniquely expressed in ATC as compared with normal or PTC groups. Gene set enrichment analysis indicated that dysregulation of cell cycle, cell mitosis, cell proliferation, immune status, and signatures in advanced cancer were significantly correlated with ATC. Module analysis and gene function annotation also suggested that one of the key modules was associated with cell cycle. Though several studies have pointed out that cell cycle genes were highly activated in ATC,Citation21,Citation22 our research provided the transcription factor regulatory network of modules and identified E2F1, FOXM1, MYBL2, TFDP1 and NFYA as potential master regulators of cell cycle associated module. The RB-E2F1 pathway and MMB-FOXM1 complex are critical for controlling G1/S and G2/M gene expression, respectively.Citation23 In consistence with in vitro results from Onda et al,Citation24 our tumor tissue validation also showed that E2F1 was significantly up-regulated in ATC. Moreover, our analysis illustrated the potential transcription targets of E2F1, which may be the mechanism of tumor cell cycle dysregulation. Transcription factor DP-1 (encoded by TFDP1) coordinates with E2F proteins to promote the transcription of E2F target genes and to regulate cell cycle. Recent studies indicated that abnormal expression of TFDP1 was involved in several cancers,Citation25-Citation27 while its role in ATC remains unclear. Taking together, these master regulators and their potential targets formed complex cell cycle gene regulatory networks, which may be responsible for rapid progression of ATC.
Aggressive cancers get the ability to manipulate their tumor microenvironments. In contrast to PTC, the excessive deposition of extracellular matrix was specifically found in ATC. Collagens were essential for regulating ECM-receptor interaction and protein digestion and absorption, which is thought to contribute to tumor malignancy. Strikingly, our results showed that the collagen family members constituted nearly 41% (11/27) nodes of Module 2. However, how these collagens were substantially up-regulated in ATC remained mystic. The TF regulatory network analysis indicated that CREB3L1, AVEN, DAB2, and CAT were the potential novel regulators of collagen family in ATC. CREB3L1 is a transcription factor of the CREB/activating transcription factor family. Recent studies showed that CREB3L1 participated in protein secretory pathway, and monoallelic and biallelic CREB3L1 variant lead to mild and severe osteogenesis imperfecta, respectively.Citation28,Citation29 Moreover, Feng et al demonstrated that CREB3L1 was a key downstream mediator of PERK-driven invasion and metastasis in breast cancer.Citation30 Our results revealed that transcriptional regulation of collagen family by CREB3L1 may be essential for the malignant feature of ATC, which holds promise for it to become the candidate target of ATC. The researches of CREB3L1, AVEN, DAB2, and CAT in ATC are limited, and our findings may illustrate their potential function and prognosis value in tumor progression.
Protein kinases are promising drug targets due to their essential functions in tumor initiation and progression. We identified 19 ATC-specific kinases and constructed kinase-TFs regulatory network. CDK1 was one of the top five hub genes that significantly increased in ATC. The CDK1, 2, 5, and 9 selective inhibitor dinaciclib caused cell cycle arrest in the G2/M phase and inhibited thyroid cancer cell proliferation.Citation31 Recently, a phase 3 trial investigating the safety and efficacy of dinaciclib was conducted in patients with relapsed/refractory chronic lymphocytic leukemia.Citation32 The anti-leukemic activity of dinaciclib provided potential strategy for ATC treatment. Moreover, the kinase-TFs regulatory network showed that CDK1 could interact with DAB2, FOSL2, MYBL2, and E2F1, which indicated a comprehensive mechanism in kinase-mediated tumor aggressiveness. PBK (PDZ-binding kinase) was critical kinase with highest fold change (log2 FC = 1.88, FDR = 2.37 × 10⁻¹⁴) among 19 ATC-specific kinases. Overexpression of PBK were associated with tumorigenesis and metastasis in various types of cancer. The expression of PBK contributed to poor outcome of esophageal squamous cell carcinoma, colorectal cancer, and gastric cancer,Citation33-Citation35 while the role of PBK had not been specifically implicated in ATC. As the selective inhibitors of PBK have shown their promising anti-cancer effects in preclinical models of aggressive cancers,Citation36-Citation38 the dramatic increase of PBK in ATC and its interaction with FOXM1 indicated PBK may act as another potential target for ATC.
In conclusion, our integrative transcriptomics study revealed malignant signatures in ATC and their clinical relevance in thyroid cancer. Several transcription factors were considered as the master regulators of ATC-specific DEGs in the regulatory network. Moreover, ATC-specific kinase landscape and kinase-TFs regulatory network were identified, which may provide new insights into malignant mechanism of ATC. It should be noted that there are some factors may still need to be considered in the future, such as sample asymmetry in three datasets, the potential effect of radiation-exposed PTC on data analysis. Notwithstanding the limitation, these findings provide an emerging rationale supporting the particular value of ATC-associated master regulators in future investigation.
Disclosure of potential conflicts of interest
The authors report no conflict of interest.
Supplemental Material
Download MS Word (1.4 MB)Acknowledgments
We would like to give our thanks to Prof. Biaoyang Lin and Dr. Ling Wang (Zhejiang University) for valuable bioinformatics discussion.
Supplementary material
Supplemental data for this article can be accessed on the publisher’s website.
Additional information
Funding
References
- Bray F, Ferlay J, Soerjomataram I, Siegel RL, Torre LA, Jemal A. Global cancer statistics 2018: GLOBOCAN estimates of incidence and mortality worldwide for 36 cancers in 185 countries. CA Cancer J Clin. 2018;68(6):394–424. doi:10.3322/caac.21492.
- Sherman SI. Thyroid carcinoma. Lancet. 2003;361:501–511. doi:10.1016/s0140-6736(03)12488-9.
- Chen J, Tward JD, Shrieve DC, Hitchcock YJ. Surgery and radiotherapy improves survival in patients with anaplastic thyroid carcinoma: analysis of the surveillance, epidemiology, and end results 1983-2002. Am J Clin Oncol. 2008;31:460–464. doi:10.1097/COC.0b013e31816a61f3.
- von Roemeling CA, Marlow LA, Pinkerton AB, Crist A, Miller J, Tun HW, Smallridge RC, Copland JA. Aberrant lipid metabolism in anaplastic thyroid carcinoma reveals stearoyl CoA desaturase 1 as a novel therapeutic target. J Clin Endocrinol Metab. 2015;100:E697–709. doi:10.1210/jc.2014-2764.
- Tomas G, Tarabichi M, Gacquer D, Hebrant A, Dom G, Dumont JE, Keutgen X, Fahey TJ 3rd, Maenhaut C, Detours V. A general method to derive robust organ-specific gene expression-based differentiation indices: application to thyroid cancer diagnostic. Oncogene. 2012;31:4490–4498. doi:10.1038/onc.2011.626.
- Hebrant A, Dom G, Dewaele M, Andry G, Tresallet C, Leteurtre E, Dumont JE, Maenhaut C. mRNA expression in papillary and anaplastic thyroid carcinoma: molecular anatomy of a killing switch. PLoS One. 2012;7(10):e37807–e37817. doi:10.1371/journal.pone.0037807.
- Leek JT, Johnson WE, Parker HS, Jaffe AE, Storey JD. The sva package for removing batch effects and other unwanted variation in high-throughput experiments. Bioinformatics. 2012;28:882–883. doi:10.1093/bioinformatics/bts034.
- Leek JT, Scharpf RB, Bravo HC, Simcha D, Langmead B, Johnson WE, Geman D, Baggerly K, Irizarry RA. Tackling the widespread and critical impact of batch effects in high-throughput data. Nat Rev Genet. 2010;11:733–739. doi:10.1038/nrg2825.
- Smyth GK. limma: linear models for microarray data. Bioinf Computat Biol Solutions Using R Bioconductor. 2011;397–420. doi:10.1007/0-387-29362-0_23.
- Yu G, Wang LG, Han Y, He QY. clusterProfiler: an R package for comparing biological themes among gene clusters. OMICS. 2012;16:284–287. doi:10.1089/omi.2011.0118.
- Subramanian A, Tamayo P, Mootha VK, Mukherjee S, Ebert BL, Gillette MA, Paulovich A, Pomeroy SL, Golub TR, Lander ES, et al. Gene set enrichment analysis: a knowledge-based approach for interpreting genome-wide expression profiles. Proc Natl Acad Sci U S A. 2005;102:15545–15550. doi:10.1073/pnas.0506580102.
- Szklarczyk D, Franceschini A, Wyder S, Forslund K, Heller D, Huerta-Cepas J, Simonovic M, Roth A, Santos A, Tsafou KP, et al. STRING v10: protein-protein interaction networks, integrated over the tree of life. Nucleic Acids Res. 2015;43:D447–452. doi:10.1093/nar/gku1003.
- Bader GD, Hogue CW. An automated method for finding molecular complexes in large protein interaction networks. BMC Bioinform. 2003;4:2–28. doi:10.1186/1471-2105-4-2.
- Janky R, Verfaillie A, Imrichova H, Van de Sande B, Standaert L, Christiaens V, Hulselmans G, Herten K, Naval Sanchez M, Potier D, et al. iRegulon: from a gene list to a gene regulatory network using large motif and track collections. PLoS Comput Biol. 2014;10(7):e1003731–e1003749. doi:10.1371/journal.pcbi.1003731.
- Manning G, Whyte DB, Martinez R, Hunter T, Sudarsanam S. The protein kinase complement of the human genome. Science. 2002;298:1912–1934. doi:10.1126/science.1075762.
- Handkiewicz-Junak D, Swierniak M, Rusinek D, Oczko-Wojciechowska M, Dom G, Maenhaut C, Unger K, Detours V, Bogdanova T, Thomas G, et al. Gene signature of the post-Chernobyl papillary thyroid cancer. Eur J Nucl Med Mol Imaging. 2016;43:1267–1277. doi:10.1007/s00259-015-3303-3.
- Pozdeyev N, Gay L, Sokol ES, Hartmaier RJ, Deaver KE, Davis SN, French JD, Vanden Borre P, LaBarbera DV, Tan AC, et al. Genetic analysis of 779 advanced differentiated and anaplastic thyroid cancers. Clin Cancer Res. 2018;24(13):3059–3068. doi:10.1158/1078-0432.CCR-18-0373.
- Stein L, Rothschild J, Luce J, Cowell JK, Thomas G, Bogdanova TI, Tronko MD, Hawthorn L. Copy number and gene expression alterations in radiation-induced papillary thyroid carcinoma from chernobyl pediatric patients. Thyroid. 2010;20:475–487. doi:10.1089/thy.2009.0008.
- Dom G, Tarabichi M, Unger K, Thomas G, Oczko-Wojciechowska M, Bogdanova T, Jarzab B, Dumont JE, Detours V, Maenhaut C. A gene expression signature distinguishes normal tissues of sporadic and radiation-induced papillary thyroid carcinomas. Br J Cancer. 2012;107:994–1000. doi:10.1038/bjc.2012.302.
- Detours V, Wattel S, Venet D, Hutsebaut N, Bogdanova T, Tronko MD, Dumont JE, Franc B, Thomas G, Maenhaut C. Absence of a specific radiation signature in post-Chernobyl thyroid cancers. Br J Cancer. 2005;92:1545–1552. doi:10.1038/sj.bjc.6602521.
- Evans JJ, Crist HS, Durvesh S, Bruggeman RD, Goldenberg D. A comparative study of cell cycle mediator protein expression patterns in anaplastic and papillary thyroid carcinoma. Cancer Biol Ther. 2012;13:776–781. doi:10.4161/cbt.20560.
- Pita JM, Figueiredo IF, Moura MM, Leite V, Cavaco BM. Cell cycle deregulation and TP53 and RAS mutations are major events in poorly differentiated and undifferentiated thyroid carcinomas. J Clin Endocrinol Metab. 2014;99:E497–507. doi:10.1210/jc.2013-1512.
- Fischer M, Grossmann P, Padi M, DeCaprio JA. Integration of TP53, DREAM, MMB-FOXM1 and RB-E2F target gene analyses identifies cell cycle gene regulatory networks. Nucleic Acids Res. 2016;44:6070–6086. doi:10.1093/nar/gkw523.
- Onda M, Nagai H, Yoshida A, Miyamoto S, Asaka S, Akaishi J, Takatsu K, Nagahama M, Ito K, Shimizu K, et al. Up-regulation of transcriptional factor E2F1 in papillary and anaplastic thyroid cancers. J Hum Genet. 2004;49:312–318. doi:10.1007/s10038-004-0146-3.
- Moscovich M, LeDoux MS, Xiao J, Rampon GL, Vemula SR, Rodriguez RL, Foote KD, Okun MS. Dystonia, facial dysmorphism, intellectual disability and breast cancer associated with a chromosome 13q34 duplication and overexpression of TFDP1: case report. BMC Med Genet. 2013;14:70. doi:10.1186/1471-2350-14-70.
- Chen C, Liu J, Zhou F, Sun J, Li L, Jin C, Shao J, Jiang H, Zhao N, Zheng S, et al. Next-generation sequencing of colorectal cancers in chinese: identification of a recurrent frame-shift and gain-of-function Indel mutation in the TFDP1 gene. OMICS. 2014;18:625–635. doi:10.1089/omi.2014.0058.
- Zhan W, Wang W, Han T, Xie C, Zhang T, Gan M, Wang JB. COMMD9 promotes TFDP1/E2F1 transcriptional activity via interaction with TFDP1 in non-small cell lung cancer. Cell Signal. 2017;30:59–66. doi:10.1016/j.cellsig.2016.11.016.
- Garcia IA, Torres Demichelis V, Viale DL, Di Giusto P, Ezhova Y, Polishchuk RS, Sampieri L, Martinez H, Sztul E, Alvarez C. CREB3L1-mediated functional and structural adaptation of the secretory pathway in hormone-stimulated thyroid cells. J Cell Sci. 2017;130:4155–4167. doi:10.1242/jcs.211102.
- Keller RB, Tran TT, Pyott SM, Pepin MG, Savarirayan R, McGillivray G, Nickerson DA, Bamshad MJ, Byers PH. Monoallelic and biallelic CREB3L1 variant causes mild and severe osteogenesis imperfecta, respectively. Genet Med. 2018;20:411–419. doi:10.1038/gim.2017.115.
- Feng YX, Jin DX, Sokol ES, Reinhardt F, Miller DH, Gupta PB. Cancer-specific PERK signaling drives invasion and metastasis through CREB3L1. Nat Commun. 2017;8:1079. doi:10.1038/s41467-017-01052-y.
- Lin SF, Lin JD, Hsueh C, Chou TC, Wong RJ. A cyclin-dependent kinase inhibitor, dinaciclib in preclinical treatment models of thyroid cancer. PLoS One. 2017;12(2):e0172315- e0172342. doi:10.1371/journal.pone.0172315.
- Ghia P, Scarfo L, Perez S, Pathiraja K, Derosier M, Small K, McCrary Sisk C, Patton N. Efficacy and safety of dinaciclib vs ofatumumab in patients with relapsed/refractory chronic lymphocytic leukemia. Blood. 2017;129:1876–1878. doi:10.1182/blood-2016-10-748210.
- Ohashi T, Komatsu S, Ichikawa D, Miyamae M, Okajima W, Imamura T, Kiuchi J, Kosuga T, Konishi H, Shiozaki A, et al. Overexpression of PBK/TOPK relates to tumour malignant potential and poor outcome of gastric carcinoma. Br J Cancer. 2017;116:218–226. doi:10.1038/bjc.2016.394.
- Su TC, Chen CY, Tsai WC, Hsu HT, Yen HH, Sung WW, Chen CJ. Cytoplasmic, nuclear, and total PBK/TOPK expression is associated with prognosis in colorectal cancer patients: A retrospective analysis based on immunohistochemistry stain of tissue microarrays. PLoS One. 2018;13(10):e0204866–e0204876. doi:10.1371/journal.pone.0204866.
- Ohashi T, Komatsu S, Ichikawa D, Miyamae M, Okajima W, Imamura T, Kiuchi J, Nishibeppu K, Kosuga T, Konishi H, et al. Overexpression of PBK/TOPK contributes to tumor development and poor outcome of esophageal squamous cell carcinoma. Anticancer Res. 2016;36:6457–6466. doi:10.21873/anticanres.11244.
- Joel M, Mughal AA, Grieg Z, Murrell W, Palmero S, Mikkelsen B, Fjerdingstad HB, Sandberg CJ, Behnan J, Glover JC, et al. Targeting PBK/TOPK decreases growth and survival of glioma initiating cells in vitro and attenuates tumor growth in vivo. Mol Cancer. 2015;14:121. doi:10.1186/s12943-015-0398-x.
- Gao T, Hu Q, Hu X, Lei Q, Feng Z, Yu X, Peng C, Song X, He H, Xu Y, et al. Novel selective TOPK inhibitor SKLB-C05 inhibits colorectal carcinoma growth and metastasis. Cancer Lett. 2019;445:11–23. doi:10.1016/j.canlet.2018.12.016.
- Kar A, Zhang Y, Yacob BW, Saeed J, Tompkins KD, Bagby SM, Pitts TM, Somerset H, Leong S, Wierman ME, et al. Targeting PDZ-binding kinase is anti-tumorigenic in novel preclinical models of ACC. Endocr Relat Cancer. 2019;26:765–778. doi:10.1530/ERC-19-0262.