
ABSTRACT
Breast cancer is the most common malignant tumor in women. Its incidence is associated with obesity and metabolic syndrome (MetS), which are highly prevalent world widely and have been identified as poorer prognosis factors in breast cancer including triple-negative breast cancer (TNBC), which has poorer response to chemotherapy, radiotherapy, and endocrine therapy. Programmed death ligand 1 (PD-L1) is one of the immune checkpoints ligands that facilitates tumor escape and progress. Obesity/MetS could cause systemic inflammation and immune disorders, however, whether and how obesity/MetS affect PD-L1 expression in breast cancer had not been clarified. In the present study, we examined the PD-L1 expression profile in breast cancer either in online database or cell lines. We found higher PD-L1 mRNA level but not DNA copy number in breast cancer than normal breast tissue, and higher PD-L1 expression in TNBC than other subtypes. Moreover, we found a positive relationship between PD-L1 expression in TNBC and metabolic complications in patients. Next, obesity/MetS related M1 macrophage was found to promote the expression of PD-L1 in breast cancer cells cocultured with polarized macrophages derived from either monocyte-like cell line THP-1 or Wistar rat models. IL6/JAK/STAT pathway was further identified to be involved in the process. In addition, we discovered that the PD-L1 expression promoted by obesity/MetS could be restored by telmisartan, one of the angiotensin II receptor blockers (ARBs) and could affect macrophage polarization, through its selective peroxisome proliferator-activated receptor-gamma (PPARG) activation and NFKB p65 inhibition and therefore downregulates IL6 secretion from M1 macrophage.
Introduction
Tumor-expressed programmed cell death ligand 1 (PD-L1, also named CD274) interacts with programmed death protein 1 (PD-1), one of the immune checkpoints, inducing tumor-infiltrated cytotoxic T cells death and consequently lead to cancer immune avoidance.Citation1,Citation2 Immunotherapy targeting PD-L1/PD-1 axis has achieved impressive successCitation3–5 but yet has limits in some patients, and the underlying mechanisms are not well understood.Citation6 Finding out the factors that affect PD-L1 expression may be helpful to improve the efficacy of immunotherapy.
Triple-negative breast cancer (TNBC), defined as the negative expression of estrogen receptor (ER), progesterone receptor (PR) and HER2/neu (HER2), accounts for approximately 20% of breast cancer.Citation7 It has more aggressive features and poorer response to conventional chemotherapy and radiotherapy. Besides, TNBC patients cannot benefit from endocrine therapy while no molecular-targeted drugs were approved in treating early-stage TNBC.Citation8 The previous study suggested that PD-L1 expression is 20%-58.6% positive in TNBC, higher than in other subtypes,Citation9 thus PD-L1/PD-1 targeted immunotherapy may be beneficial to the treatment of TNBC. Here we focus on studying TNBC PD-L1 expression profiles together with the influencing factors that are related to systemic inflammation and immune status, and try to explore the potential immunological interventions.
Obesity and metabolic syndrome (MetS) are highly and increasingly prevalent across the world nowadaysCitation10,Citation11 and significantly worsen the prognosis of breast cancer, including TNBC.Citation12,Citation13 Macrophage has been found to closely interact with tumor cells and play important roles in tumor proliferation, angiogenesis, migration, and invasion.Citation14 In obesity/MetS conditions, however, the macrophage is largely altered in its biological characteristics and functions. It generally polarizes into a pro-inflammatory status, which is defined as M1 and secrets inflammation-related cytokines such as IL-1, IL-6, type I IFN, and TNF-α.Citation15,Citation16 These cytokines are usually fundamental in regulating immune responses involved in immune defense, autoimmunity, and tissue repair. Therefore, we supposed that there might be some associations between obesity/MetS related macrophage and the expression of PD-L1 in TNBC.
Angiotensin II receptor blockers (ARBs) are widely used in the clinical treatment of hypertension. Telmisartan, one of the ARBs, reportedly had more beneficial effects on insulin sensitivity than other angiotensin II receptor blockers and was identified to have selective PPAR gamma (PPARG) modulating activity.Citation17 Moreover, telmisartan could also reverse adipose tissue macrophage’s polarization into pro-inflammatory M1 in high-fat-fed miceCitation18 and is effective in regulating the inflammatory status in patients by increasing the serum level of adiponectin and decreasing that of IL-6 and TNF-αCitation19 Based on the previous findings, we assumed that telmisartan could modulate tumor immunity by regulating the systemic immune and inflammation status besides its effects in treating hypertension.
In the present study, we analyzed the PD-L1 expression profile in breast cancer by bioinformatic analysis and cell lines by western blot, and then explored the relationship between obesity/MetS and PD-L1 expression in TNBC patient specimen. Results showed that the PD-L1 expression was higher in breast cancer tissue than that in normal breast tissue, higher in TNBC than in other subtypes, and was largely regulated at the mRNA level rather than in DNA copy numbers. Moreover, we found that there was a significant correlation between PD-L1 expression and metabolic complications. Further study found that obesity/MetS could promote PD-L1 expression in TNBC cell line by promoting the macrophage polarization into M1, through IL6/JAK/STAT pathway. More interesting, we identified telmisartan as a potentially effective intervention for its reverse effect in the process of obesity/MetS promoting PD-L1 expression.
Materials and methods
Bioinformation analysis
PD-L1 mRNA expression and DNA copy number data in both carcinoma and normal tissues from TCGA breast database were analyzed on the Oncomine platform (http://www.oncomine.org). PD-L1 mRNA expression comparison between TNBC and non-TNBC in Curtis Breast, TCGA Breast, Kao Breast, and Bittner Breast were also analyzed. We chose these four datasets because they had the largest sample sizes in Oncomine database. The difference between groups was compared by the sample sizes, medians, and mid-quartile ranges, and the P value was calculated using Luo’s methods.Citation20 P values less than 0.05 were considered statistically significant. The PD-L1 mRNA expression data, macrophage-derived cytokine receptors, and obesity/MetS related genes in breast cancer were downloaded from the UCSC Xena database (http://xena.ucsc.edu/).Citation21 Data were analyzed with Pearson correlation by SPSS (version 20.0; SPSS) and illustrated by “pheatmap” package in R project (version 3.5.1) (http://www.r-project.org). The PPI (protein–protein interaction) networks were mined on STRING platform (https://string-db.org)Citation22 and illustrated by CYTOSCAPE (version 3.7.0).Citation23
Patients and samples
All the experimental operation abided by the requirements of the Human Ethics Committee of the First Affiliated Hospital of Xi’an Jiaotong University.
60 TNBC patients were selected equally from three BMI groups: normal weight (18.5≤ BMI<24), overweight (24≤ BMI<28), and obesity (28≤ BMI). Groups were set according to the Chinese WS/T criteria of weight for adults.Citation24 All the patients had received mastectomy without any preoperative treatment and were diagnosed with TNBC by the standard pathological process. Patients’ tumor specimens were collected for immunohistochemistry staining and analysis.
MetS is defined as affected by any 3 of 5 constituting diagnosis of elevated waist circumference, elevated triglycerides, reduced HDL-C, elevated blood pressure, and elevated fasting glucose in the AHA/NHLBI Scientific Statement.Citation25 But because waist circumference data cannot be completely traced back from the patients’ history records, we only collected data for the other constituting diagnosis. Thus, in this study, we defined hypertension, dyslipidemia, and hyperglycemia as metabolic complications. A patient who was affected by any of the three metabolic disorders was considered to be affected by metabolic complication.
Immunohistochemistry and scoring
Immunohistochemistry was performed on paraformaldehyde-fixed paraffin sections (4 μm thick). Firstly, the sections were baked at 60°C overnight and then deparaffinized in xylene and rehydrated in graded ethanol. Antigen retrieval was performed by treatment with EDTA solution (PH = 8.0) at 95°C-100°C for 15 min in a microwave oven. Endogenous peroxidase activity was quenched in 3% H2O2 for 15 min when the sections were cooled slowly to room temperature. The sections were then washed three times with PBS and blocked with 5% goat serum in PBS for 30 min at room temperature. Next, the sections were incubated with the PD-L1 antibody (1:100, Abcam, ab205921), at 4°C overnight. Samples were warmed and washed with PBS then incubated with biotinylated secondary rabbit antibody (ZSGB-Bio, SP-9001) for 30 min at room temperature. Then, the sections were incubated with diaminobenzidine and counterstained with hematoxylin. Finally, the sections were dehydrated in graded ethanol, transparentized in xylene and mounted in Cytoseal.
PD-L1 expression percentage in tumor cells of each specimen was independently examined by two pathologists blinded to patients’ clinical characteristics. PD-L1 expression percentage lower than 1% is considered as negative, referring to a previous study.Citation26 Mean expression percentage of all the positive specimen is 20%, and it was used as a cutoff point to distinguish low expression from high.
Cell lines and treatments
Human breast cancer cell lines MCF-7, MDA-MB-231, ZR-75-30, MDA-MB-453, T-47D, MDA-MB-468, HCC1806, human breast non-tumorigenic epithelial cell line MCF-10A and human monocytic cell line THP-1 were all purchased from Shanghai Cell Bank, Chinese Academy of Sciences. MCF-7, T-47D, HCC1806 were cultured in DMEM medium, MDA-MB-231, MDA-MB-453, MDA-MB-468 were in L-15 medium, and ZR-75-30, THP-1 were in RPMI-1640 medium. All the culture media were supplemented with 10% fetal bovine serum (FBS; Gibco) and 1% penicillin-streptomycin. Cells in DMEM or RPMI-1640 media were incubated at 37°C with an atmosphere of 5% CO2 while cells in L-15 medium were in 37°C incubator without extra CO2. Non-tumorigenic MCF-10A culture method used was as described previously.Citation27 Cells at passages 3 to 15 were applied in the experiment.
THP-1 was used as a model for human monocytes.Citation28,Citation29 Suspending THP-1 cells were stimulated by PMA (50 ng/ml, Solarbio, P6741) at day 0 and became adherent cells on day 3, which were defined as M0 macrophage. Then, cultured the cells in fresh media and treated with LPS (20 ng/ml, Sigma, L4391), IFN-γ (20 ng/ml, Peprotech, 200–06) and IL-6 (20 ng/ml, Peprotech, 300–01A) to obtain CD80 and CD86 highly expressed M1 macrophage at day 5. The polarization-inducing process followed Peng ZY’s methods.Citation30
Telmisartan (T8949) used in the experiment was obtained from Sigma. Humanized IL6 competitive inhibitor Tocilizumab (A2012), selective PPARG inhibitor T0070907 (S287104) and NFKB transcription inhibitor JSH-23 (S735101) were obtained from Selleck Chemicals.
Rat models and peritoneal macrophages
The obesity/MetS Wistar rat models were established and kindly provided by professor Tian (Department of Cardiology, the First Affiliated Hospital, Xi’an Jiaotong University) by their established methods.Citation31 There were two groups of Wistar rat models- normal weight rats as control group and MetS rats as study group. The rats were killed by cervical dislocation. Macrophages were isolated by washing the rat peritoneal cavity with 50 ml cold (2–8°C) RPMI-1640 medium supplemented with 1% penicillin-streptomycin. Deposited cells were then washed twice and adjusted to 1 × 10⁷ cell/ml in RPMI-1640 culture medium supplemented with 10% FBS (Gibco) and 1% penicillin-streptomycin. Next, cultured the cells for 2h and gently washed them twice to remove the non-adherent cells. The remaining adherent cells were highly enriched for macrophages (≥95%).Citation32 The macrophages derived from these rat models were named as normal weight rat macrophage (NWM), obese rat macrophage (ORM), or telmisartan (10 µM) treated obese rat macrophage (Tel-ORM), respectively.
Coculture systems
Breast cancer cells and breast epithelial cell were cocultured with macrophages in 6-well culture plated by using 0.4 µm transwell chambers (EMD Millipore). 1 × 10⁵ THP-1 cells were seeded in the transwell chambers and induced to polarize following the methods described above. One day prior to the coculture process, MDA-MB-231, MCF-7 and MCF-10A were seeded in new 6-well plates at 2 × 10⁵ cells per well, 1 × 10⁵ cells per well, and 3 × 10⁵ cells per well, respectively. The next day, when the cells adhered to the wells, put the transwell chambers with macrophages of different kinds into the wells. Then, cocultured the cells afterward for 48 h before further analyses.
Western blot assay and antibodies
The cells were harvested then lysed with RIPA buffer supplemented with protease inhibitors according to the manufacturer’s instructions (Pioneer Biotechnology). Equal amounts of protein were separated by 10% SDS-PAGE gel and then transferred onto PVDF membrane (Roche). The immunoblots were incubated in 5% (w/v) skim milk powder dissolved in TBST (10 mM Tris–HCl, pH 8.0, 150 mM NaCl, and 0.05% Tween-20) for 2h at room temperature then incubated with indicated antibodies. GAPDH was used as a control. Antibodies are listed in Supplementary Table 1.
ELISA analysis
Indicated macrophages were seeded, cultured, and pretreated first, then culture for another 24 h in fresh culture medium without FBS or other additives. After that the supernatant was collected for ELISA analysis. The human IL6 (NeoBioscience, EHC007) and TNF-α ELISA kits (NeoBioscience, EHC103a) were used to measure IL6 and TNF-α concentrations following the manufacturer’s instructions.
RNA extraction and quantitative real-time PCR (qRT-PCR)
Total RNA was isolated from cultured cells using the trizol method. cDNA was synthesized using Prime Script RT reagents (Takara, RR036A). The real-time PCR was performed using SYBR Green PCR reagents (Takara, RR820A) according to the manufacturer’s manuals. GAPDH was used as the control. The sequences of the primers for real-time PCR are listed in the Supplementary Table 2.
IL6 shRNA lentivirus transfection
IL6 shRNA (shIL6) and negative control (shNC) lentiviral vectors were purchased from GeneChem. The target sequence of IL6 shRNA was GACAAACAAATTCGGTACAT. The THP-1 cells were seeded at 1 × 10⁴ cells/well into 24-well plates at five days prior to transfection. Then, pretreated the cells to induce M1 polarization following the methods described above. The M1 macrophages were 50–70% confluence when the transfection was carried out by adding lentiviral particles (MOI = 20), polybrene (5 μg/ml), according to the manufacturer’s protocol. After 12 h, changed the transfection media with fresh media, then applied 4 μg/ml puromycin (Merck) at 72 h post-transfection to select for 3 days and 2 μg/ml puromycin afterward to maintain stable-transfected cells.
RNA interference
The siRNAs for JAK1 (5′-GAAGGCAGAAAUUCCAUGAUGTT-3′, 5′-CAUCAUGGAA UUUCUGCCUUCTT-3′), JAK2 (5′-UGUCAAAAUAUGAUAGUCUUGTT-3′, 5′-C AAGACUAUCAUAUUUUGACATT-3′), STAT1 (5′- CUGCAGACUCUCCGCAACUAUTT-3′, 5′-AUAGUUGCGGAGAGUCUGCAGTT-3′), STAT3(5′-GCUUUCACUGAAUCUUAGCAGTT −3′, 5′-CUGCUAAGAUUCAGUGAAAGCTT-3′) and negative control (5′-UUCUCCGAACGUGUCACGUTT-3′, 5′-ACGUGACACGUUCGGAGAATT-3′) were synthesized by GenePharm (Shanghai, China).
MDA-MB-231 Cells were seeded in six-well plates and cocultured with M1 macrophage on the upper layer of the transwells for 48 h. Next, removed the transwells with macrophages on it and transfected the cancer cells with 20 pmol indicated siRNA together with 1ul of Lipofectamine 2000 transfection reagent (Invitrogen) for 6 h then changed the transfection media with fresh media according to the manufacturer’s protocol.
Statistics
Data analysis was performed at least three times and was presented as means ± SEM and illustrated by Graph Pad Prism 5.0 (Graph Pad Software). The difference among groups was determined by one-way ANOVA or two-tailed Student’s T-test in SPSS. The relationship between PD-L1 expression and clinicopathologic characteristics was analyzed and tested by a two-tailed Chi-square test or Fisher’s exact test in SPSS. P < .05 was considered statistically significant.
Ethics approval and Informed consent
All procedures performed in this study involving the collection of human breast cancer history records and specimens were in accordance with the ethical standards and approved by the Human Ethics Committee of the First Affiliated Hospital of Xi’an Jiaotong University, Shaanxi, China. All the animal experiments were performed in accordance with the ethical principles of the Animal Care and Use Committee guidelines of Xi’an Jiaotong University, Shaanxi, China.
Results
PD-L1 expression is higher in invasive breast cancer especially in TNBC
Firstly, we compared the PD-L1 mRNA expression and DNA copy number between invasive breast cancer and normal breast tissue in TCGA breast dataset on the Oncomine database platform (Search item: CD274; Analysis Type: Breast Cancer vs. Normal Analysis). Results showed that the PD-L1 mRNA expression in invasive ductal and lobular breast cancer tissues was significantly higher than that in normal breast tissue ((A-a)). However, there was no significant difference in the PD-L1 copy number among those groups ((A-b)). The results suggested that PD-L1 expression of breast cancer may be regulated largely at the transcription level by cancer extrinsic circumstances.
Figure 1. PD-L1 expression profile of breast cancer on oncomine platform and of breast epithelial and cancer cell lines
Then we compared PD-L1 expression between TNBC and other breast cancer subtypes on the Oncomine database platform (Search item: CD274; Cancer Type: Breast Cancer; Grouped by triple-negative status), in four datasets which had the largest sample sizes (Curtis Breast, sample size (N) = 1975; TCGA Breast, N = 349; Kao Breast, N = 327 and Bittner Breast, N = 222). The outcomes demonstrated higher CD274 expression at mRNA levels of TNBC in all the four datasets (P value is 0.09 in Bittner Breast, and are all <0.01 in other groups) ((B- a–d)).
Since the data from the online datasets could not accurately distinguish tumor tissue from stroma tissue, we further detected PD-L1 expression of breast cancer cell lines and normal mammary epithelial cell model MCF-10A by western blot. The result showed the most intensive PD-L1 expression in TNBC cell line MDA-MB-231, much less expression in mammary epithelial cell MCF-10A, only trace expression in Her2 enriched cell line ZR-75-30, and no detectable expression in other breast cancer cell lines including the other two TNBC cell lines MDA-MB-468 and HCC1806 ().
PD-L1 expression in TNBC is associated with patient metabolic complications
Overweight/obesity and MetS were identified to be associated with immune or inflammation maladjustment as well as the poor prognosis of TNBC in previous studies. Here, we supposed there might be a correlation between overweight/obesity or MetS and PD-L1 expression in TNBC patients.
We collected 60 TNBC patients’ history records and the corresponding cancer tissue specimen. Patients were selected equally from three BMI groups: normal weight (18.5≤ BMI<24), overweight (24≤ BMI<28), and obesity (28≤ BMI). PD-L1 expression in cancer tissue paraffin sections was assessed by immunohistochemistry and was assorted into three grades (grade 0 for negative expression, grade 1 for positive expression tumor cells under 20%, and grade 2 for positive expression more than 20%). A total of 57 patients were included in the study as 3 patients were excluded for incomplete medical history records or tissue destruction during immunohistochemistry process.
Patients’ clinical characteristics baseline including age, menstrual status, tumor size and lymph node invasion, and whether the patients were affected by a specific metabolic complication (hypertension, hyperglycemia, or dyslipidemia) or not, were collected and compared among BMI groups. The data showed that all of the clinical characteristics distributed equally among the three BMI groups except for metabolic complications ().
Table 1. Clinical characteristics distribution in BMI groups
Then, we analyzed the correlations of PD-L1 expression with patients’ BMI and overweight-related metabolic complications. Statistical analysis showed that PD-L1 expression level positively correlated with metabolic complications (R = 0.357, P = .004) but not significantly correlated with BMI (R = 0.249, P = .055) or other clinical cancer features (). This suggested that PD-L1 expression in TNBC was regulated mainly by metabolic microenvironment disorders instead of obesity or overweight.
Table 2. Spearman correlation between clinical variables and PD-L1 expression in TNBC patients
Obesity/MetS associated macrophage in the cancer microenvironment correlates with PD-L1 expression in breast cancer
In the immunohistochemistry staining of PD-L1 in TNBC specimen, PD-L1 positive cells were found not evenly distributed in the cancer tissues but were intensive at the edge of the cancer tissue, where the cancer cells interacted closely with the paracancerous microenvironment. This suggested that PD-L1 expression in TNBC may be highly affected by the cancer microenvironment ((A-a–d)).
Figure 2. IHC staining of PD-L1 in TNBC specimen, and the relationship of PD-L1 expression with macrophage-derived cytokine corresponding receptors and with obesity/MS promoting genes in TCGA breast dataset
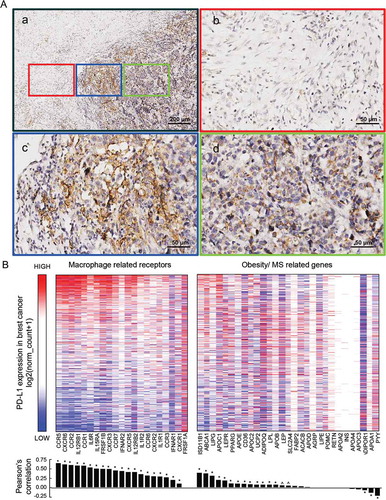
Obesity/overweight and related MetS were commonly considered promoting macrophage to polarize to M1 phenotype that secreted cytokines distinct from other macrophage phenotypes. We explored the correlation between PD-L1 expression and M1 secreted cytokines as well as obesity/overweight promoting genes in TCGA breast cancer dataset on the UCSC Xena Platform. M1 secreted cytokines, and their corresponding receptors are depicted in Supplementary Figure 1. Obesity/MetS promoting genes are depicted in Supplementary Table 3.
The heatmap and correlation coefficient analyses showed that PD-L1 expression in cancer cells had a co-expression tendency with the expression of M1 related cytokines receptors. By contrast, a much weaker correlation was found between PD-L1 expression and obesity/MetS promoting genes (). These results further indicated that M1 macrophage-related inflammation in the cancer microenvironment might play important roles in promoting PD-L1 expression in breast cancer. Meanwhile, tumor expression of M1 related cytokines corresponding receptors may also determine the effectiveness of its response to M1 microenvironment.
M1 macrophage could increase PD-L1 expression in MDA-MB-231, while telmisartan could restrains this process by inhibiting M1’s IL-6 secretion
To investigate that if obesity/MetS related macrophage could promote PD-L1 expression in breast cancer, we established in vitro coculture systems comprising breast cancer or epithelial cells and macrophages. The breast cells applied in the study were TNBC cell line MDA-MB-231, ER-positive cell line MCF-7, and non-tumorigenic epithelial cell MCF-10A. Macrophages applied in the coculture system were derived from various resources: THP-1 derived M0, M1, telmisartan (10 μM, 24 h) pretreated M1 (Tel-M1), and Wistar rat models derived normal weight rat macrophage (NWM), obese rat macrophage (ORM) and telmisartan (10 μM, 24 h) pretreated ORM (Tel-ORM).
After 48 h coculture with macrophages at different conditions, PD-L1 expression in breast cancer and epithelial cell lines were detected by both western blot at the protein level and by qPCR at the mRNA level.
PD-L1 expression was found to increase notably in all the three cell lines after the coculture with M1 and largely descend back after the coculture with telmisartan pretreated M1 at both protein and mRNA levels. PD-L1 mRNA expression in MDA-MB-231 increased about 3 folds, which was more prominent than that in MCF-7 and MCF-10A. PD-L1 expression was also found to increase in all three cell lines after the coculture with ORM and restore in coculture with Tel-ORM. The increase extent in rat models derived M1 coculture systems was relatively smaller than that in THP-1 derived M1 coculture systems ((A-a–c)).
Figure 3. Effects of macrophages and telmisartan exert on PD-L1 expression in breast epithelial and cancer cell lines
To investigate how obesity/MetS related macrophage and telmisartan affect PD-L1 expression in TNBC cells, we further measured the concentration of proinflammatory factor IL6 and TNF-α in THP-1 derived macrophages by ELISA and in rat-derived macrophages by qPCR. Results showed that IL6 and TNF-α expression in M1 and ORM were higher than that in M0 and NWM, and descend back after the treatment with telmisartan ((B-a–d)). Interestingly, the cytokines expression level changed in macrophages correlated with PD-L1 expression of cell lines in the coculture systems.
To further study whether IL6, TNF-α, or telmisartan directly played a role in this process, we treated the three cell lines with recombinant human IL-6 or TNF-α protein as well as telmisartan. After 24 h’ treatment, PD-L1 expression level was evaluated.
After IL6 treatment, PD-L1 expression was found to be elevated at both mRNA and protein levels in MDA-MB-231 cell, and the increase at the mRNA level was more significant than that at the protein level. After TNF-α treatment, PD-L1 expression in MDA-MB-231 showed a slight increase at the protein level ((C-a)). Nonetheless, PD-L1 expression at both mRNA and protein levels in MCF-7 and MCF-10A were not affected by IL6 and TNF-α ((C-b,c)). This indicated that M1 and ORM might promote PD-L1 expression through other mechanisms except IL6 and TNF-α in these two cell lines. In addition, telmisartan was found to have no direct impact on PD-L1 expression in all the three cell lines.
To further validate the role of macrophage-derived IL6 in promoting PD-L1 expression, we established stable IL6-shRNA-transfected IL6 knockdown M1 cell and then cocultured it with MDA-MB-231. Meanwhile, we added Tocilizumab (100 ng/ml, Sigma), a humanized IL6 competitive inhibitor that binds to the IL6 receptor, into the MDA-MB-231 and M1 coculture system for comparison. Results showed that PD-L1 expression decreased partially back when IL6 production was reduced by IL6 knocking down or IL6 was inhibited in M1 (). These results indicated that IL6 was an important mediator between M1 and MDA-MB-231 PD-L1 expression. Furthermore, we found that PD-L1 expression in MDA-MB-231 was affected by IL6 in concentration and time depended manners ((E-a,b)).
In conclusion, the results showed that obesity/MetS associated M1 macrophage could promote PD-L1 expression in TNBC cell line MDA-MB-231 by IL6, while telmisartan could reverse the PD-L1 expression increase by reducing IL6 secretion from M1 rather than directly acting on the cancer cells. M1 could also promote PD-L1 expression in ER-positive cell line MCF-7 and epithelial cell MCF-10A but may not through IL6.
M1 macrophage-derived IL-6 promotes PD-L1 expression through JAK1/STAT1 pathway
We further investigated the pathway underlying M1 secreted IL6 promoting PD-L1 expression. We mined the potential connected nodes between IL6 receptor IL6R and PD-L1 (search item: CD274) on STRING platform and illustrated the PPI (protein–protein interaction) network by CYTOSCAPE. In the network, Beside IL6, six more nodes directly connected with PD-L1 (STAT3, STAT1, EGFR, PTPN11, IL10RA, and IL17A) ()).
Figure 4. JAK-STAT pathway is involved in MDA-MB-231 PD-L1 expression influenced by M1 and telmisartan
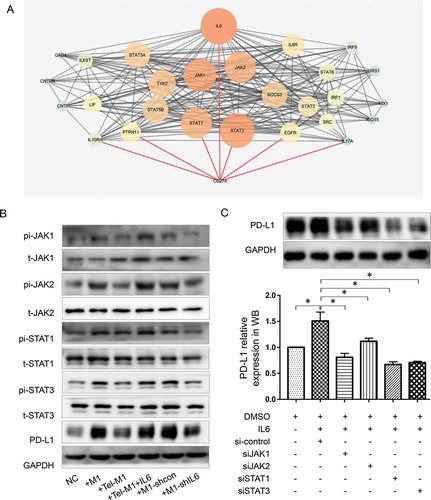
EGFR and IL10RA are both cytokine receptors which may affect PD-L1 expression in some way but are not common downstream pathways of IL6 and IL6R/IL6ST. PTPN11 is a tyrosine phosphatase which commonly works contrarily to IL6 mediated phosphorylation process. IL17A is a proinflammatory cytokine and is generally produced by activated T cells. Therefore, we chose two transcription factors STAT1 and STAT3 as well as their upstream kinase JAK1/JAK2, which also had the most intensive interactions with other nodes in the network, as the pathway to be studied.
We analyzed the expression of IL6-JAK1/JAK2-STAT1/STAT3 as well as their phosphorylation by western blot assay in MDA-MB-231 in the coculture systems with M1 of different conditions.
Western blot results showed an elevated level of JAK1/JAK2 and STAT1/STAT3 phosphorylation along with the elevated PD-L1 expression in MDA-MB-231 after coculture with M1. However, these changes were restored after the coculture with telmisartan pretreated M1. In reverse, IL6 could overcome the effects of telmisartan ()). The results indicated that PD-L1 expression change in MDA-MB-231 in different co-culture systems were related with JAK1/JAK2 and STAT1/STAT3 pathway.
To determine which JAK/STAT isoform works in this process, we interfered JAK1, JAK2, STAT1, and STAT3 expression by four correspondent siRNAs (Supplementary Figure 2) in IL6 pretreated MDA-MB-231 cells. PD-L1 were then detected by western blot. Results showed that either JAK1/JAK2 or STAT1/STAT3 interference could reverse the effect of IL6 in promoting PD-L1 expression and decrease PD-L1 expression to an even lower level than it was in blank control MDA-MB-231 cells. Compared with JAK1 and JAK2, STAT1 and STAT3 interference had a stronger inhibitory effect on PD-L1 expression. In addition, JAK1 seemed to have a greater impact on PD-L1 expression than JAK2 ()).
Telmisartan reduces IL6 secretion by activating PPAR-γ and inhibiting NF-κB in M1 macrophage
We further explored the mechanism of telmisartan in reducing IL6 secretion in M1. Telmisartan has been previously proved to selectively regulate peroxisome proliferator-activated receptor gamma (PPARG), which play important roles in the progress of insulin resistance, type 2 diabetes mellitus, and hypertension, and is also a key regulator in macrophage polarization.Citation17–19 We searched for potential pathway nodes between PPARG and IL6 in STRING platform and illustrated them by CYTOSCAPE ()). NFKB was found to have a high combined score with other nodes in the network. In addition, p65 (Rel A), one of NFKB subunits, had been previously reported to promote proinflammatory cytokines expression and regulate polarization of macrophage.Citation33 Therefore, we selected NFKB p65 to be studied.
Figure 5. Telmisartan downregulates IL6 expression in M1 by activation of PPARG and inhibition of NFKB-p65
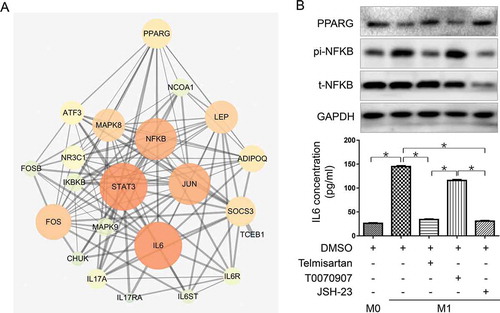
IL6, PPARG, and NFKB p65 expression were detected by ELISA or western blot in M0, M1 alone or M1 pretreated with telmisartan, selective PPARG inhibitor T0070907 (20 μM, 48 h) or NFKB transcription inhibitor JSH-23 (20 μM, 24 h) respectively.
As shown in ), PPARG expression is down-regulated in M1 compared to M0 macrophage, and telmisartan treatment could restore it. On the contrary, NFKB p65 phosphorylation is activated in M1 and suppressed by telmisartan. In addition, PPARG inhibition by T0070907 could directly induce NFKB p65 phosphorylation. IL6 concentration in the macrophage culture media changed consistently with NFKB p65 activity changes affected by M1 polarization, telmisartan, T0070907, or directly by NFKB transcription inhibitor JSH-23 ()). The results suggested PPARG and NFKB p65 to be the mediators between telmisartan and IL6 expression in M1 macrophage.
Discussion
The tumor cell closely interacts with its microenvironment, so its biological characteristics are inevitably regulated by the dynamic changes of the systemic metabolic status. Inflammation responses and immune regulation in obesity/MetS patients were usually impairedCitation34 and this may play significant roles in mediating obesity/MetS related increase of the incidence and mortality in various kinds of tumors.Citation35 In this study, we found that the expression of PD-L1, which was closely associated with tumor immune surveillance and prognosis, was also regulated by obesity/MetS related microenvironment.
In the bioinformatic analysis, we confirmed that the expression of PD-L1 in TNBC was higher than in other subtypes of breast cancer, which coincides with the previous studies.Citation9 However, in the western blot detection, we found that among the three TNBC cell lines, only MDA-MB-231 cells were PD-L1 positive. This may be due to the fact that only a portion (20%-58.6%) of TNBC is pathologically PD-L1 positive.Citation9 In addition, our study suggested that the PD-L1 expression of breast cancer cells was regulated by the internal microenvironment at the transcription level, so the PD-L1 expression in cell lines might be different from that in vivo tumor. This reminds us to pay attention to the in vivo study of PD-L1 regulatory mechanisms in the future.
Further analysis of IHC staining of PD-L1 in TNBC patients’ specimen revealed that PD-L1 expression was positively related to metabolic complications in patients rather than obesity itself. The prevalence of obesity and MetS is not always paralleled, because obesity is commonly defined by BMI and waist circumferenceCitation36,Citation37 while MetS is defined by metabolic status such as blood level of glucose, lipid and blood pressure.Citation25,Citation38 There is an obese population who have high level of insulin sensitivity but not have MetS features, while there is a MetS populations who have normal BMI.Citation39 This suggests that obesity and metabolic disorder should and could be distinguished in related studies. Besides, studies with larger sample size is needed to remove the impacts of the confounding factors such as smoking or drugs application for hypertension, diabetes mellitus or dyslipidemia in the relationship between PD-L1 expression and metabolic complications.
As PD-L1 is expressed on both tumor and stromal cells in some cancer specimen,Citation40 online mined informatics analysis results may be interfered by the PD-L1 expression on stromal cells. Here we have studied the effects of obesity/MetS related M1 macrophage exerted on the PD-L1 expression in vitro breast cancer cell lines but whether PD-L1 expression on the stroma cell was affected needs further study.
In patients with obesity or MetS, macrophages usually polarized toward M1, which is a classically activated phenotype and secretes proinflammatory cytokines such as IL-1β, IL-6, and TNF-αCitation41 In this study, we found that M1 could promote the expression of PD-L1 in breast cancer cells as well as in normal mammary epithelial cell. Tumor-associated macrophage (TAM) is another subset of macrophage which has drawn plenty of attention for that it could promote tumor cell proliferation, angiogenesis invasion,Citation14 and could inhibit tumor immune response by directly expressing PD-1.Citation42 TAM was recognized to be educated by tumor cells and was similar to M2, an alternatively activated phenotype of macrophages, secreting anti-inflammatory cytokines such as IL-10 and TGF-β. M1 and M2 are two main distinct polarization directions of original macrophage and have different biological characteristics and immune regulation functions, and the polarization balance is regulated by systematic microenvironment and drug interventions. Both M1 and M2 are tumor progression promoting in some aspects, therefore, macrophage activated phenotypes should be taken into account when studying their interactions with tumor cells.
Our study found that THP-1 derived M1 macrophages could promote the expression of PD-L1 in TNBC cell line MDA-MB-231, more strongly than that in ER-positive cell line MCF-7 and non-tumorigenic epithelial cell MCF-10A. This suggested that TNBC cells may be more sensitive in responding to M1. This may partly explain why PD-L1 expression is higher in TNBC subtype.
In our study, TNBC PD-L1 expression was promoted by M1 through the JAK/STAT pathway by secreting IL6. A previous study had also found that marrow stromal cells could induce PD-L1 expression in multiple myeloma by producing IL6, though the underlying mechanism was not studied.Citation43 However, our results revealed that IL6 only accounted partly for the PD-L1 expression promotion in TNBC MDA-MB-231 cells in coculture with M1, but could not accounted for the PD-L1 elevation in normal breast epithelial cell line MCF-10A and hormone receptor-positive breast cancer cell line MCF-7. Besides, the PD-L1 expression promotion in MDA-MB-231 could not be completely reversed by IL6 knockdown or inhibition; therefore, there must be other mechanisms involved in PD-L1 promotion in breast cancer.
TNBC was previously found to autocrine IL6,Citation44 and here the knockdown of JAK/STAT could decrease PD-L1 expression to an even lower level than it was in the blank control cells. This suggests that TNBC cells autocrine IL6 may also act directly on themselves, thereby stimulate PD-L1 expression through the JAK/STAT pathway.
Previous studies had found that macrophages stimulated by LPS may inhibit the ubiquitination degradation of PD-L1 by secreting TNF-αCitation45 This complies with our finding that PD-L1 expression increases more significantly at the protein level rather than at the mRNA level. Meanwhile, except for IL-6 and TNF-α, M1 cells can secrete some immune-related chemokines. Gene expression correlation analysis in ) suggested positive correlations between PD-L1 expression in breast cancer and chemokines’ receptors, such as CCR5, CXCR6, and CCR2. CCR2 expressed in breast cancer had already been found to suppress cytotoxic T cells through promoting PD-L1 expression in cancer cellsCitation46 but the mechanism was not clarified. Further exploration is needed to clarify the comprehensive interactions between M1 macrophage and PD-L1 expression in tumor cells.
In addition, THP-1 cell line-derived macrophage in vitro does not have the identical biological characteristics as the macrophage in the cancer microenvironment in vivo. Here we studied the effects that obesity/MetS related M1 macrophage exert on breast cancer cell lines, and the findings should be examined in vivo.
IHC results suggested that PD-L1 was expressed more intensively in the tumor edge than in the interior. Except the macrophages, there are many other interacting cells in the microenvironment, which may also affect the expression of PD-L1. For example, PD-L1 expression could be promoted by tumor-infiltrating lymphocytes secreting IFN-γ through the JAK/STAT1 pathway.Citation47 Interestingly, NK cells produced IFN-γ is increased in obesity and could trigger the macrophage polarization to proinflammatory status.Citation48 This indicates that proinflammatory macrophages in the microenvironment may promote PD-L1 expression in TNBC breast cancer in various ways.
Telmisartan, one of angiotensin receptor blockers (ARBs) which are commonly used in the management of hypertension, is a selective activator of PPAR-γCitation17 and could reverse the polarization of macrophages into M1 caused by obesity in rats.Citation18 In this study, we found that telmisartan could inhibit the secretion of IL6 and TNF-α by activating PPAR-γ and inhibiting NFKB p65 in THP-1 derived M1 while having no impact on the proliferation of breast cancer cells or normal breast epithelial cells (Supplementary Figure 3). In the present study, M1 secreted IL6 was found to promote PD-L1 expression in breast cancer, it also enhanced the proliferation of breast cancer cells in the previous studies. Therefore, telmisartan may have potential pharmacological inhibition effects on both proliferation and immune escape of breast cancer in obesity/MetS patients.
In summary, our study shows that PD-L1 expression is higher especially at mRNA level in breast cancer than in normal breast tissue, and is higher in TNBC than in other subtypes. What is more, PD-L1 expression is positively correlated with the metabolic complications in TNBC patients. Obesity/MetS related M1 macrophage could promote PD-L1 expression in TNBC partly by secreting IL6 through a JAK/STAT dependent pathway while telmisartan could reverse the PD-L1 promotion by activating PPARG and inhibiting NFKB p65 and thereby downregulating IL6 secretion in M1 macrophage. Our results highlight the relationship between PD-L1 expression in TNBC and obesity/MetS, and suggest a potential use of telmisartan in assisting immunotherapies in TNBC.
Disclosure of potential conflicts of interest
No potential conflicts of interest were disclosed.
Supplemental Material
Download MS Word (486.5 KB)Supplementary material
Supplemental data for this article can be accessed on the publisher’s website.
Additional information
Funding
References
- Vesely MD, Kershaw MH, Schreiber RD, Smyth MJ. 2011. Natural innate and adaptive immunity to cancer. Annu Rev Immunol. 29:235–271. doi:10.1146/annurev-immunol-031210-101324.
- Dong H, Strome SE, Salomao DR, Tamura H, Hirano F, Flies DB, Roche PC, Lu J, Zhu G, Tamada K, et al. Tumor-associated B7-H1 promotes T-cell apoptosis: a potential mechanism of immune evasion. Nat Med. 2002;8(8):793–800. doi:10.1038/nm730.
- Ansell SM, Lesokhin AM, Borrello I, Halwani A, Scott EC, Gutierrez M, Schuster SJ, Millenson MM, Cattry D, Freeman GJ, et al. PD-1 blockade with nivolumab in relapsed or refractory hodgkin’s lymphoma. N Eng J Med. 2015;372(4):311–319. doi:10.1056/NEJMoa1411087.
- Ribas A, Hamid O, Daud A, Hodi FS, Wolchok JD, Kefford R, Joshua AM, Patnaik A, Hwu W-J, Weber JS, et al. Association of pembrolizumab with tumor response and survival among patients with advanced melanoma. Jama. 2016;315(15):1600–1609. doi:10.1001/jama.2016.4059.
- Reck M, Rodriguez-Abreu D, Robinson AG, Hui R, Csoszi T, Fulop A, Gottfried M, Peled N, Tafreshi A, Cuffe S, et al. Pembrolizumab versus chemotherapy for PD-L1-positive non-small-cell lung cancer. N Eng J Med. 2016;375(19):1823–1833. doi:10.1056/NEJMoa1606774.
- Sharma P, Hu-Lieskovan S, Wargo JA, Ribas A. 2017. Primary, adaptive, and acquired resistance to cancer immunotherapy. Cell. 168(4):707–723. doi10.1016/j.cell.2017.01.017.
- Lehmann BD, Bauer JA, Chen X, Sanders ME, Chakravarthy AB, Shyr Y, Pietenpol JA. 2011. Identification of human triple-negative breast cancer subtypes and preclinical models for selection of targeted therapies. J Clin Invest. 121(7):2750–2767. doi10.1172/jci45014.
- Foulkes WD, Smith IE, Reis-Filho JS. 2010. Triple-negative breast cancer. N Eng J Med. 363(20):1938–1948. doi10.1056/NEJMra1001389.
- Mittendorf EA, Philips AV, Meric-Bernstam F, Qiao N, Wu Y, Harrington S, Su X, Wang Y, Gonzalez-Angulo AM, Akcakanat A, et al. PD-L1 expression in triple-negative breast cancer. Cancer Immunol Res. 2014;2(4):361–370. doi:10.1158/2326-6066.CIR-13-0127.
- Misra A, Khurana L. 2008. Obesity and the metabolic syndrome in developing countries. J Clin Endocrinol Metab. 93(11_supplement_1):s9–s30. doi10.1210/jc.2008-1595.
- Malik VS, Willett WC, Hu FB. 2013. Global obesity: trends, risk factors and policy implications. Nat Rev Endocrinol. 9(1):13–27. doi10.1038/nrendo.2012.199.
- Jiralerspong S, Goodwin PJ. 2016. Obesity and breast cancer prognosis: evidence, challenges, and opportunities. J Clin Oncol. 34(35):4203–4216. doi10.1200/jco.2016.68.4480.
- Widschwendter P, Friedl TW, Schwentner L, DeGregorio N, Jaeger B, Schramm A, Bekes I, Deniz M, Lato K, Weissenbacher T, et al. 2015. The influence of obesity on survival in early, high-risk breast cancer: results from the randomized SUCCESS A trial. Breast Cancer Res. 17:129. doi:10.1186/s13058-015-0639-3.
- Noy R, Pollard JW. 2014. Tumor-associated macrophages: from mechanisms to therapy. Immunity. 41(1):49–61. doi10.1016/j.immuni.2014.06.010..
- Castoldi A, de Souza CN, Camara NOS, Moraes-Vieira PM. 2016. The macrophage switch in obesity development. Front Immunol. 6. doi:10.3389/fimmu.2015.00637.
- Bhargava P, Lee CH. 2012. Role and function of macrophages in the metabolic syndrome. Biochem J. 442:253–262. doi:10.1042/bj20111708.
- Benson SC, Pershadsingh HA, Ho CI, Chittiboyina A, Desai P, Pravenec M, Qi NN, Wang JM, Avery MA, Kurtz TW. 2004. Identification of telmisartan as a unique angiotensin II receptor antagonist with selective PPAR gamma-modulating activity. Hypertension. 43(5):993–1002. doi10.1161/01.hyp.0000123072.34629.57.
- Fujisaka S, Usui I, Kanatani Y, Ikutani M, Takasaki I, Tsuneyama K, Tabuchi Y, Bukhari A, Yamazaki Y, Suzuki H, et al. Telmisartan improves insulin resistance and modulates adipose tissue macrophage polarization in high-fat-fed mice. Endocrinology. 2011;152(5):1789–1799. doi:10.1210/en.2010-1312.
- Takagi H, Mizuno Y, Yamamoto H, Goto SN, Umemoto T. 2013. Effects of telmisartan therapy on interleukin-6 and tumor necrosis factor-alpha levels: a meta-analysis of randomized controlled trials. Hypertens Res. 36(4):368–373. doi10.1038/hr.2012.196.
- Luo D, Wan X, Liu J, Tong T. 2018. Optimally estimating the sample mean from the sample size, median, mid-range, and/or mid-quartile range. Stat Methods Med Res. 27(6):1785–1805. doi10.1177/0962280216669183.
- Goldman M, Craft B, Hastie M, Repečka K, Kamath A, McDade F, Rogers D, Brooks AN, Zhu J, Haussler D. The UCSC xena platform for public and private cancer genomics data visualization and interpretation. bioRxiv. 2019;326470. doi:10.1101/326470.
- Szklarczyk D, Gable AL, Lyon D, Junge A, Wyder S, Huerta-Cepas J, Simonovic M, Doncheva NT, Morris JH, Bork P, et al. STRING v11: protein-protein association networks with increased coverage, supporting functional discovery in genome-wide experimental datasets. Nucleic Acids Res. 2019;47(D1):D607–d613. doi:10.1093/nar/gky1131.
- Shannon P, Markiel A, Ozier O, Baliga NS, Wang JT, Ramage D, Amin N, Schwikowski B, Ideker T. 2003. Cytoscape: a software environment for integrated models of biomolecular interaction networks. Genome Res. 13(11):2498–2504. doi10.1101/gr.1239303.
- Criteria of weight for adults. National healthy commission of the People’s Republic of China. Volume WS/T 428–2013; 2013.
- Grundy SM, Cleeman JI, Daniels SR, Donato KA, Eckel RH, Franklin BA, Gordon DJ, Krauss RM, Savage PJ, Smith SC Jr., et al. Diagnosis and management of the metabolic syndrome: an American heart association/national heart, lung, and blood institute scientific statement. Circulation. 2005;112(17):2735–2752. doi:10.1161/CIRCULATIONAHA.105.169404.
- Herbst RS, Soria JC, Kowanetz M, Fine GD, Hamid O, Gordon MS, Sosman JA, McDermott DF, Powderly JD, Gettinger SN, et al. Predictive correlates of response to the anti-PD-L1 antibody MPDL3280A in cancer patients. Nature. 2014;515(7528):563–567. doi:10.1038/nature14011.
- Savanur MA, Eligar SM, Pujari R, Chen C, Mahajan P, Borges A, Shastry P, Ingle A, Kalraiya RD, Swamy BM, et al. Sclerotium rolfsii lectin induces stronger inhibition of proliferation in human breast cancer cells than normal human mammary epithelial cells by induction of cell apoptosis. PLoS One. 2014;9(11):e110107. doi:10.1371/journal.pone.0110107.
- Qin Z. 2012. The use of THP-1 cells as a model for mimicking the function and regulation of monocytes and macrophages in the vasculature. Atherosclerosis. 221(1):2–11. doi10.1016/j.atherosclerosis.2011.09.003.
- Chanput W, Mes JJ, Wichers HJ. 2014. THP-1 cell line: an in vitro cell model for immune modulation approach. Int Immunopharmacol. 23(1):37–45. doi10.1016/j.intimp.2014.08.002.
- Peng ZY, Cong Z, Li X, Xue J, Wei Q. Comparison of the effects of different treatments on THP-1 cell differentiation. Chin J Comp Med. 2017;27(9):1–6.
- Li H, Li M, Liu P, Wang Y, Zhang H, Yang S, Song Y, Yin Y, Gao L, Cheng S, et al. Telmisartan ameliorates nephropathy in metabolic syndrome by reducing leptin release from perirenal adipose tissue. Hypertension. 2016;68(2):478–490. doi:10.1161/HYPERTENSIONAHA.116.07008.
- Hu C, Li J, Zhu Y, Sun H, Zhao H, Shao B, Li Y. 2011. Effects of aluminum exposure on the adherence, chemotaxis, and phagocytosis capacity of peritoneal macrophages in rats. Biol Trace Elem Res. 144(1–3):1032–1038. doi10.1007/s12011-011-9088-8.
- Chang CP, Su YC, Lee PH, Lei HY. 2013. Targeting NFKB by autophagy to polarize hepatoma-associated macrophage differentiation. Autophagy. 9(4):619–621. doi10.4161/auto.23546.
- Deng T, Lyon CJ, Bergin S, Caligiuri MA, Hsueh WA. 2016. Obesity, inflammation, and cancer. Annu Rev Pathol. 11:421–449. doi:10.1146/annurev-pathol-012615-044359.
- Lauby-Secretan B, Scoccianti C, Loomis D, Grosse Y, Bianchini F, Straif K. 2016. Int Agcy Res Canc H. Body fatness and cancer - viewpoint of the IARC working group. N Eng J Med. 375(8):794–798. doi10.1056/NEJMsr1606602.
- WHO (World Health Organization) Health topics: obesity. [ accessed 2019 Aug 30]. https://www.who.int/topics/obesity/en/.
- National Institutes of Health (NIH), Classification of Overweight and Obesity by BMI, Waist Circumference, and Associated Disease Risks. Bethesda (MD): National Heart, Lung and Blood Institute; [ accessed 2019 Aug 30]. https://www.nhlbi.nih.gov/health/educational/lose_wt/BMI/bmi_dis.htm.
- Eckel RH, Grundy SM, Zimmet PZ. 2005. The metabolic syndrome. Lancet. 365(9468):1415–1428. doi10.1016/s0140-6736(05)66378-7.
- Saklayen MG. 2018. The global epidemic of the metabolic syndrome. Curr Hypertens Rep. 20(2):12. doi10.1007/s11906-018-0812-z.
- Dill EA. PD-L1 expression and intratumoral heterogeneity across breast cancer subtypes and stages an assessment of 245 primary and 40 metastatic tumors. Am J Surg Pathol. 2017;41:334–342. doi:10.1097/PAS.0000000000000780.
- Shapouri-Moghaddam A, Mohammadian S, Vazini H, Taghadosi M, Esmaeili SA, Mardani F, Seifi B, Mohammadi A, Afshari JT, Sahebkar A. 2018. Macrophage plasticity, polarization, and function in health and disease. J Cell Physiol. 233(9):6425–6440. doi10.1002/jcp.26429.
- Gordon SR, Maute RL, Dulken BW, Hutter G, George BM, McCracken MN, Gupta R, Tsai JM, Sinha R, Corey D, et al. PD-1 expression by tumour-associated macrophages inhibits phagocytosis and tumour immunity. Nature. 2017;545(7655):495–499. doi:10.1038/nature22396.
- Tamura H, Ishibashi M, Yamashita T, Tanosaki S, Okuyama N, Kondo A, Hyodo H, Shinya E, Takahashi H, Dong H, et al. Marrow stromal cells induce B7-H1 expression on myeloma cells, generating aggressive characteristics in multiple myeloma. Leukemia. 2013;27(2):464–472. doi:10.1038/leu.2012.213.
- Hartman ZC, Poage GM, den Hollander P, Tsimelzon A, Hill J, Panupinthu N, Zhang Y, Mazumdar A, Hilsenbeck SG, Mills GB, et al. Growth of triple-negative breast cancer cells relies upon coordinate autocrine expression of the proinflammatory cytokines IL-6 and IL-8. Cancer Res. 2013;73(11):3470–3480. doi:10.1158/0008-5472.CAN-12-4524-T.
- Lim SO, Li CW, Xia W, Cha JH, Chan LC, Wu Y, Chang SS, Lin WC, Hsu JM, Hsu YH, et al. Deubiquitination and stabilization of PD-L1 by CSN5. Cancer Cell. 2016;30(6):925–939. doi:10.1016/j.ccell.2016.10.010.
- Fein MR, Almeida AS, Eberhardt A, Egeblad M. Cancer cell expression of CCR2 regulates the PD-L1/PD-1 immune checkpoint in breast cancer. Cancer Immunol Res. 2016;4(1). doi:10.1158/2326-6074.Cricimteatiaacr15-a063.
- Bellucci R, Martin A, Bommarito D, Wang K, Hansen SH, Freeman GJ, Ritz J. 2015. Interferon-gamma-induced activation of JAK1 and JAK2 suppresses tumor cell susceptibility to NK cells through upregulation of PD-L1 expression. Oncoimmunology. 4(6):e1008824. doi10.1080/2162402X.2015.1008824.
- Wensveen FM, Jelencic V, Valentic S, Sestan M, Wensveen TT, Theurich S, Glasner A, Mendrila D, Stimac D, Wunderlich FT, et al. NK cells link obesity-induced adipose stress to inflammation and insulin resistance. Nat Immunol. 2015;16(4):376–385. doi:10.1038/ni.3120.