
Abstract
Pyruvate kinase M2 (PKM2) acts at the crossroad of growth and metabolism pathways in cells. PKM2 regulation by growth factors can redirect glycolytic intermediates into key biosynthetic pathway. Here we show that IGF1 can regulate glycolysis rate, stimulate PKM2 Ser/Thr phosphorylation and decrease cellular pyruvate kinase activity. Upon IGF1 treatment we found an increase of the dimeric form of PKM2 and the enrichment of PKM2 in the nucleus. This effect was associated to a reduction of pyruvate kinase enzymatic activity and was reversed using metformin, which decreases Akt phosphorylation. IGF1 induced an increased nuclear localization of PKM2 and STAT3, which correlated with an increased HIF1α, HK2, and GLUT1 expression and glucose entrapment. Metformin inhibited HK2, GLUT1, HIF-1α expression and glucose consumption. These findings suggest a role of IGFIR/Akt axis in regulating glycolysis by Ser/Thr PKM2 phosphorylation in cancer cells.
Introduction
Altered glucose metabolism is one of the hallmarks of cancer metabolism. A significant increase of glucose intake and utilization to sustain cell growth and proliferation has been observed in several tumor cells.Citation1 Pyruvate kinase M2 isoform (PKM2) regulation can reprogram glycolysis influencing rate-limiting reactions and redirecting the biochemical flux of the pentose phosphate pathway (PPP) thus promoting the biosynthesis of cellular building blocks transcriptional pathways.Citation2 Pyruvate kinase M2 isoform (PKM2) is a glycolytic intermediate, which catalyzes the last step of glycolysis by the conversion of phosphoenolpyruvate (PEP) to pyruvate.Citation3 PK exists in 4 isoforms. PKM1 and PKM2 are the most important: PKM2, which is the only one to be allosterically regulated, is mainly expressed during embryogenesis and became replaced by PKM1 during development. On the contrary tumor cells reverse this balance and express more PKM2, a fact that suggests a crucial role of this protein in cancer.Citation4 By allosteric regulation PKM2 reprograms cell metabolism and participates to glycolysis or to transcriptional program switching from a tetrameric to a dimeric state.Citation5,6 The PKM2 tetramer acts as pyruvate kinase in the cytoplasm where it produces ATP and pyruvate. By contrast, the PKM2 dimer is mainly localized in the nucleus where it participates in the transcriptional cascade. Recently it has been shown that growth factor signaling shares the ability to negatively regulate PKM2 pyruvate kinase activity, which determines its partition into the cytosolic and nuclear subcellular compartments. Nuclear translocation of PKM2 is stimulated by heterogeneous post-translational mechanisms: phosphorylation, acetylation, oxidation, hydroxylation, sumoylation.Citation7 Growth factors determine PKM2 nuclear localization by phosphorylation at Tyr or Ser residues and not by a unique phosphorylating mechanism. PKM2 nuclear localization was first observed in EGF stimulated cells upon phosphorylation at Ser37. Translocation to the nucleus resulted in up-regulation of GLUT1 transcription.Citation8 FGFR inhibits the PKM2 isoform by direct phosphorylation of Tyr105.Citation9 PKM2 nuclear localization is crucial to determine a shift in glucose metabolism and the transcription of several genes implicated in glucose uptake.Citation10,11 One of the most important targets of PKM2 is hypoxia-inducible factor (HIF-1) α.Citation12 PKM2 serves in the nucleus as HIF-1α trans-activatorCitation10 and participates to induce HIF-1α transcription.Citation12 HIF-1α dimerizes with HIF-1β and binds to the hypoxia response element (HRE) of target genes such as GLUT1 and HK2. Thus PKM2 functions as a gate in the glycolytic flux.
In this scenario IGF1 stimulates Akt that in turn up-regulates GLUT1 and HK2 expression resulting in higher glucose uptake. Akt appears as a master regulator of IGF1 action controlling cell proliferation, cell survival, and cell metabolism.Citation13 Akt activation increases glucose uptake in cancer cells inducing HIF-1α, HK2 and GLUT1 expression Citation14 and stimulating HK2 catalytic function.Citation15 Akt inhibitors effectively block glucose uptake decreasing glucose utilization, and cell viability.Citation16 Also Metformin, an antidiabetic drug with anticancer properties has been shown to inhibit IGFIR signaling acting on the down stream effector Akt.Citation17 Although several studies have demonstrated a relationship between IGF1 stimulation and glucose uptake via Akt, downstream targets of this mechanism are yet to be identified. In particular, the role of IGFIR/Akt axis in the regulation of PKM2 is still unknown.
Here we demonstrate that IGF1 regulates glycolytic pathway decreasing PKM2 activity by Ser/Thr PKM2 phosphorylation. IGF1 treatment shifts the PKM2 dimer/tetramer equilibrium to the dimeric form. The increase of PKM2 nuclear localization is associated with the increase of GLUT1, HK2 and HIF-1 α expression and glucose uptake. We show that IGF1 regulates PKM2 function and glycolysis by an Akt dependent mechanism and that metformin counteract the effect of IGF1.
Results
To determine the effect of IGF1 on PKM2 phosphorylation, serum starved Calu-1 cells were treated with IGF1 (10 nM) for 0, 5, 15, 30 minutes and 2 hours (). IGF1 induced Ser/Thr PKM2 phosphorylation with a maximum at 5 minutes. The time course of Ser/Thr PKM2 phosphorylation was superimposable to IGFIR and Akt phosphorylation with a pick a 5 minutes, while Erk phosphorylation showed a maximum at 15 minutes ().
Figure 1. IGF1 induces PKM2 Ser/Thr phosphorylation. (A) Serum starved Calu-1 cells were stimulated with IGF1 10 nM for the indicated times and then lysed. Equal amount of cell lysates were immunoprecipitated (IP) and immunoblotted (IB) with the indicated antibodies. (B) Equal amount of cell lysates were separated on SDS-PAGE, transferred on nitrocellulose and blotted with an antibody direct against total PKM2, P(Tyr 980)IGFIR⇓, total IGFIR, P(Ser 473)-Akt, total Akt, P(Thr202/Tyr204)-ERK, total ERK proteins.
Then we investigated whether IGF1 could regulate PK activity and energy balance. We found that IGF1 treatment significantly decreased total PK activity at 20 minutes (). To determine whether IGF1 could drive glucose 6-phosphate into the pentose phosphate shunt we measured Glucose-6-phosphate dehydrogenase (G6PD) activity. Upon IGF1 stimulation G6PD activity increased in a time dependent manner in total cell lysates (). The significant decrease of AMP/ATP ratio showed that IGF1 also regulated the metabolic energy balance in Calu-1 cells (2C).
Figure 2. IGF1 decreases cellular pyruvate kinase activity and increases AMP/ATP ratio. (A and B) report the assay of pyruvate kinase (PK) and glucose 6 phosphate dehydrogenase activity (G6PD) respectively after several time-points of IGF1 incubation in the Calu-1 homogenate. Enzymatic activities are expressed as U/min/mg, and represent al least 5 experiments for each value. (C) AMP and ATP concentrations were determined by enzymatic assay and the AMP/ATP ratio was then calculated. The * indicates that the value is statistically different from that of the control (0 min) for P < 0.01.
Down regulation of PKM2 pyruvate kinase activity is associated with the dissociation of the PKM2 tetramer to the dimeric form. To test the hypothesis that IGF1 could promote PKM2 dissociation we separated tetrameric and dimeric forms by size-exclusion chromatography. Western Blot analysis showed that tetramer and dimer forms coexist in Calu-1 cells. We identified PKM2 in fraction 7 and 13 corresponding respectively to the tetrameric and dimeric forms (). Following IGF1 treatment total cell lysates were subjectd to size-exclusion chromatography. Western blot analysis of fraction 7 and 13 showed that IGF induced the enrichment of the PKM2 dimeric form by approximately 20% ().
Figure 3. IGF1 increases the formation of dimeric PKM2. Calu-1 cells were treated with IGF1 for 20 minutes and then subjected to size-exclusion chromatography. (A) Total cell lysates were separated by size-exclusion chromatography to identificate PKM2 tetrameric (fraction 7) and dimeric form (fraction 13). (B) Fractions 7 and 13 were separated on SDS-PAGE, transferred on nitrocellulose and blotted with an antibody direct against PKM2.
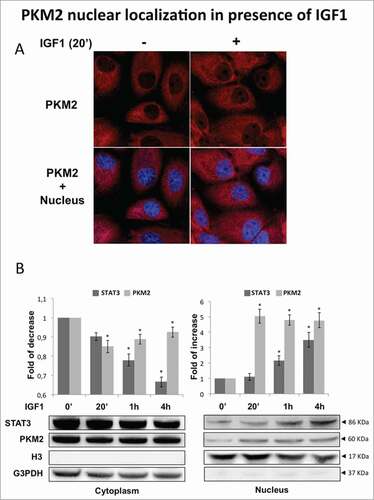
IGF1 determined a change in the sub-cellular distribution of PKM2 with a marked increase of nuclear staining detected by immunofluorescence (). Western blot of cytoplasmic and nuclear fractions showed that IGF1 promotes PKM2 but also STAT3 nuclear translocation (). The detection of PKM2 and STAT3 in the nuclear extracts was not due to contamination of cytoplasmatic proteins, as demonstrated by lack of GAPDH and the markedly positivity of the nuclear histone H3 in the immnunoblot analysis of the nuclear extracts.
Figure 4. PKM2 nuclear localization in presence of IGF1. (A) Cells were immunostained with anti PKM2 (PKM2 red). The nucleus is labeled with DAPI (blue). Merged images are shown (PKM2+ Nucleus). IGF1 induces the nuclear translocation of PKM2 in the nuclear compartment already after 20 minutes. (B) Calu-1 cells were treated with IGF1 for the indicated times. Nuclear and cytosolic lysates were prepared by cell fractionation and subjected to immunoblotting analysis using an anti human STAT3, PKM2, H3 and G3PDH primary antibodies. Densitometric analysis was performed using ImageJ software. The * indicates that the value is statistically different to that of control (0 min) for P < 0.01.
Treatment with PI3-kinase inhibitor LY294002, which blocked IGF1 induced Akt phosphorylation, abrogated IGF1 induced Ser/Thr PKM2 phosphorylation (). On the contrary treatment of Calu-1 cells with the Erk1/2 inhibitor U126, blocking IGF1 induced phosphorylation of Erk 1/2 did not show any effect on PKM2 phosphorylation (). These results were further supported by measurements of PK enzymatic activity in total cell lysates. IGF1 inhibited pyruvate kinase enzymatic activity in a time dependent manner (). U126 pre-treatment did not alter IGF1 effect on PK activity at 20 and 60 minutes. On the contrary LY294002 inhibitor abolished IGF1 action. These results indicates that Akt regulates PKM2 function driving IGF1 induced PKM2 Ser/Thr phosphorylation and decreasing cellular PK activity.
Figure 5. IGF1 regulates PKM2 function through Akt phosphorylation. (A) Calu-1 cells were treated by IGF1, IGF1 in presence of LY294002 or alternatively U126. Representative immunoprecipitation experiment showing PKM2 Ser/Thr phosphorylation. Total cell lysates were subjected to immunoblotting analysis using specific antibodies against phospho Akt, Akt, phospho ERK1/2 and ERK1/2. (B) Measure of PK activity in Calu-1 homogenate, incubated with IGF1, IGF1 + U126 or IGF1 + LY, respectively. The enzymatic activity is expressed as U/min/mg, and represent al least 5 experiments for each value. The * indicates that the value is statistically different to that of control (0 min) for P < 0.01.
The dimeric PKM2 nuclear localization drives the cancer cells metabolism driving to higher glycolysis rates. We measured the effect of IGF1 on mRNA levels encoding for HK2, the enzyme responsible of glucose retention. We found an increased protein expression of both HK2 and HIF1α and GLUT1 (). IGF1 effect on cancer metabolism was also evaluated by estimating the capability of Calu-1 cells to retain 18F-fluorodeoxyglycose (FDG). IGF1 treatment increased tracer uptake in a dose dependent manner up to 20% after 24 hours exposure to 10 nM IGF1 concentration (). All these finding indicate that IGF1 exposure increased FDG retention also modifying gene expression.
Figure 6. IGF1 increases FGD uptake in Calu-1 cells. Calu-1 cells were treated by IGF1 for 24 hours. (A) Western blot analysis of Calu-1 total cell lysates probed with specific antibodies for HK2, HIF1α and GLUT1 and β-Actin. (B) Cell uptake of FDG was expressed as percentage of total tracer availability according to different IGF1 concentrations. p values are shown for each comparison: * P < 0.05; ** P < 0.01.
We assessed whether metformin could interfere with the increased FDG uptake induced by IGF1. Metformin caused a significant reduction of FDG uptake induced by IGF1 approximately 25% (). Since Metformin inhibits IGF1 induced Akt phosphorylation in Calu1 cells we stimulated Calu-1 cells with IGF1 (10 nM), metformin (10 mM), or their combination for indicated time and measured PK activity. We found that Metformin treatment significantly counteracted the decrease of pyruvate kinase activity induced by IGF1 (). As expected, no effect was observed in the presence of metformin alone. Metformin treatment restored basal levels of the expression of HIF1α, HK2 and GLUT1 induced by IGF1 ().
Figure 7. Metformin counteracts the IGF1 effect on FGD uptake and pyruvate kinase activity. Calu-1 cells were treated with IGF1 (10 nM), Metformin (10 mM) o IGF1 (10 nM)/Metformin (10 mM) for the indicated times. (A) FDG uptake at 24h of treatment was expressed as percentage of total tracer availability. (B) Pyruvate kinase assay expressed as percentage of the pyruvate kinase activity value obtained at 0 min of each treatment. (C) Representative immunoblot of Calu-1 cell lysates showing IGF1 upregulation of HIF1α, HK2 and GLUT1 at 24 h and 48 h. (D–F) Densitometric analysis was performed using ImageJ software. p values are shown for each comparison: * P < 0.05.

Discussion
Here we examined the role of IGF-1 in the regulation of PKM2 phosphorylation and glucose entrapment. We hypothesized that IGF-I could modulate PKM2 phosphorylation and subcellular localization influencing cellular transcriptional mechanisms. Activation of growth factor receptors decreases pyruvate kinase activity and increases PKM2 nuclear translocation. Although counterintuitive, the lower pyruvate kinase activity of PKM2 is necessary for cell proliferation. This mechanism can redirect glucose flux and change the balance between energy generation and biosynthetic precursors thus favoring cancer cell growth. IGF1 increases the enzymatic activity of G6PD, the rate-limiting enzyme of the PPP that is upregulated in cancer.Citation18 PPP is regulated by several factors, including tumor suppressors, oncoproteins and intracellular metabolites Citation19 and has a dramatical impact on cancer growth and survival. The shift versus PPP allows carbohydrate metabolites to enter other subsidiary pathways responsible of the production of NADPH, which is a fundamental cofactor in fatty acid biosynthesis resulting advantageous for rapidly growing cells.Citation19,20 The mechanism explaining PKM2 change of function induced by growth factor seems to be induced by not unique post-translational modification. Our findings demonstrate that IGFIR activation induces PKM2 Ser/Thr phosphorylation, decreases pyruvate kinase activity and increases its nuclear localization. Interestingly ERK 1/2 activation can cause nuclear translocation of PKM2 inducing the phosphorylation of the residue Ser37.Citation21 The oncogenic Ser/Thr kinase PIM2 directly phosphorylates PKM2 at Thr-454 inhibiting the PK enzymatic activity and switching glycolysis vs. a biosynthetic pathway.Citation22 PKM2 Tyr 105 residue was also observed to be phosphorylated in several solid tumors and cell lines including Calu-1 and to provide a metabolic advantage to tumor cells.Citation23 Phosphorylation of Tyr 105 of PKM2 was already reported as a sensitive modification point acting as a negative modulator of PKM2 activity. Phosphorylation of Tyr 105 disrupts the formation of the active tetrameric PKM2 by releasing the cofactor fructose-1,6-bisphosphate (FBP) Citation23 and favoring nuclear translocation. At the same time, phosphorylation of Tyr 105 is capable of regulating subsequent phosphorylation of Ser Citation21 and Thr Citation24 residues and could further decrease PKM2 activity by favoring the closed conformation and interfering with the PEP or FBP binding.Citation25
IGF1 induces Ser/Thr PKM2 phosphorylation with a maximum at 5 minutes. The significant decreased of total PK activity at 20 minutes, suggests that other factors could play a role in this process. It is expected that further structural studies on PKM2 phosphorylation could reveal the details of the mechanism by which Ser and Thr residues can negatively regulate PKM2 activity.
We found that IGF1 induced PKM2 Ser/Thr phosphrylation by an Akt dependent mechanism. The hyperactivation of Akt is associated with the increase of glucose metabolism in tumor cells.Citation26 Akt regulates the localization of the glucose transporter GLUT1 to the plasma membrane and regulates hexokinase expression, activity, and mitochondrial interaction. Then Akt potentiates both glucose entrapment and glycolysis. IGF1 through Akt regulates PKM2 biological function inducing its phosphorylation. The inhibition of Akt phosphorylation by LY294002 decreases IGF1 effect. Akt-PKM2 axis influences HIF1α function enhancing HIF1α transactivation activity improving HIF1α binding to the hypoxia response elements.Citation10 Recent evidences have demonstrated that Insulin treatment promotes cancer cell progression regulating glycolysis, decreasing PKM2 activity and inducing HIF1α expression through PI3K/mTOR pathway.Citation27 Moreover insulin increases glucose consumption inducing HIF1α expression.Citation12 HIF-1 α is involved in IGF1 mediated transcription of genes encoding glucose transporters and glycolytic enzymes.Citation28 HIF-1 is involved in IGF1 signaling and is known to induce the transcription of genes encoding glucose transporters and glycolytic enzymes and thereby increases the capacity for anaerobic ATP synthesis.Citation28 Metformin treatment reverses IGF1 effects and counteracts HIF1α, HK2 and GLUT1 induced expression abolishing the increased FDG entrapment that occurred following IGF1 exposure. The reduced retention of FDG reflects the alteration of the expression pattern of GLUT1 and HK2, which regulates respectively glucose transport and phosphorylating mechanisms.
In conclusion here we demonstrate that IGF1 is able to drive the cellular energy derived from glucose to an anabolic pathway. The cross-road of this pathway is represented by PKM2 that under IGF1 stimulation increases its nuclear localization and switch from a tetramer to a dimer (). In the same conditions we were able to detect a change of energy balance. All together these results offer a biochemical explanation to understand the nuclear action of IGF1.
Figure 8. IGF1 meets metabolism regulating PKM2 Ser/Thr phosphorylation. IGF1 induced Akt phosphorylation and then Ser/Thr PKM2 phosphorylation in a sequential manner. The increase of PKM2 dimers and the decrease of pyruvate kinase activity are associated to PKM2 nuclear localization. This results in the up regulation of genes involved in glucose uptake such as HIF1 α, GLUT1, HK2. This transcriptional effect potentiate glucose uptake induced by IGF1.
Materials and Methods
Reagents
Metformin was provided by Sigma-Aldrich (St. Louis, MO, USA). FDG was produced according to standard methodology. Daily quality controls always documented adequate standards and, in particular, a radiochemical purity ≥98%.
Cell culture
Calu-1 cells were obtained from Interlab Cell Line Collection (ICLC) and cultured in low Glucose Dulbecco's modified Eagle's medium supplemented with 2 mM glutamine, 10% Fetal Bovine Serum (FBS), 100 U/ml penicillin, and 100 mg/ml streptomycin sulfate at 37°C in 5% CO2.
FDG uptake evaluation
Labeling was performed by incubating 1 × 10⁶ cultured cells with FDG, according to a modified procedure developed and validated in our laboratory.Citation29 On the day of the experiment, uptake medium was added with PBS and FDG so to obtain a tracer concentration of 1 μCi/mL in each well. Glucose-free medium was used for FDG uptake. Tracer exposure was maintained for 60 minutes at 37°C. Preliminary studies indicated that FDG uptake is linear over this period of time for all cell lines, and that there is no depletion of the radioactive substrates from the culture media. Cells then rinsed twice in cold PBS, and counted to determine cell associated fluorine-18 radioactivity, using a Packard Cobra II gamma counter (Packard, Meriden, CT). Washing did not induce significant efflux of FDG, as confirmed by preliminary studies comparing FDG uptake of cells washed for different periods of time in the presence or absence of the glucose transport inhibitors, cytochalasin B and phloretin. This indicates that after an incubation period of 60 minutes, almost all FDG was trapped in the cells as FDG6P. Radioactivity uptake values were normalized to the number of viable (trypan blue-negative) cells.
Western blotting analysis
Calu-1 cell extracts were resolved by SDS-PAGE and transferred to a nitrocellulose membrane as previously described.Citation17 Membranes were incubated overnight at 4°C and probed with the following antibodies: anti human PKM2 (D78A4), HK II (C64G5), phospho IGFIR (C14A11), phospho Akt (D9E), Akt, phospho ERK1/2, ERK purchased from Cell Signaling Technologies (Boston, MA), anti human GLUT1 purchased from Scbt (CA,USA), anti human HIF-1α purchased from BD (NJ, USA), anti human β-Actin purchased from Scbt (CA,USA). Calu-1 total cell lysates (50 μg) were immunoprecipitated using an anti phospho Ser/Thr purchased from AbCam (Cambridge, UK) and separated on SDS–PAGE and transferred to nitrocellulose. Primary antibodies were detected using a goat anti-mouse or goat anti-rabbit IgG HRP conjugated, and developed with ECL substrate (Thermo Fisher Scientific, IL, USA).
Immunofluorescence analysis
Calu-1 cells, cultured on glass coverslips, were incubated with DAPI probe (Life Technologies) and treated as previously described.Citation17 Coverslips were incubated O/N with rabbit anti-PKM2 (D78A4) primary antibody (Cell Signaling Technologies). Specific staining was visualized with a goat anti-Rabbit Alexa Fluor 568 secondary antibody (Molecular Probes, Eugene, OR, USA) washed and mounted using Prolong Gold antifade reagent (Life Technologies Ltd, Paisley,UK). The images were collected using a 3-channel TCS SP2 laser-scanning confocal microscope (Leica Microsystems, Wetzlar, Germany). Sequential acquisition was performed to avoid cross-talk between color signals. Spatial co-localization was analyzed by ImageJ 1.34f software (Wayne Rasband, National Institutes of Health, Bethesda, MD, USA).
Pyruvate kinase assay
Pyruvate kinase (PK) activity was assayed at room temperature in a double beam spectrophotometer (UNICAM UV2, Analytical S.n.c., Italy), following the oxidation of NADH, at 340 nm. For each assay, 20 µg of total protein were used. The reaction mixtures contained: 100 mM Tris HCl pH 8, 10 mM phosphoenolpyruvate (PEP), 0.2 mM NADH and 1 IU/ml of lactate dehydrogenase.Citation29
Glucose 6 phosphate dehydrogenase assay
Glucose 6 phosphate dehydrogenase (G6PD) was assayed spectrophotometrically (UNICAM UV2, Analytical S.n.c., Italy), following the reduction of NADP, at 340 nm. For each assay, 20 µg of total protein were used. The reaction mixtures contained: 100 mM Tris HCl pH 7.4, 50 mM Glucose 6 phosphate, 5 mM MgCl2, 0.91 mM NADP.Citation29
Statistical analysis
All experiments were performed >3 times. Statistical differences were assessed by Student's t test. Values of P < 0.05 were considered statistically significant.
Disclosure of Potential Conflicts of Interest
No potential conflicts of interest were disclosed.
Funding
This work was supported by MIUR (PRIN 2010JS3PMZ_009), the Italian Ministry of Health, Grant program 2008 (GMS), the Italian Association for Cancer Research (AIRC Start Up grant N. 6266). AA is recipient of a fellowship PO CRO Fondo Sociale Europeo Regione Liguria 2007–2013 Asse IV “Capitale Umano.”
Related Research Data
References
- Koppenol WH, Bounds PL, Dang CV. Otto Warburg's contributions to current concepts of cancer metabolism. Nat Rev Cancer 2011; 11:325–37; PMID:21508971; https://doi.org/10.1038/nrc3038
- Yang W, Lu Z. Nuclear PKM2 regulates the Warburg effect. Cell Cycle 2013; 12:3154–8; PMID:24013426
- Wu S, Le H. Dual roles of PKM2 in cancer metabolism. Acta Biochim Biophys Sinica 2013; 45:27–35; PMID:23212076
- Wong N, Ojo D, Yan J, Tang D. PKM2 contributes to cancer metabolism. Cancer Lett 2014;356:184–91; PMID:24508027; https://doi.org/10.1016/j.canlet.2014.01.031
- Alderton GK. Alternative splicing: dose-dependent splicing. Nat Rev Cancer 2012; 12:153–153
- Gupta V, Bamezai RNK. Human pyruvate kinase M2: A multifunctional protein. Protein Sci 2010; 19:2031–44; PMID:20857498
- Semenova G, Chernoff J. PKM2 enters the Morpheein academy. Mol Cell 2012; 45:583–4; PMID:22405271
- Wang LY, Liu YP, Chen LG, Chen YL, Tan L, Liu JJ, Jazag A, Ren JL, Guleng B. Pyruvate kinase M2 plays a dual role on regulation of the EGF/EGFR signaling via E-Cadherin-dependent manner in gastric cancer cells. PLoS ONE 2013; 8:e67542; PMID:23840737
- Dang CV. PKM2 tyrosine phosphorylation and glutamine metabolism signal a different view of the Warburg effect. Sci Signal 2009; 2:pe75; PMID:19920249
- Wang H-J, Hsieh Y-J, Cheng W-C, Lin C-P, Lin Y, Yang S-F, Chen C-C, Izumiya Y, Yu J-S, Kung H-J, et al. JMJD5 regulates PKM2 nuclear translocation and reprograms HIF-1α-mediated glucose metabolism. Proc Natl Acad Sci U S A 2014; 111:279–84; PMID:24344305; https://doi.org/10.1073/pnas.1311249111
- Luo W, Hu H, Chang R, Zhong J, Knabel M, O'Meally R, Cole RN, Pandey A, Semenza GL. Pyruvate kinase M2 is a PHD3-stimulated coactivator for hypoxia-inducible factor 1. Cell 2011; 145:732–44; PMID:21620138; https://doi.org/10.1016/j.cell.2011.03.054
- Li W, Wang J, Chen QD, Qian X, Li Q, Yin Y, Shi ZM, Wang L, Lin J, Liu LZ, et al. Insulin Promotes Glucose Consumption via Regulation of miR-99a/mTOR/PKM2 Pathway. PLoS ONE 2013; 8:e64924; PMID:23762265
- Manning BD, Cantley LC. AKT/PKB signaling: navigating downstream. Cell [Internet] 2007 [cited 2014 Dec 2]; 129:1261–74. Available from: http://www.pubmedcentral.nih.gov/articlerender.fcgi?artid=2756685&tool=pmcentrez&rendertype=abstract; PMID:17604717
- Semenza GL. Hypoxia-inducible factor 1 (HIF-1) pathway. Sci STKE [Internet] 2007 [cited 2014 Nov 6]; 2007:cm8. Available from: http://www.ncbi.nlm.nih.gov/pubmed/17925579
- Roberts DJ, Tan-Sah VP, Smith JM, Miyamoto S. Akt phosphorylates HK-II at Thr-473 and increases mitochondrial HK-II association to protect cardiomyocytes. J Biol Chem 2013; 288:23798–806; PMID:23836898; https://doi.org/10.1074/jbc.M113.482026
- Kosugi M, Ahmad R, Alam M, Uchida Y, Kufe D. MUC1-C oncoprotein regulates glycolysis and pyruvate kinase m2 activity in cancer cells. PLoS One 2011; 6:e28234; PMID:22140559; https://doi.org/10.1371/journal.pone.0028234
- Salani B, Maffioli S, Hamoudane M, Parodi A, Ravera S, Passalacqua M, Alama A, Nhiri M, Cordera R, Maggi D. Caveolin-1 is essential for metformin inhibitory effect on IGF1 action in non-small-cell lung cancer cells. FASEB J 2012; 26:788–98; PMID:22038047
- Tsouko E, Khan AS, White MA, Han JJ, Shi Y, Merchant FA, Sharpe MA, Xin L, Frigo DE. Regulation of the pentose phosphate pathway by an androgen receptor-mTOR-mediated mechanism and its role in prostate cancer cell growth. Oncogenesis 2014; 3:e103; PMID:24861463
- Jiang P, Du W, Wu M. Regulation of the pentose phosphate pathway in cancer. Protein Cell 2014; 5:592–602; PMID:25015087; https://doi.org/10.1007/s13238-014-0082-8
- Patra KC, Hay N. The pentose phosphate pathway and cancer. Trend Biochem Sci 2014; 39:347–54; PMID:25037503; https://doi.org/10.1016/j.tibs.2014.06.005
- Yang W, Zheng Y, Xia Y, Ji H, Chen X, Guo F, Lyssiotis CA, Aldape K, Cantley LC, Lu Z. ERK1/2-dependent phosphorylation and nuclear translocation of PKM2 promotes the Warburg effect. Nat Cell Biol [Internet] 2012; 14:1295–304. Available from: http://www.pubmedcentral.nih.gov/articlerender.fcgi?artid=3511602&tool=pmcentrez&rendertype=abstract
- Yu Z, Zhao X, Huang L, Zhang T, Yang F, Xie L, Song S, Miao P, Zhao L, Sun X, et al. Proviral insertion in murine lymphomas 2 (PIM2) oncogene phosphorylates pyruvate kinase M2 (PKM2) and promotes glycolysis in cancer cells. J Biol Chem 2013; 288:35406–16; PMID:24142698; https://doi.org/10.1074/jbc.M113.508226
- Hitosugi T, Kang S, Vander Heiden MG, Chung T-W, Elf S, Lythgoe K, Dong S, Lonial S, Wang X, Chen GZ, et al. Tyrosine phosphorylation inhibits PKM2 to promote the Warburg effect and tumor growth. Sci Signal 2009; 2:ra73; PMID:19920251
- Yu Z, Huang L, Zhang T, Yang F, Xie L, Liu J, Song S, Miao P, Zhao L, Zhao X, et al. PIM2 phosphorylates PKM2 and promotes Glycolysis in Cancer Cells. The Journal of biological chemistry [Internet] 2013; 288:35406–16. Available from: http://www.jbc.org/content/288/49/35406.short?rss=1&utm_source=feedburner&utm_medium=feed&utm_campaign=Feed:+JBC_Metabolism+(JBC_Metabolism)
- Kalaiarasan P, Subbarao N, Bamezai RN. Molecular simulation of Tyr105 phosphorylated pyruvate kinase M2 to understand its structure and dynamics. J Mol Model [Internet] 2014 [cited 2014 Oct 30]; 20:2447. Available from: http://www.ncbi.nlm.nih.gov/pubmed/25208557; PMID:25208557
- Robey RB, Hay N. Is Akt the “Warburg kinase”?-Akt-energy metabolism interactions and oncogenesis. Semin Cancer Biol 2009; 19:25–31; PMID:19130886
- Iqbal MA, Siddiqui FA, Gupta V, Chattopadhyay S, Gopinath P, Kumar B, Manvati S, Chaman N, Bamezai RNK. Insulin enhances metabolic capacities of cancer cells by dual regulation of glycolytic enzyme pyruvate kinase M2. Mol Cancer [Internet] 2013; 12:72. Available from: http://www.pubmedcentral.nih.gov/articlerender.fcgi?artid=3710280&tool=pmcentrez&rendertype=abstract; PMID:23837608
- Semenza GL. Development of novel therapeutic strategies that target HIF-1. Expert Opin Ther Targets 2006; 10:267–80; PMID:16548775
- Su H, Bodenstein C, Dumont RA, Seimbille Y, Dubinett S, Phelps ME, Herschman H, Czernin J, Weber W. Monitoring tumor glucose utilization by positron emission tomography for the prediction of treatment response to epidermal growth factor receptor kinase inhibitors. Clin Cancer Res.. 2006 Oct 1; 12(19):5659-67.