
Abstract
The tumor suppressor, PTEN, is one of the most commonly mutated genes in cancer. Recently, PTEN has been shown to localize in the nucleus and is required to maintain genomic stability. Here, we show that nuclear PTEN, independent of its phosphatase activity, is essential for maintaining heterochromatin structure. Depletion of PTEN leads to loss of heterochromatic foci, decreased chromatin compaction, overexpression of heterochromatic genes, and reduced protein stability of heterochromatin protein 1 α. We found that the C-terminus of PTEN is required to maintain heterochromatin structure. Additionally, cancer-associated PTEN mutants lost their tumor-suppressor function when their heterochromatin structure was compromised. We propose that this novel role of PTEN accounts for its function in guarding genomic stability and suppressing tumor development.
Introduction
PTEN (phosphatase and tensin homolog deleted from chromosome 10), a tumor suppressor gene, is frequently mutated in a number of tumor lineages, including: glioblastomas, melanomas, and carcinomas of the prostate, breast, and endometrium.Citation1-3 PTEN has been known to regulate AKT kinase activation as well as downstream cell survival and growth response and is dependent upon its phosphatase activity.Citation4-6 Intriguingly, recent studies have identified PTEN localization in the nucleus, through monoubiquitination by NEDD4–1,Citation7 where it interacts with nuclear proteins and is required for maintaining genomic stability.Citation8,9 This is mediated partly independently of the PI3K-AKT pathway. Additionally, PTEN has been found to localize at centromeres, and the disruption of the association of PTEN with centromeres was found to cause centromeric instability.Citation8 Nevertheless, how nuclear PTEN regulates the centromere and other nuclear components remains elusive.
The mammalian centromere and pericentromere is composed of a distinct compact chromatin structure, called heterochromatin, which is essential for proper centromere stability and function.Citation10,11 The heterochromatin is constructed by epigenetic modifications, such as repressive histone H3 trimethyl Lys 9 (H3K9me3), histone hypoacetylation, and by accumulation of non-histone protein heterochromatin protein 1 (HP1), which recruits other essential downstream heterochromatin modifying proteins.Citation12-15 Embedded in the heterochromatin is a group of highly repetitive DNA sequence, referred to as satellite DNA.Citation14,16 Transcription of satellite DNA is naturally repressed by the compact structure of heterochromatin; thus, its overexpression has been associated with genomic instability.Citation17,18
The implications of heterochromatin structure in human cancer have been recently highlighted by the dramatic correlation between the mutation rates of the cancer genome and heterochromatin,Citation19 and by the overexpression of heterochromatic satellite DNA sequence in diverse mouse and human cancers.Citation20 In the present study, we identify a link between PTEN and heterochromatin. We demonstrate that PTEN plays an essential role in maintaining heterochromatin structure through the C-terminus domain, which is independent of its phosphatase activity. The cancer-associated PTEN mutant that is devoid of its C-terminus lost its tumor-suppressive function, which reveals a new mechanism for PTEN in guarding genomic stability and thus tumor suppression.
Results
Heterochromatin structure is impaired by PTEN deficiency
Recently, PTEN was found to be critical for the stability of centromeres,Citation8 which led us to explore the role of PTEN in the regulation of heterochromatin structure. We found that in mouse embryonic fibroblast (MEF) cells, PTEN knockout led to a significant reduction in H3K9me3 foci intensity, indicative of decondensation of the heterochromatin (). Tight heterochromatin structure was reformed upon addition of wild-type (WT) PTEN. Additionally, reduction in H3K9me3 foci was also detected when PTEN expression was transiently knocked down in human U2OS cells (), revealing a common regulatory role of PTEN in heterochromatin in both mouse and human cell lines. In contrast, the euchromatin marker histone 3 lysine 4 dimethylation (H3K4me2) was unaffected by the loss of PTEN (Fig. S1).
Figure 1. PTEN deficiency impairs heterochromatin structure. (A) Wild-type (WT) PTEN, PTEN knockout (PKO), or PTEN re-expressed in PTEN knockout (WT/PKO) MEF cells were stained with H3K9me3 (red) and nuclei (DAPI, blue) and western blots (WB) of PTEN protein level is shown below. (B) Immunofluorescent staining revealing H3K9me3 foci in control siRNA (Ctrl) and PTEN siRNA (Psi) knockdown U2OS cells and corresponding WB analysis. (C) RT-qPCR of major and minor DNA satellites in WT PTEN and PKO MEF cells. Ct values of each sample were normalized to GAPDH expression. Error bars indicate s.d. (D) RT-qPCR of Satα and mcBox in control or stable PTEN-knockdown (PTEN sh2) MCF-10A cells. Ct values of each sample were normalized to GAPDH expression. Error bars indicate s.d. (E) ChIP-qPCR analysis in control or stable PTEN-knockdown (Psh2) MCF-10A cells. The occupancy of H3K9me3 at the Satα locus was analyzed by qPCR (2% input). WB analysis of expression levels in stable control and PTEN sh2 cells. (F) MNase digestion assay in MCF-10A with stable (Psh) (left) or U2OS cells with transient (Psi) PTEN knockdown (right).
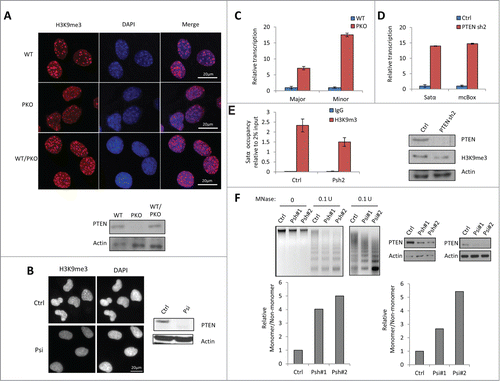
Defects in heterochromatin can result in the overexpression of the embedded genes.Citation21 The peri- and centromere heterochromatin consist of highly repetitive DNA elements, major and minor DNA satellites in miceCitation14 and Satellite α (Satα) and mcBox DNA in humans.Citation16 To determine the functional consequence of heterochromatin, we performed quantitative real time PCR (RT-qPCR) to examine the transcription of satellite DNA. The overexpression of both mouse and human satellite DNA was detected in the absence of PTEN (). Along with the increased satellite transcription, PTEN knockout also decreased the enrichment of H3K9me3 at the satellite locus (). This suggested that the absence of PTEN resulted in the loss of chromatin compaction. To test this hypothesis, a micrococcal nuclease (MNase) digestion assay was performed. MNase cleaves preferentially the linker DNA that lies between individual nucleosomes, thus the sensitivity of the genomic DNA to MNase reflects the condensation of the chromatin. We discovered that the genomic DNA extracted from PTEN-depleted cells was highly sensitive to MNase ( left). Similar results were found in U2OS cells treated with PTEN siRNA ( right). These findings leads us to believe that PTEN may be essential in maintaining the compact nature of heterochromatin and consequently, to suppress the transcription of heterochromatic genes.
PTEN regulates heterochromatin structure by binding and stabilizing HP1α
The heterochromatin defects in PTEN-depleted mouse and human cells highlights a fundamental role of PTEN in stabilizing heterochromatin structure. To gain mechanistic insight into the role of PTEN in maintaining heterochromatin structure, we investigated whether PTEN directly associates with heterochromatin. A chromatin fractionation assay revealed that PTEN was able to bind directly to chromatin (Fig. S2A). Furthermore, a chromatin immunoprecipitation assay (ChIP) showed that PTEN was enriched on the heterochromatin Satα DNA (Fig. S2B). The enrichment of PTEN on heterochromatin seemed independent of the histone code because no interaction between PTEN and H3K9me3 could be detected (unpublished observations).
Since PTEN binds directly to heterochromatin, we then sought to determine if PTEN was also able to interact with other heterochromatin proteins. HP1 is a major component of heterochromatin. HP1 acts as a structural adaptor by mediating the formation of stable macromolecular complexes between nucleosomes and thus plays a key role in establishing and maintaining transcriptionally repressive heterochromatin.Citation22,23 Through co-immunoprecipitation (co-IP) assays, we found that PTEN binds to HP1α (). Moreover, in an in vitro binding experiment, PTEN was able to weakly bind to HP1α, in the absence of all other cellular protein (). Additionally, this interaction was derived from only nuclear PTEN (). Since the binding affinity of PTEN to HP1α was significantly higher in the presence of cellular proteins, PTEN and HP1α may be part of a complex that binds to heterochromatin. Furthermore, endogenous PTEN and endogenous HP1α bind together in the nucleus in WT MEF cells (). Next, we assessed whether PTEN functionally regulates HP1α. In PTEN knockout cells, HP1α protein level was significantly reduced (), however, no change in HP1α mRNA level was observed in both PTEN knockout and PTEN knockdown cells (Fig. S2C, D). Moreover, a dramatic reduction of HP1α foci intensity was observed in PTEN-knockout MEF cells compared to WT MEF cells () Thus, PTEN is required for heterochromatin structure.
Figure 2. PTEN regulates heterochromatin structure through stabilizing HP1α. (A) GST pull-down assay with WT PTEN or PKO MEF cell lysates, which were incubated with GST or GST-HP1α conjugated beads. The pull-down assay was conducted in duplicate (lanes 2 and 3). (B) Co-IP assay was conducted with U2OS cells transfected with HA (left) or HA-PTEN in MEF cells (right). 4% Input was used. (C) In vitro direct binding assay. Recombinant GST- and GST-HP1α was synthesized via bacteria contructs. PTEN was synthesized by quick couple transcription translation system kit. PTEN and GST-HP1α were incubated and analyzed by WB analysis. (D) MEF cells were transfected with GFP-HP1α and then fractionated by NP-40 and IP was performed in cytosolic (Cyto) and nuclear (Nuc) fractions using anti-HP1α antibody. (E) MEF cells were fractionated by NP-40 and IP was performed using cytosolic (Cyto) and nuclear (Nu) fractions using anti-PTEN antibody. (F) Representative WB of heterochromatin proteins in WT PTEN or PKO MEF cells (left). Quantitative HP1α expression level relative to actin expression from 3 independent experiments (right). Error bars indicate s.d. (G) Immunofluorescent staining revealing of HP1α foci (red) and DNA (blue) in WT and PKO MEF cells. (H) U2OS cells were transfected with control (Ctrl) or PTEN siRNA (Psi). The PTEN-knockdown cells were further treated with PI3K inhibitor, LY294002 (LY) and protein expression was analyzed by WB. (I) Control or PTEN siRNA–transfected U2OS cells were treated with CHX, and analyzed by WB (top). The relative HP1α protein abundance was obtained by measuring the band intensities using ImageJ, and normalizing to actin expression and then to the time point without the addition of CHX (bottom). The half-life of HP1α in WT MEF cells is >24 h and in PKO cells 6 h. (J) MEF and PKO cells were treated with MG132 for 6 h and analyzed by WB. (K) U2OS cells were transfected with control (Ctrl) or PTEN siRNA (Psi), and 24 h later GFP-HP1α and His-ubiquitin (His-Ub) plasmids. Cells were harvested 24 h later and the His-ubiquitin–tagged proteins were purified by Ni-NTA resin. The ubiquitinated HP1α was detected with an anti-GFP antibody. (L) RT-qPCR was performed to determine the Satα level (right). Ct values of each sample were normalized to GAPDH. Error bars indicate s.d. Western blot analysis of targeted genes.
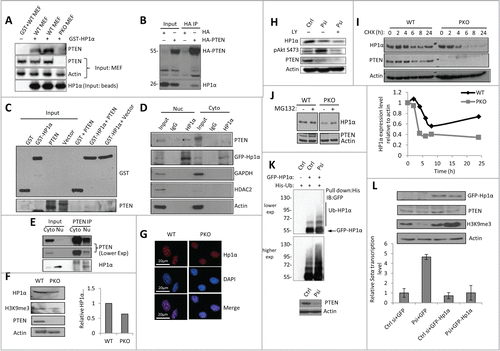
PTEN regulates the function of HP1α by a directional binding interaction and this is reflected in the expression level of these proteins. Since the cell cycle is dependent upon the change in HP1α's cellular distribution,Citation24 we investigated the cell cycle distribution in both PTEN knockdown and knockout cells. We found that cell cycle only slightly changed in PTEN deficient cells (Fig. S3). In addition, treatment with the PI3K inhibitor, LY294002 (LY), in PTEN knockdown cells showed that the downregulation of HP1α was independent of the PI3K–AKT pathway (). Furthermore, the treatment of U2OS cells with LY did not change the expression level of HP1α (Fig. S4A). The stability of HP1α was assessed in both PTEN WT and knockout cells. We observed that in PTEN deficient cells, the half-life of HP1α was reduced from 24 h to 6 h (), implying that PTEN stabilizes HP1α. Moreover, treatment with the proteasome inhibitor, MG132, increased the expression level of HP1α in PTEN deficient cells, suggesting that HP1α was degraded through the proteasome pathway (). Increased polyubiquitination of HP1α was also observed in PTEN-knockdown cells (), which supports our hypothesis that PTEN protects HP1α from degradation. Additionally, the introduction of HP1α suppressed the satellite DNA overexpression in PTEN-knockdown cells (), indicating that the decrease in HP1α expression is directly related to defects in the heterochromatin when PTEN expression is also depleted. Together, the above observations indicate that PTEN localizes to heterochromatin and, by stabilizing HP1α from proteasomal degradation, is essential to maintain the compact heterochromatin structure.
The C-terminus of PTEN is critical for maintaining heterochromatin structure
Previous studies have shown that the C-terminus has a functional role in nuclear localization, anchorage-independent growth and cell migration.Citation9 Moreover, in patients with Cowden Syndrome, which are highly susceptible to breast and thyroid cancer, 80% of their total mutations are germline C-terminus PTEN truncations.Citation25 Therefore, using the overexpression of satellite DNAs as a reporter of disrupted heterochromatin, we conducted a knockdown-and-mutant-rescue experiment to examine the function of various cancer-associated PTEN mutants in heterochromatin. As determined by RT-qPCR, WT PTEN successfully suppressed satellite DNA overexpression (), confirming that PTEN is directly involved in maintaining heterochromatin structure. Furthermore, phosphatase-dead PTEN mutants (C124S, R130G/Q and R173C) showed rescue effects comparable to those of WT PTEN, which further demonstrated that PTEN maintains normal heterochromatin structure independent of its phosphatase activity. Interestingly, we discovered that the C-terminal truncated mutant, PTEN Y336*, which retains the intact N-terminal phosphatase domain and AKT activity (as shown in Fig. S4B), not only failed to suppress satellite DNA overexpression but also increased its transcription ∼20-fold ( lower panel). This dramatic satellite DNA upregulation prompted us to explore how this C-terminus truncated mutant affects the heterochromatin structure.
Figure 3. C-terminus is required for PTEN to Stabilize HP1α. (A) Knockdown-mutant rescue assay in U2OS cells that were transfected with control (Ctrl) or 2 sets of PTEN siRNA (Psi#1 and Psi#2). After 24 h, empty vector, WT PTEN, or the phosphatase dead PTEN mutant, C124S, were overexpressed (top). The cells were harvested 24 h after the second transfection, and analyzed by RT-qPCR and WB (top). PTEN-knockdown U2OS cells were rescued with empty vector, WT PTEN or various cancer-associated PTEN mutants (bottom). Ct values of each sample were normalized to GAPDH expression. Error bars indicate s.d. WB is shown above the corresponding RT-qPCR condition in order to display exogenous protein expression level. (B) Protein stability of HP1α determined by WB in U2OS cells that were transfected with HA-WT PTEN or HA-PTEN Y336*, and treated with CHX for up to 27 h after transfection. The band intensities were measured by ImageJ and the relative HP1α protein level was normalized to actin expression (bottom). The half-life of HP1α in PTEN Y336* is 5 h compared to 24 h in PTEN WT cells. (C) His-ubiquitin and GFP-HP1α were co-transfected with WT, vector or PTEN Y336*. Cells were harvested 48 h after transfection and the His-ubiquitin–tagged proteins were purified by Ni-NTA resin. The ubiquitinated HP1α was detected with an anti-GFP antibody. (D) U2OS cells were transfected with HA-WT PTEN (WT) or HA-PTEN Y336* (336*), fractionated to obtain cytosolic (cyto) and nuclear (nuc) proteins and analyzed by WB. (E) Flag-PTEN WT, HA-vector, or HA-PTEN Y336* was transfected into U2OS cells, fractionated, and whole cell lysate, cytosolic, and nuclear protein extracts were then analyzed by WB. (F) Co-IP was conducted to determine the interaction between WT PTEN and HP1α in the presence of PTEN Y336*. BT549 cells expressing WT PTEN (BT549 PTEN), Vet (BT549 Vet), or PTEN Y336* (PT549 336*) were transfected with HA-PTEN WT, HA-vet, or HA-PTEN Y336*. A co-IP was performed with anti-HA antibody and probed for PTEN and HP1α.
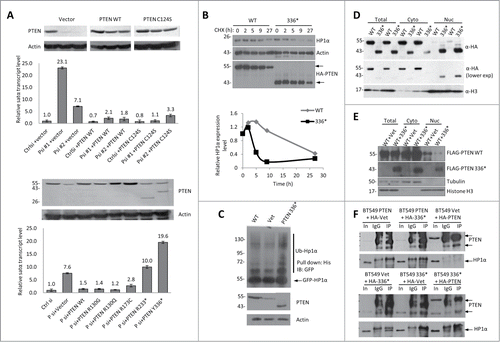
As the overexpression of HP1α can repress satellite DNA expression in PTEN-knockout cells (), we reasoned that the high expression level of the satellite DNA with the introduction of the PTEN Y336* mutant was due to an altered HP1α expression level. Indeed, HP1α protein stability was significantly decreased in the PTEN Y336* mutant cells (), with a 5 h half-life of HP1α, which is comparable to the PTEN knockout cells (see ). Moreover, the PTEN Y336* mutant had enhanced polyubiquitination of HP1α (). This indicates that the truncated PTEN mutant does not stabilize HP1α from degradation, and as a consequence, the heterochromatin structure may be compromised.
Next, we determined if the effect of the PTEN Y336* mutant on HP1α was caused by an altered binding affinity to heterochromatin. The co-IP showed that the PTEN Y336* mutant was able to bind to HP1α, and the enrichment of the PTEN Y336* mutant was detected at the Satα locus (Fig. S5A, B). These results suggested that the lack of Satα transcription-repressive activity was not due to the reduced association of PTEN Y336* with heterochromatin. In contrast to the predominantly cytosolic localization of WT PTEN, the PTEN Y336* mutant accumulates predominantly in the nucleus (). This observation of the nuclear distribution of PTEN Y336* allowed us to hypothesize that this mutant interferes with the normal heterochromatin function of PTEN. To test this idea, we co-transfected PTEN Y336* with WT PTEN or vector control. In the presence of both WT PTEN and PTEN Y336*, the abundance of nuclear WT PTEN was greatly reduced compared to the WT PTEN and vector control (). Next, we conducted co-IP experiments to examine the interaction of WT PTEN with HP1α in the presence of the PTEN Y336* mutant. BT549 cells expressing WT PTEN (BT549 PTEN), Vector control (BT549 Vet), or PTEN Y336* (PT549 336*) were transfected with HA-PTEN WT (HA-PTEN), HA-vet, or HA-PTEN Y336* (HA-336*). A co-IP was performed with anti-HA antibody and probed for PTEN and HP1α. Interestingly, we found that a weak complex formed between the WT and PTEN Y336* mutant () and PTEN 336* was also shown to bind to HP1α. Due to the complex formation of WT PTEN and PTEN Y336*, interaction between WT PTEN and HP1α was diminished which was likely due to the reduction of nuclear WT PTEN.
C-terminal truncated PTEN mutant does not function as a tumor suppressor and is sensitive to chemotherapeutic agents
To investigate how PTEN's stabilization of HP1α effects its tumor-suppressive role, we compared the cell growth and colony formation in PTEN-null breast cancer cell line BT-549, which was reconstituted with either an empty control vector, WT PTEN, PTEN Y336* mutant, or WT PTEN with HP1α knockdown (PTEN-HP1αKD). In contrast to WT PTEN, both the PTEN Y336* and PTEN-HP1αKD mutants failed to suppress cell growth (), arrest cell-cycle progression (), or inhibit colony formation in a soft agar assay (). Both mutants responded similarity to the empty vector control in cell proliferation, cell cycle arrest and colony formation, indicating the loss of its tumor suppressor function.
Figure 4. The heterochromatic function of PTEN is required for its tumor-suppressive activity. (A) BT-549 cells were reconstituted with empty vector (Vet), WT PTEN (WT), or PTEN Y336* (336*) or PTEN WT HP1α KD. Relative cell growth rates were determined by MTT assay. The results were presented as mean of 3 independent experiments. Error bars indicate s.d. (B) BT-549 cells reconstituted with Vet, WT, 336*, or PTEN WT HP1α KD were analyzed for the cell cycle distribution by flow cytometry. (C) BT-549 cells reconstituted with Vet, WT, 336* or PTEN WT HP1αKD anchorage-independent cell growth determined by soft agar assays. The results were presented as mean of 3 independent experiments. Error bars indicate s.d. (D) BT-549 cells reconstituted with Vet, WT, 336* or PTEN WT HP1αKD were treated with doxorubicin (Dox). Relative cell viability was determined by MTT assay. The results shown are a mean of 3 independent experiments. Error bars indicate s.d. (E) BT-549 cells reconstituted with Vet, WT, 336* or PTEN WT HP1αKD were treated with BMN673. Relative cell viability was determined by MTT assay. The results were presented as mean of 3 independent experiments. Error bars indicate s.d. (F) BT-549 cells reconstituted with Vet, WT, 336* or PTEN WT HP1αKD were treated with 5-aza-2′-deoxycytidine (5AZA). Relative cell viability was determined by MTT assay. The results were presented as mean of 3 independent experiments. Error bars indicate s.d. (G) Representative immunohistochemistry tissue array staining for HP1α and PTEN expression in 6 individual breast carcinoma patients. Grade 1 = well differentiated. Cells appear normal and are not growing rapidly. Grade 2 = moderately-differentiated. Cells appear slightly different than normal.
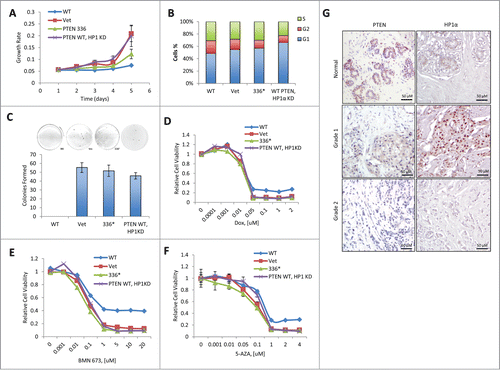
Since PTEN-deficient cancer cells are hypersensitive to DNA-damaging agents,Citation26 we next examined the response of the reconstituted PTEN cell lines to the genotoxic agent, doxorubicin. We found that the WT PTEN cells exhibited decreased sensitivity to doxorubicin, whereas the PTEN Y336* and PTEN-HP1αKD mutants, and the empty control vector cells exhibited similar sensitivity to doxorubicin ().
Loss of PTEN compromises homologous recombination repair and thus PTEN-null cancer cells are more sensitive to poly(ADP-ribose) polymerase (PARP) inhibitors.Citation27 In agreement, we determined that WT PTEN cells displayed decreased sensitivity to the PARP inhibitor, BMN673. However, similar sensitivity to BMN673 was observed in control and both PTEN Y336* and PTEN-HP1αKD mutant reconstituted BT-549 cells (). Doxorubicin and PARP inhibitors target highly proliferating cells by inhibiting DNA replication or DNA damage repair, respectively. Therefore, we included a DNA-demethylating agent, 5-aza-2′-deoxycytidine (5-AZA), which was recently shown to be an effective chemotherapeutic agent in satellite DNA overexpressing cells.Citation28 Interestingly, we discovered that only WT PTEN cells had reduced sensitivity to 5-AZA ().
Lastly, to determine the relevance of the regulation of HP1α by PTEN in human patients, immunohistochemistry staining of HP1α and PTEN were conducted on breast cancer tissue microarrays (). Expression correlation between HP1α and PTEN was detected in 6 individual breast carcinoma samples. Interestingly, in grade 1 tumors, which consist of well-differentiated slow growing tumor cells, PTEN and HP1α expression was increased, whereas in grade 2 tumors, comprising of moderately-differentiated cells PTEN and HP1α are decreased. These data indicated that PTEN and HP1α are highly correlated in normal and breast cancer tissues suggesting that loss of PTEN may contribute to loss of HP1α in advanced human tumors. Thus, in breast cancer tumors, PTEN deficiency also leads to decrease in HP1α expression that results in the relaxation of heterochromatin and may led to the further dysregulation of the embedded heterochromatic genes.
Discussion
At the time of submission, Chen et al. reported that PTEN interacts with histone H1 and together with HP1α, repressed H4K16 acetylation and maintained chromatin condensation.Citation29 Together with our report, we propose that PTEN has a critical role in the maintenance of heterochromatin by forming a complex with HP1α and histone H1 for chromatin condensation. In the absence of PTEN, the heterochromatin relaxes, activating transcription of the embedded genes. PTEN binds to HP1α, therefore stabilizing HP1α from degradation from the proteasomal pathway. Moreover, the C-terminus of PTEN is essential for maintaining heterochromatin structure. However, cancer associated PTEN mutants that have an active phosphatase domain, most notably PTEN Y336*, despite still being able to bind to HP1α was unable to stabilize and protect HP1α from degradation. Instead, a 20-fold increased satellite DNA expression was observed, indicating the disruption of heterochromatin structure and the lost of PTEN's suppressive function. Nevertheless, in PTEN deficient BT549 cells, the expression of Y336* had no effect of HP1α stability (Fig. S5B). We suggest that the PTEN Y336* mutant may act in a dominant-negative manner to suppress PTEN function on heterochromatin, possibly by directly interacting with WT PTEN and thus affecting nuclear accumulation of PTEN.
Due to the relaxed nature of heterochromatin when PTEN is absent or has a C terminus truncation (PTEN 336*), patients with this phenotype may be more responsive to chemotherapies. Our results showed that breast cancer cells expressing C-terminal truncated PTEN mutants are as sensitive to the DNA-damaging drug, doxorubicin, a PARP inhibitor, BMN673, and a DNA-demethylating agent, 5-AZA, as PTEN-deficient breast cancer cells. This indicates that these chemotherapeutic drugs can be equally useful in treating C-terminal truncated PTEN as well as PTEN-deficient tumors. However, since the phosphatase activity is still intact in the C-terminal truncated PTEN mutants, this mutant can still suppress AKT activity and thus are unlikely to respond to either PI3K or AKT inhibitor treatment (unpublished observation). Therefore, we propose that the combination of PTEN mutational analysis and satellite DNA expression pattern may be utilize to develop a chemotherapeutic strategy, in which patients may benefit from treatment with DNA-damaging agents. In addition, the decreased in HP1α expression level was correlated with progression of many human cancers, including breast, brain, colon, leukemia and papillary thyroid cancers.Citation30 In this sense, the potential importance of satellite DNA, HP1α and PTEN dysregulation as a biomarker in cancer progression merits further clinical testing.
Methods
Cell culture and reagents
U2OS and MCF10A cells were purchased from American Type Culture Collection (ATCC). U2OS cells were maintained in McCoy 5A medium supplemented with 10% FBS. MCF10A cells were cultured in mammary epithelial growth medium containing insulin, hydrocortisone, EGF, and bovine pituitary extract purchased from Clonetics. PTEN WT and PTEN knockout MEF cells were kindly provided by Dr. Hui-Kuan Lin and were maintained in Dulbecco's Modified Eagle's Medium supplemented with 10% FBS. Transfection reagents Lipofectamine 2000 and Lipofectamine 3000 were purchased from Life Technologies. FuGENE® 6 Transfection Reagent was purchased from Promega.
Cell proliferation assays
Cells were seeded in 96-well plates (200 cells/well) and incubated for a total of 5 d at 37°C, 5% CO2. MTT assays were performed. The absorbance was measured at 570 nm using a microplate reader (Molecular Devices). The proliferation rate was calculated relative to that for control cells.
Cell fractionation and immunoprecipation
Cell fractionation assays were performed using NP-40 as previously described.Citation31 To obtain cytosolic and nuclear fractions, cells were harvested in PBS and centrifuged at 500 × g for 5 min at 4°C. The supernatant was discarded and the cell pellet was resuspended in 100 μLof fractionation buffer (50 mM Hepes, pH 7.5, 150 mM NaCl, 1 mM EDTA) containing 0.2% Nonidet P-40 (NP-40), supplemented with a protease inhibitors cocktail. Following centrifugation at 1000 × g for 5 min, the supernatant was collected and regarded as cytosolic fraction. The pellet was washed with the same buffer without NP-40. After washing, the pellets were collected by centrifugation at 1000 × g for 5 min, and regarded as nuclear fraction. To precipitate the endogenous PTEN, whole-cell extracts, cytosolic and nuclear extracts obtained from MEF cells were pre-cleared with protein A/G plus-agarose beads (Santa Cruz) and 1μg mouse IgG (Santa Cruz). Then, cellular extracts were subjected to incubation with PTEN antibody (Millipore #04–035) overnight and incubated with protein A/G agarose beads for 4 h at 4°C. The immunocomplex was eluted in loading buffer by boiling at 95°C for 5 min and then subject to WB analysis.
Immunoprecipitation
U2OS cells transiently transfected with Flag-tagged or HA-tagged plasmids and incubated at 37°C, 5% CO2 for 48 h. Whole-cell extracts were prepared with lysis buffer (25 mM Tis.HCl PH7.4, 150 mM NaCl, 5% Glycerol, 1% NP40, 1 mM EDTA) and pre-cleared with protein A/G plus-agarose beads (Santa Cruz) and 1μg mouse IgG (Santa Cruz). The cellular extracts were incubated with anti-FlagM2 affinity gel (Sigma-Aldrich #A2220) or anti-HA−agarose (Sigma-Aldrich #A2095) overnight, and then incubated with protein A/G agarose beads for 4 h at 4°C. The immunocomplex was eluted in loading buffer by boiling at 95°C for 5 min and then subject to WB analysis.
Cell Viability
Cells were seeded in 96-well plates (200 cells/well) and incubated overnight at 37°C, 5% CO2. Cells were then treated with DMSO control or indicating concentrations of BMN673 (Selleckchem), doxorubicin (Selleckchem), or 5-aza-2′-deoxycytidine (Selleckchem) and incubated for 5 d at 37°C, 5% CO2. MTT assays were performed. The absorbance was measured at 570 nm using a microplate reader (Molecular Devices). The cell viability was calculated relative to control cells.
Direct binding Interaction
GST-vector and GST-HP1α bacterial constructs were grown to an OD600 of 0.8 at 37°C and induced with 0.1 mM IPTG. Cultures were incubated overnight at 37°C. The cells were pelleted and resuspended in PBS lysis buffer (150 mM NaCl, 20 mM NaHPO4, 1 % trition-100, protease inhibitors). The samples were sonicated (10 puluses, 2×) and centrifuged at 12,000 × g for 15 min at 4°C. The supernatant was transferred to a new tube and incubated with glutathione-sepharose beads for 30 min at 4°C, rotating. The samples were centrifuged at 750 × g for 1 min at 4°C and supernatant was removed. The beads were washed twice with 5 mL PBS (150 mM NaCl, 20 mM NaHPO4, protease inhibitors) and centrifuged at 750 × g for 1 min at 4°C. Recombinant PTEN was made using TnT Quick Coupled Transcription/Translation System (Promega) with pFLAG-PTEN according to the manufacturer's protocol. GST-vector, GST-HP1α, and PTEN was quantified through western blot analysis. Direct binding interaction was determined by incubating GST-HP1α with PTEN in PBS buffer (see above) for 2 h at RT, rotating. The samples were centrifuged at 850 × g for 4 min at RT. The supernatant was discarded and the pellet was washed 4×, with ice cold PBS. SDS sample loading buffer was added to the pellet and boiled at 95°C for 5 min and analyzed by western blot.
Soft agar assay
WT PTEN, Vetor, PTEN Y336*, and PTEN-HP1αKD reconstituted BT-549 cells (10,000 cells/plate) were resuspended in 0.35% agarose and seeded on 60 mm plates coated in 0.5% agarose. The cells were incubated for 26 d at 37°C, 5% CO2. Colonies were stained with a staining solution (0.005% crystal violet and 25% methanol in PBS) for visualization.
Lentiviral infection and siRNA transfection
MCF-10A PTEN knockdown (Psh) cells were generated by infecting with individual MISSION lentiviral particles (Sigma) targeting PTEN according to the manufacturer's instructions. After infection, cells were selected by using puromycin (1 μg/ml). BT-549 cells were generated by infecting with Vector, PTEN WT or PTEN Y336* lentiviral particles using the pLenti6/V5-DEST™ Gateway system (Invitrogen). After infection, cells were selected by using Blasticidin (10 μg/ml). PTEN-HP1αKD stable cells were generated by infecting BT549 PTEN WT stable cells with individual MISSION lentiviral particles (Sigma) targeting CBX5 according to the manufacturer's instructions. For transient transfection, PTEN was knocked down with siRNA (Sigma SASI_ Hs01_00196478 (Psi#1 5′ GGUGUAAUGAUAUGUGCAUdTdT) & Hs01_00196480 (Psi#2 5′ CAAAUUUAAUUGCAGAGUUdTdT)) using Lipofectamine 2000 or 3000 (Invitrogen) following the manufacturer's instructions. For mutant rescue experiments, U2OS cells were first transfected with control siRNA (control) or PTEN siRNA. After 24 h, cells were transfected with empty pLenti6.3 vector or various pLenti6.3-PTEN plasmids. Cells were harvested 24 h after the second transfection.
PI3K Inhibitor Treatment
U2OS cells were transfected with PTEN siRNA using Lipofectamine 2000 following the manufacturer's protocol for 24 h. U2OS Psi cells and U2OS WT cells were serum starved for 4 h and treated with LY294002 (LY, 10 μM) for 3 h. The cells were harvested and analyzed by WB.
Heterochromatin Foci Staining
To observe heterochromatin foci, cells were cultured on cover slides and incubated with cytoskeleton buffer and then stripping buffer as previously described.Citation32 After fixation with 4% paraformaldehyde, cells were further permeabilized with ice-cold methonal/acetone (50:50) for 20 sec. The antibodies (anti-H3K9me3, Abcam #ab8898; anti-HP1α, Cell Signaling #2616; and anti-H3K4m2, Cell Signaling #9725) were diluted at 1:200 in 5% goat serum. The images were captured with an Olympus FluoViewFV1000 confocal microscope.
Quantitative Reverse Transcription PCR
Cells were harvested with Trizol (Invitrogen) according to the manufacturer's protocol. The SuperScript III First-strand Synthesis system (Invitrogen) kit was used for reverse transcription according the manufacturer's protocol. QPCR products were analyzed with SYBR green using Eppendorf RealPlexCitation4 detection system software. Cross-linking and ChIP were performed with a ChIP assay kit (Millipore). Primers used for qRT-PCR and qChIP are: Satα 5′AAGGTCAATGGCAGAAAAGAA, 5′CA ACGAAGGCCACAAGATGTC, mcBox 5′AGGGAATGTCT TCCCATAAAAACT, 5′GTCTACCTTTTATTTGAATTCC CG, MajorSat 5′GGCGAGAAAACTGAAAATCACG, 5′CTT GCCATATTCCACGTCCT, MinorSat 5′TTGGAAACGGGA TTTGTAGA, 5′CGGTTTCCAACATATGTGTTTT, HP1α(human) 5′TGGAAAGGCTTTTCTGAGGA, 5′ATGTCATC GGCACTGTTTGA, HP1α(mouse) 5′AGCCGACAGCTCT TCTTCAG, 5′CCCTGGGCTTATTGTTTTCA.
MNase Digestion Assay was conducted as described by.Citation33
Tissue arrays were obtained from US Biomax. After deparaffinization and antigen retrieval with citric acid, the slides were incubated with anti-PTEN (Cell Signaling #9188) and anti-HP1α (Cell Signaling #2616) antibodies. The final immunohistochemistry staining procedure was carried out using the LSAB2 System according to the manufacturer's protocol (Dako LSAB2 System-HRP).
Disclosure of Potential Conflicts of Interest
No potential conflicts of interest were disclosed.
Author Contributions
L.G. made the heterochromatin observation and performed the confocal microscopy, ChIP, RT-qPCR, and co-IP experiments. J.M.G. performed western blots, binding assays, cell viability assays, cell cycle analysis, prepared and revised the manuscript for publication. E.B.E. performed tissue microarray analysis, and confocal imaging. H.D. established the PTEN WT and PTEN mutant BT-549 cell lines. E.W. performed ubiquitination assay. S.W.L. harvested the MEF cells. G.B.M. analyzed the patient information associated with the PTEN mutants. H.K.L. made critical suggestions to the paper. A.L. analyzed and scored the tissue microarrays. All experiments and experimental design were performed under the supervision of S.Y.L. Correspondence and requests for materials should be addressed to S.-Y.L. ( [email protected]).
1044174_supplemental_files.pptx
Download MS Power Point (1 MB)Acknowledgments
We thank Dr. Peter German from the Department of Systems Biology at The University of Texas MD Anderson Cancer Center for assisting with qPCR analysis. Dr. Wei Mo and Dr. Curtis Lin from the Department of Systems Biology for assisting with the drug treatment and providing us with the tissue microarrays; Dr. Zhenbo Han from the Department of Molecular & Cellular Oncology for assisting with Tissue array analysis; Dr. Jared Burks and Carol from the MD Anderson Flow Cytometry and Cellular Imaging Facility for assisting with confocal microscopy and fluorescence-activated cell sorting, respectively.
Funding
This work was supported by a Department of Defense Era of Hope Scholar Award (W81XWH-10–1–0558) to S.-Y.L, and NCI P50CA083639 to S.-Y.L and G.B.M.
Supplemental Material
Supplemental data for this article can be accessed on the publisher's website.
Related Research Data
References
- Li J, Yen C, Liaw D, Podsypanina K, Bose S, Wang SI, Puc J, Miliaresis C, Rodgers L, McCombie R, et al. PTEN, a putative protein tyrosine phosphatase gene mutated in human brain, breast, and prostate cancer. Science 1997; 275:1943-7; PMID:9072974; http://dx.doi.org/10.1126/science.275.5308.1943.
- Li DM, Sun H. TEP1, encoded by a candidate tumor suppressor locus, is a novel protein tyrosine phosphatase regulated by transforming growth factor β. Cancer Res 1997; 57:2124-9; PMID:9187108.
- Steck PA, Pershouse MA, Jasser SA, Yung WK, Lin H, Ligon AH, Langford LA, Baumgard ML, Hattier T, Davis T, et al. Identification of a candidate tumour suppressor gene, MMAC1, at chromosome 10q23.3 that is mutated in multiple advanced cancers. Nat Genet 1997; 15:356-62; PMID:9090379; http://dx.doi.org/10.1038/ng0497-356.
- Bellacosa A, Testa JR, Staal SP, Tsichlis PN. A retroviral oncogene, akt, encoding a serine-threonine kinase containing an SH2-like region. Science 1991; 254:274-7; PMID:1833819; http://dx.doi.org/10.1126/science.1833819.
- Chang HW, Aoki M, Fruman D, Auger KR, Bellacosa A, Tsichlis PN, Cantley LC, Roberts TM, Vogt PK. Transformation of chicken cells by the gene encoding the catalytic subunit of PI 3-kinase. Science 1997; 276:1848-50; PMID:9188528; http://dx.doi.org/10.1126/science.276.5320.1848.
- Staal SP. Molecular cloning of the akt oncogene and its human homologues AKT1 and AKT2: amplification of AKT1 in a primary human gastric adenocarcinoma. Proc Natl Acad Sci U S A 1987; 84:5034-7; PMID:3037531; http://dx.doi.org/10.1073/pnas.84.14.5034.
- Wang X, Trotman LC, Koppie T, Alimonti A, Chen Z, Gao Z, Wang J, Erdjument-Bromage H, Tempst P, Cordon-Cardo C, et al. NEDD4-1 is a proto-oncogenic ubiquitin ligase for PTEN. Cell 2007; 128:129-39; PMID:17218260; http://dx.doi.org/10.1016/j.cell.2006.11.039.
- Shen WH, Balajee AS, Wang J, Wu H, Eng C, Pandolfi PP, Yin Y. Essential role for nuclear PTEN in maintaining chromosomal integrity. Cell 2007; 128:157-70; PMID:17218262; http://dx.doi.org/10.1016/j.cell.2006.11.042.
- Sun Z, Huang C, He J, Lamb KL, Kang X, Gu T, Shen WH, Yin Y. PTEN C-terminal deletion causes genomic instability and tumor development. Cell Rep 2014; 6:844-54; PMID:24561254; http://dx.doi.org/10.1016/j.celrep.2014.01.030.
- Amor DJ, Kalitsis P, Sumer H, Choo KH. Building the centromere: from foundation proteins to 3D organization. Trends Cell Biol 2004; 14:359-68; PMID:15246429; http://dx.doi.org/10.1016/j.tcb.2004.05.009.
- Saunders WS, Chue C, Goebl M, Craig C, Clark RF, Powers JA, Eissenberg JC, Elgin SC, Rothfield NF, Earnshaw WC. Molecular cloning of a human homologue of Drosophila heterochromatin protein HP1 using anti-centromere autoantibodies with anti-chromo specificity. J Cell Sci 1993; 104 (Pt 2):573-82; PMID:8505380.
- Grewal SI, Elgin SC. Heterochromatin: new possibilities for the inheritance of structure. Curr Opin Genet Dev 2002; 12:178-87; PMID:11893491; http://dx.doi.org/10.1016/S0959-437X(02)00284-8.
- Nakayama J, Rice JC, Strahl BD, Allis CD, Grewal SI. Role of histone H3 lysine 9 methylation in epigenetic control of heterochromatin assembly. Science 2001; 292:110-3; PMID:11283354; http://dx.doi.org/10.1126/science.1060118.
- Guenatri M, Bailly D, Maison C, Almouzni G. Mouse centric and pericentric satellite repeats form distinct functional heterochromatin. J Cell Biol 2004; 166:493-505; PMID:15302854; http://dx.doi.org/10.1083/jcb.200403109.
- Hall LE, Mitchell SE, O'Neill RJ. Pericentric and centromeric transcription: a perfect balance required. Chromosome Res 2012; 20:535-46; PMID:22760449; http://dx.doi.org/10.1007/s10577-012-9297-9.
- Jurka J, Kapitonov VV, Pavlicek A, Klonowski P, Kohany O, Walichiewicz J. Repbase Update, a database of eukaryotic repetitive elements. Cytogenet Genome Res 2005; 110:462-7; PMID:16093699; http://dx.doi.org/10.1159/000084979.
- Bouzinba-Segard H, Guais A, Francastel C. Accumulation of small murine minor satellite transcripts leads to impaired centromeric architecture and function. Proc Natl Acad Sci U S A 2006; 103:8709-14; PMID:16731634; http://dx.doi.org/10.1073/pnas.0508006103.
- Valgardsdottir R, Chiodi I, Giordano M, Rossi A, Bazzini S, Ghigna C, Riva S, Biamonti G. Transcription of Satellite III non-coding RNAs is a general stress response in human cells. Nucleic Acids Res 2008; 36:423-34; PMID:18039709; http://dx.doi.org/10.1093/nar/gkm1056.
- Schuster-Bockler B, Lehner B. Chromatin organization is a major influence on regional mutation rates in human cancer cells. Nature 2012; 488:504-7; PMID:22820252; http://dx.doi.org/10.1038/nature11273.
- Ting DT, Lipson D, Paul S, Brannigan BW, Akhavanfard S, Coffman EJ, Contino G, Deshpande V, Iafrate AJ, Letovsky S, et al. Aberrant overexpression of satellite repeats in pancreatic and other epithelial cancers. Science 2011; 331:593-6; PMID:21233348; http://dx.doi.org/10.1126/science.1200801.
- Grewal SI, Moazed D. Heterochromatin and epigenetic control of gene expression. Science 2003; 301:798-802; PMID:12907790; http://dx.doi.org/10.1126/science.1086887.
- Lachner M, O'Carroll D, Rea S, Mechtler K, Jenuwein T. Methylation of histone H3 lysine 9 creates a binding site for HP1 proteins. Nature 2001; 410:116-20; PMID:11242053; http://dx.doi.org/10.1038/35065132.
- Bannister AJ, Zegerman P, Partridge JF, Miska EA, Thomas JO, Allshire RC, Kouzarides T. Selective recognition of methylated lysine 9 on histone H3 by the HP1 chromo domain. Nature 2001; 410:120-4; PMID:11242054; http://dx.doi.org/10.1038/35065138.
- Fischle W, Tseng BS, Dormann HL, Ueberheide BM, Garcia BA, Shabanowitz J, Hunt DF, Funabiki H, Allis CD. Regulation of HP1-chromatin binding by histone H3 methylation and phosphorylation. Nature 2005; 438:1116-22; PMID:16222246; http://dx.doi.org/10.1038/nature04219.
- Bubien V, Bonnet F, Brouste V, Hoppe S, Barouk-Simonet E, David A, Edery P, Bottani A, Layet V, Caron O, et al. High cumulative risks of cancer in patients with PTEN hamartoma tumour syndrome. J Med Genet 2013; 50:255-63; PMID:23335809; http://dx.doi.org/10.1136/jmedgenet-2012-101339.
- Bassi C, Ho J, Srikumar T, Dowling RJ, Gorrini C, Miller SJ, Mak TW, Neel BG, Raught B, Stambolic V. Nuclear PTEN controls DNA repair and sensitivity to genotoxic stress. Science 2013; 341:395-9; PMID:23888040; http://dx.doi.org/10.1126/science.1236188.
- Mendes-Pereira AM, Martin SA, Brough R, McCarthy A, Taylor JR, Kim JS, Waldman T, Lord CJ, Ashworth A. Synthetic lethal targeting of PTEN mutant cells with PARP inhibitors. EMBO Mol Med 2009; 1:315-22; PMID:20049735; http://dx.doi.org/10.1002/emmm.200900041.
- Leonova KI, Brodsky L, Lipchick B, Pal M, Novototskaya L, Chenchik AA, Sen GC, Komarova EA, Gudkov AV. p53 cooperates with DNA methylation and a suicidal interferon response to maintain epigenetic silencing of repeats and noncoding RNAs. Proc Natl Acad Sci U S A 2013; 110:E89-98; PMID:23236145; http://dx.doi.org/10.1073/pnas.1216922110.
- Chen ZH, Zhu M, Yang J, Liang H, He J, He S, Wang P, Kang X, McNutt MA, Yin Y, et al. PTEN interacts with histone H1 and controls chromatin condensation. Cell reports 2014; 8:2003-14; PMID:25199838; http://dx.doi.org/10.1016/j.celrep.2014.08.008.
- Dialynas GK, Vitalini MW, Wallrath LL. Linking Heterochromatin Protein 1 (HP1) to cancer progression. Mutation Res 2008; 647:13-20; PMID:18926834; http://dx.doi.org/10.1016/j.mrfmmm.2008.09.007.
- Andegeko Y, Moyal L, Mittelman L, Tsarfaty I, Shiloh Y, Rotman G. Nuclear retention of ATM at sites of DNA double strand breaks. J Biol Chem 2001; 276:38224-30; PMID:11454856.
- Peng G, Yim EK, Dai H, Jackson AP, Burgt I, Pan MR, Hu R, Li K, Lin SY. BRIT1/MCPH1 links chromatin remodelling to DNA damage response. Nat Cell Biol 2009; 11:865-72; PMID:19525936; http://dx.doi.org/10.1038/ncb1895.
- Carey M, Smale ST. Micrococcal Nuclease-Southern Blot Assay: I. MNase and Restriction Digestions. CSH Protocols 2007; 2007:pdb prot4890.