
ABSTRACT
Alterations in O-GlcNAc cycling, the addition and removal of O-GlcNAc, lead to mitotic defects and increased aneuploidy. Herein, we generated stable O-GlcNAcase (OGA, the enzyme that removes O-GlcNAc) knockdown HeLa cell lines and characterized the effect of the reduction in OGA activity on cell cycle progression. After release from G1/S, the OGA knockdown cells progressed normally through S phase but demonstrated mitotic exit defects. Cyclin A was increased in the knockdown cells while Cyclin B and D expression was reduced. Retinoblastoma protein (RB) phosphorylation was also increased in the knockdown compared to control. At M phase, the knockdown cells showed more compact spindle chromatids than control cells and had a greater percentage of cells with multipolar spindles. Furthermore, the timing of the inhibitory tyrosine phosphorylation of Cyclin Dependent Kinase 1 (CDK1) was altered in the OGA knockdown cells. Although expression and localization of the chromosomal passenger protein complex (CPC) was unchanged, histone H3 threonine 3 phosphorylation was decreased in one of the OGA knockdown cell lines. The Ewing Sarcoma Breakpoint Region 1 Protein (EWS) participates in organizing the CPC at the spindle and is a known substrate for O-GlcNAc transferase (OGT, the enzyme that adds O-GlcNAc). EWS O-GlcNAcylation was significantly increased in the OGA knockdown cells promoting uneven localization of the mitotic midzone. Our data suggests that O-GlcNAc cycling is an essential mechanism for proper mitotic signaling and spindle formation, and alterations in the rate of O-GlcNAc cycling produces aberrant spindles and promotes aneuploidy.
Introduction
O-GlcNAc is a single N-acetyl-glucosamine moiety linked via an oxygen residue to serine and threonine amino acids in nuclear, cytoplasmic, and mitochondrial proteins.Citation1 The modification is ubiquitously expressed in all metazoans and is essential for proper growth and development.Citation2 Two unique enzymes add or remove the modification on proteins. O-GlcNAc transferase (OGT) catalyzes the addition of N-acetyl-glucosamine to the hydroxyl group of serine and threonine residues while O-GlcNAcase catalyzes the removal of the modification.Citation2 O-GlcNAc cycling is the combined addition and removal of the modification. Dynamic cycling of O-GlcNAc is necessary for normal development, and cycling defects are implicated in metabolic syndromes such as diabetes, cancer, and neurodegeneration.Citation3-7 Importantly, O-GlcNAc cycling defects have profound consequences for cell cycle progression.Citation8
Early studies in Xenopus oocytes demonstrated important roles for O-GlcNAc during progesterone mediated maturation. Microinjection of galactosyltransferase an enzyme that caps terminal N-acetyl-glucosamine preventing OGA removal of the sugar moiety induces maturation defects causing mitotic checkpoint activation and cell death.Citation9 Oocytes treated with OGA inhibitor PUGNAc failed to mature properly,Citation10 while microinjection of GlcNAc impaired maturation and spindle formation.Citation11 Additionally, inhibition of OGT blocks the G2/M transition during maturation,Citation12 but microinjection of OGT promotes entry into M phase. Together, these data demonstrates that alterations to the rate of O-GlcNAc cycling alters the transition from G2 to M phase in oocytes.Citation13
O-GlcNAc cycling plays an essential role in the regulation of both mitosis and meiosis. For example, HeLa cervical cancer cells over-expressing OGT or OGA have delayed exit from M phase and increased aneuploidy.Citation14 Interestingly, OGT localizes to both the mitotic and meiotic spindle suggesting a critical role for O-GlcNAcylation at the spindle.Citation14-16 Numerous spindle and midbody associated proteins are modified by O-GlcNAc Citation17 suggesting that O-GlcNAcylation of spindle proteins is necessary for proper spindle development. The spindle seems especially sensitive to alterations in O-GlcNAc cycling. Over-expression of OGT/OGA leads to increased disorder of the spindle chromatids while OGA inhibition with Thiamet-G (TMG) produces smaller more compact spindle chromatids.Citation8 Interestingly, TMG treatment can partially rescue the disordered spindle phenotype in both OGT and OGA over-expressing cells arguing that cells maintain a certain homeostatic level of O-GlcNAc cycling at the spindle. Disruptions in O-GlcNAc cycling are likely having a pluripotent effect on spindle machinery. Increased O-GlcNAc cycling alters the phosphorylation of spindle proteins by mitotic kinases Aurora B and Polo Like Kinase 1.Citation17,18 Moreover, impaired O-GlcNAc cycling disrupts other post-translational modifications on spindle proteins besides phosphorylation such as methylation and acetylation.Citation17,19 Together, these data demonstrate the essential role for O-GlcNAcylation in regulating cell cycle progression and spindle formation. Importantly, these data demonstrate that maintaining a homeostatic level of O-GlcNAc cycling at the spindle is crucial for organizing the spindle architecture, maintaining the proper post-translational state of spindle proteins, and promoting proper segregation of the chromatids to the daughter cells.
Both OGT and OGA are essential genes, and a complete knockout of either gene would lead to senescence and cell death Citation20-22; therefore we generated OGA knockdowns cell lines with approximately 30% reduction in OGA activity. Now, we show that OGA knockdown cells have mitotic progression defects, altered spindle chromatid packing, and an increase in multipolar spindles. Furthermore, OGA knockdown cells displayed altered inhibitory phosphorylation on CDK1 (Y-15), which is required for inactivation of the Cyclin B/CDK1 complex.Citation23 Reduced OGA expression increased O-GlcNAcylation of EWS (Ewing Sarcoma Breakpoint Region 1 Protein), mislocalization of EWS at the spindle, and misalignment of the spindle midzone. These data demonstrate the importance of OGA for the proper progression and fidelity of mitosis, and suggest that O-GlcNAc cycling is an essential process regulating mammalian mitosis.
Results
Stable knockdown of OGA causes cell cycle progression defects
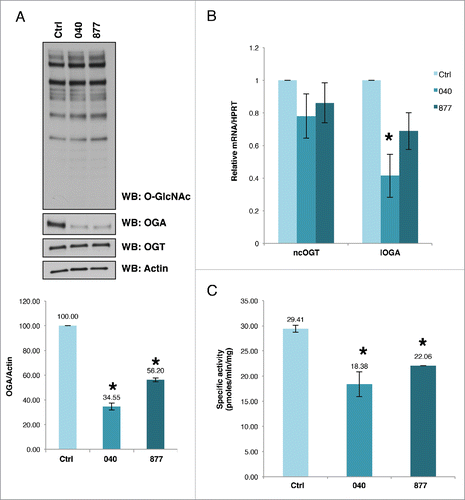
In order to understand the role of OGA activity on the cell cycle, we made stable OGA knockdown HeLa cells producing either GFP (control) or OGA (lines 040 and 877) knockdowns. The OGA knockdown (KD) cells 040 and 877 had approximately 30% reduction in the protein expression of OGA compared to control (). Total cellular O-GlcNAc levels are not significantly affected by the reduction in OGA expression (). Often a large expression change in OGT or OGA leads to concomitant change of the other O-GlcNAc cycling enzyme.Citation24 However, we do not see a significant reduction in OGT protein levels (). Both 040 and 877 cells had reduced mRNA expression of the more common long form splice variant of OGA in these cells (), while total OGA enzymatic activity was significantly reduced in these cells compared to control ().
Figure 1. OGA expression is reduced in cell lines 040 and 877. (A) Stable shRNA mediated OGA knockdown HeLa cells lines were established with a significant decrease in OGA protein expression as judged by western blot and quantified by densitometry. OGT protein expression was not significantly changed while total O-GlcNAc levels did increased slightly. (B) OGA mRNA is lower in both the 040 and 877 knockdown lines. C, OGA enzymatic activity was significantly decreased in the stable OGA KD lines compared to the control cells. All experiments were performed with at least 3 biological replicates (* indicates P < 0.05, Student t-test).
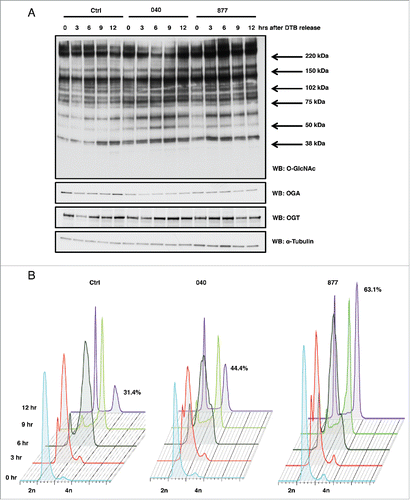
Next, HeLa cells were synchronized in G1/S phaseCitation14 and then released into S phase in which we then harvested time points every three hours up to 12 hours. Both the OGA 040 and 877 lines had increased O-GlcNAcylation and reduced OGA expression compared to control as judged by western blotting (). Released cells were also harvested for cell cycle stage analysis by flow cytometry. Control and both OGA 040 and 877 cells moved through S phase at the same rate as control; however, both 040 and 877 cells displayed higher incidence of delayed M phase progression compared to the control cells (). These OGA KD cells had prolonged M phase escape corroborating previous finding demonstrating that overexpression of OGT or OGA also cause mitotic exit defects.Citation14
Figure 2. OGA KD cell lines show mitotic exit defects. (A) HeLa OGA KD and control cells were synchronized into G1/S by double thymidine block and released. Time points were harvested every 3 hours post-release, and protein gel blots for total O-GlcNAc, OGT, and OGA were performed while α-tubulin was used as a load control. (B) Control and OGA KD cells were again synchronized by double thymidine block and released into S phase. Cells were fixed every 3 hours, and DNA content was measured by flow cytometry. Twelve hours post-release 44% of OGA 040 cells and 63% of OGA 877 cells were still in mitosis compared to 31% of cells in the control sample. All experiments were performed with at least 3 biological replicates.
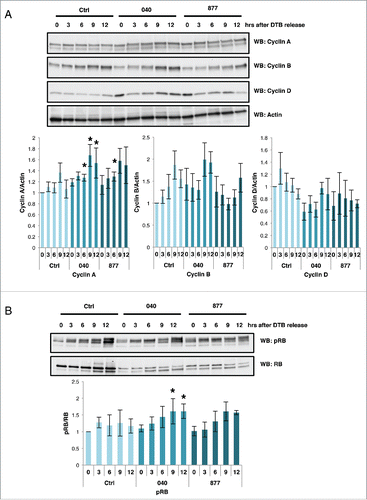
Subsequently, we again released cells from G1/S phase and probed time points for the expression of Cyclins and phosphorylation of G1/S phase checkpoint protein RB. Cyclin A had prolonged expression patterns in the OGA KD cells suggesting defects in G2/M progression, while Cyclin D expression was lower in the OGA KD cells suggesting less cells progressing though G1 phase (). Cyclin B expression was initially higher in the two knockdown cells but then decreased below control levels only to increase again at the 12 hour release point. Likely, Cyclin B protein levels are altered due to the defects in mitotic progression. These results confirm that the OGA KD cells are progressing slower through M phase. The phosphorylation of G1/S checkpoint point protein RB was also higher in these cells compared to control () demonstrating a higher percentage of OGA knockdown cells in S or M phase. These findings are consistent with previous data obtained from over-expressed OGT and OGA cells.Citation14
Figure 3. Cyclin expressions are disrupted in OGA knockdown cells. Control and OGA KD cells were synchronized into G1/S by double thymidine block and released. Time points were harvested every 3 hours for western blot analysis. (A) In the OGA 040 and 877 cells, expression pattern of Cyclin A, B, and D are altered. Expression of actin was used as a load control. (B) phosphorylated RB and are RB protein gel blots were performed as in A. Graphs show normalized densitometric analysis for phosphorylation of RB, or Cyclin(s) A, B, or D protein expression. Signals were first normalized with actin then normalized with control at time-point 0 as indicated (n = 3–4; *, p < 0.05 versus control). Data are expressed as means ± SE. Ctrl = Control, 040 = OGA040, 877 = OGA877. Statistic analysis was performed between Ctrl group and 040 or 877 group at the different time-point accordingly. All experiments were performed with at least 3 biological replicates.
OGA knockdown shortens spindle chromatids and increases multi-polar spindles
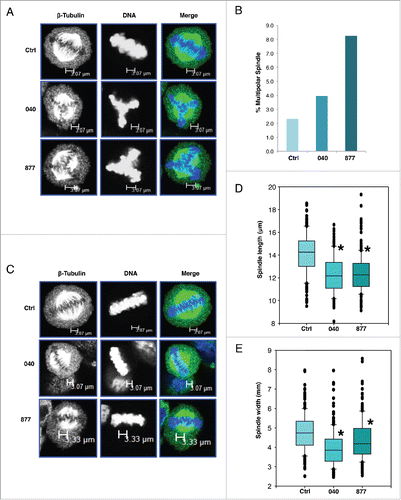
Previously, we demonstrated that over-expression of OGT or OGA caused defects in spindle formation.Citation8 In these cells, spindles were elongated and poorly condensed. The spindle defects caused by OGT and OGA overexpression increased the population of aneuploid cells.Citation14 In order to determine if OGA knockdown cells produced defective spindles and increased aneuploidy, we stained OGA knockdown and control cells for β-tubulin and DNA and counted the number of cells with aberrant spindles or were multinucleated (). Both OGA KD cell lines had an increased in multipolar spindles compared to control (). These data corroborate previous experiments performed in colorectal carcinoma cells in which OGA knockdown caused an increase in polyploidy.Citation25 Next, we measured the length and width of the condensed DNA in metaphase spindles. Both OGA 040 and 877 showed a significant reduction in the length and width of the condensed chromatid DNA compared to control cells (). Interestingly, these results are opposite to OGT and OGA over-expression studies and are more similar to cells treated with Thiamet-G (TMG), a selective OGA inhibitor suggesting that reduced O-GlcNAc cycling either caused by OGA inhibition or OGA KD produces shorter, more condensed spindles.Citation8
Figure 4. Multipolar spindles and chromatid compaction are increased in OGA knockdown cells. (A) Cells were imaged for β-tubulin and DNA. For each cell line, 200 cells were counted and the percentage of cell with multipolar spindles was quantified. (B) Both 040 and 877 cell lines have an increased percentage of multipolar spindles compared to control cells. (C) Cells were again stained for β-tubulin and DNA, and cells without visible signs of multipolar spindles were used in the measurement of chromatid length and width. (D) For each cell line, 200 cells at metaphase-anaphase had their chromatid length measure using ImageJ. OGA knockdown cells had significantly shorter spindle chromatids than control. (E) For spindle chromatid width, samples were measured across the two ends and middle of the DNA and averaged. Both 040 and 877 OGA knockdown cells had significantly thinner spindle chromatids then control cells (* indicates P < 0.05, Student t-test).
OGA knockdowns influences mitotic signaling cascades
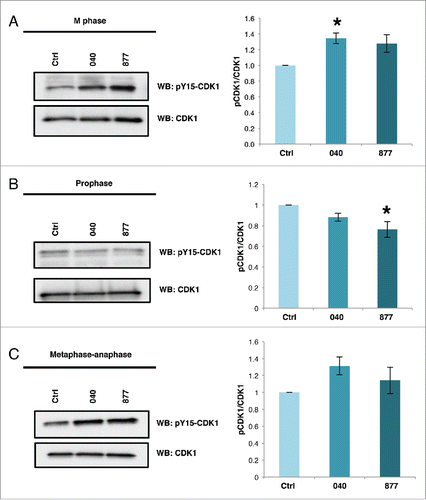
Alterations in mitotic O-GlcNAcylation increase the inhibitory phosphorylations on Cyclin Dependent Kinase 1 (CDK1) at threonine 14 (T14) and tyrosine 15 (Y15).Citation8,17 Phosphorylation at these sites inhibits CDK1 activity and links CDK1 activation to O-GlcNAc cycling. Therefore, we probed mitotic OGA KD cells for CDK1 Y15 phosphorylation and found that both OGA KD cell lines increased CDK1 Y15 phosphorylation with the change in OGA KD 040 being significant (). Interestingly, we did not see the increase in CDK1 Y15 phosphorylation in the OGA KD lines when cells were synchronized at prophase using nocodazole (). Importantly, inhibitory phosphorylation in the OGA KD cells was lower suggesting that the effect of OGA KD on CDK1 activation occurs later in M phase. Synchronization into metaphase-anaphase by thymidine release and treatment with kinesin inhibitor S-trityl-cysteine increased CDK1 inhibitory Y15 phosphorylation in both OGA KD cell lines ().
Figure 5. Inhibitory phosphorylation of tyrosine 15 of CDK1 is higher OGA KD cells. (A-C) Cells were synchronized into M phase by double thymidine block and harvested 9 hours post release (A), overnight treatment with nocodazole to synchronize cells into prophase (B), or treatment 6 post-release from double thymidine block with STC and harvested 14 hours post-release (C), Lysates were probed for phosphorylated Y15 CDK1 and total CDK1. Graphs show densitometry values of phosphorylation of CDK1 in OGA knockdown samples at the different stages of M phase. Signals were normalized first with CDK1 then followed by the control for each sample as indicated (n = 3; *, p < 0.05 vs. control). Data are presented as means ± SE. All experiments were performed with at least 3 biological replicates.
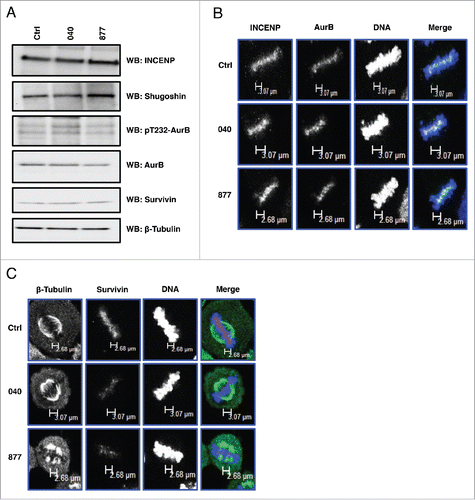
Spindle associated kinases like Aurora B kinase (AurB) interact with OGT and OGA at M phase,Citation17,18 and disruptions in O-GlcNAcylation affect the phosphorylation of AurB substrates such as vimentin and histones.Citation8,18 Therefore, we measured the expression of AurB and AurB interacting partners in double thymidine released control and OGA KD cells. As a result, there were no significant difference in the expression of AurB or AurB interacting partners INCENP, Survivin (part of the chromosomal passenger protein complex, CPC), and Shugoshin; nor did we see changes in AurB activating phosphorylation (). No change was seen in the localization of AurB, INCENP, or Survivin at the mitotic spindle (); however, there was reduced localization of Survivin at the spindle midzone ().
Figure 6. OGA knockdown had little effect on the expression or localization of the chromosomal passenger protein complex. (A) Protein expression of AurB and the other components of the CPC were unchanged in the OGA KD cells. (B) Localization of AurB and INCENP is unchanged in the OGA KD cells. (C) Localization of Survivin was reduced at the spindle midzone in the OGA KD cells. All experiments were performed with at least 3 biological replicates.
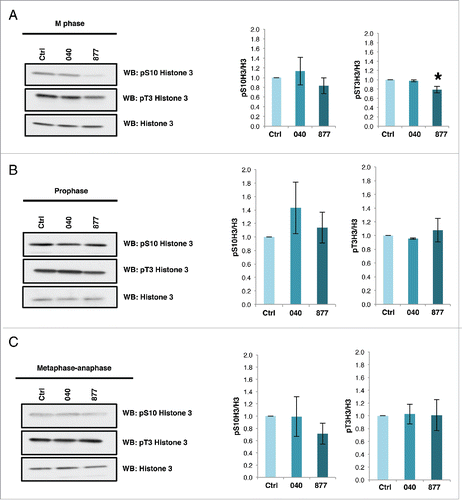
OGT and OGA overexpression reduces AurB phosphorylation of histone H3 serine 10.Citation8 When histone H3 serine 10 (pS10H3) and threonine 3 phosphorylation (pT3H3) were measured in cells synchronized at M phase, prophase, or metaphase-anaphase, there were no significant differences in histone phosphorylation in 040 cells. Whereas, there was a significant reduction pT3H3 in the OGA 877 KD cells synchronized into M phase ().
Figure 7. OGA 877 KD cells have reduced histone H3 phosphorylation. Cells were synchronized into M phase by double thymidine block and release (A), prophase by nocodazole treatment (B), or metaphase-anaphase with STC. (C) Histones were purified by acid extraction and phosphorylation of histone H3 Serine 10 and Threonine 3 was measured. H3 T3 phosphorylation was lower in the double thymidine block and released 877 cells. Graphs of normalized densitometric analysis for phosphorylation of S10H3 or T3H3 to total histone H3 (n = 3; *, p < 0.05 versus control). Data are expressed as means ± SE. All experiments were performed with at least 3 biological replicates.
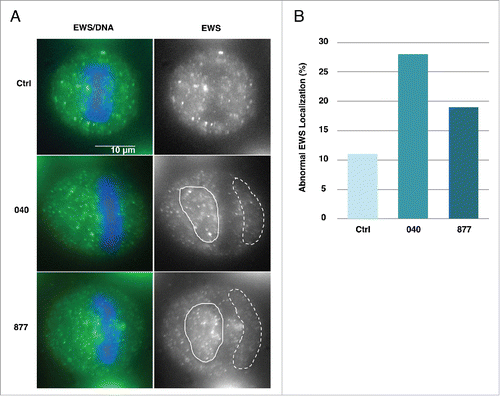
OGA knockdown increases mitotic O-GlcNAcylation of NuMA and EWS and disrupts EWS spindle localization
We next explored the O-GlcNAcylation status of two known O-GlcNAc modified proteins, NuMA (Nuclear Mitotic Apparatus Protein) and EWS (Ewing Sarcoma Breakpoint Region 1 Protein), in the OGA knockdown cells.Citation17,26 NuMA is a centrosome protein involved in organizing the centrosome to the cells cortex. We previously identified O-GlcNAc sites on NuMA and demonstrated that changes in OGT expression caused NuMA to localize to the cortex.Citation17,27 We immunoprecipitated NuMA from prophase extracts and measured the level of O-GlcNAcylation on the protein. O-GlcNAc on NuMA was significantly increased in the OGA KD cells compared to control (). These data demonstrate that reduced O-GlcNAc cycling increases O-GlcNAcylation on a spindle associated protein.
Figure 8. NuMA and EWS O-GlcNAcylation increases in OGA knockdown cells. (A-B) NuMA and EWS was precipitated from prophase extracts using specific antibodies to NuMA or EWS. Blots were then probed for O-GlcNAc using the RL-2 O-GlcNAc antibody. Both NuMA and EWS O-GlcNAcylation were increased in 040 and 877 OGA knockdown cells. All experiments were performed with at least 3 biological replicates.
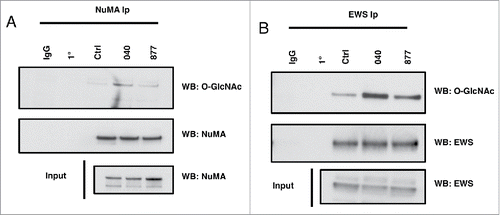
EWS is a RNA and DNA binding protein involved in numerous cellular functions; in particular, EWS helps recruits AurB to the spindle midzone during M phase.Citation28 Since previous report suggested that EWS is involved in organizing the spindle, we then measured O-GlcNAcylation and the localization of EWS to metaphase-anaphase spindles.Citation29 EWS O-GlcNAcylation was significantly increased on EWS in the OGA KD cells (). Next, to demonstrate whether the localization of EWS is affected in OGA KD cells, we performed immunocytochemistry using anti-EWS antibody. As a result, EWS was evenly distributed throughout the cytoplasm in metaphase control cells. However, spindle localization of EWS was no longer associating with the center of the dividing cell (). To address the frequency of mid-localization of EWS in OGA KD 040 and 877 cells, we scored three hundred metaphase cells. As a result, the aberrant distribution of EWS demonstrated that there are a higher percentage of cells with aberrant localization of EWS in both OGA KD 040 and 877 cells compared to control. This result suggests that normal level of O-GlcNAc cycling is required for proper localization of EWS during mitosis ().
Figure 9. EWS spindle localization is disrupted in OGA knockdown cells. (A) (Right) EWS visualized with an anti-EWS antibody. Area with clustered EWS signal is shown with white line. Area with sparse EWS signal is shown with dashed while line. (Left) merged images of DNA stained with DAPI (blue) and EWS (green) visualized with an anti-EWS antibody. (B) The percentage of cells with aberrant localization of EWS (n=300 metaphase cells, per sample).
Discussion
We generated two stable OGA knockdown cell lines in order to understand the effect of reduced O-GlcNAc removal on cell cycle progression and M phase dynamics. Both cell lines had an approximate 20–30% reduction in activity and protein expression (). When synchronized into G1/S and released, the KD cells show mitotic progression defects (), and the expression of Cyclins D, A, and B was disrupted in these cells (). At M phase, the inhibitory phosphorylation of CDK1 was also increased (). KD cells had more compact chromatids, misaligned spindles, and had higher incidence of anueploidy than control. Finally, EWS was mislocalized from the spindle (). Together, these data demonstrate the importance of O-GlcNAc cycling in regulating mitotic progression and spindle function.
Recently, several labs have generated OGA embryonic knockout mice.Citation21,30 The loss of OGA led to almost complete perinatal lethality in these animals with a variety of developmental defects.Citation21,30 OGA -/- MEF (mouse embryonic fibroblast) demonstrated reduced growth rates, failure to resume cell cycle progression after serum starvation-reactivation, and these cells had an increase in polyploidy.Citation21 Interestingly, OGA knockdowns in colorectal cancer cells also had an increase in polyploidy.Citation25 Our data corroborates the mitotic defects seen in either OGA knockout mice or knockdown cells. Clearly, OGA has an important role in maintaining the fidelity of mitotic progression. Since OGA 040 and 877 KD cells had tighter chromatid packing at the spindle midzone correlating with chromatid packing after OGA inhibition.Citation8 These data suggest that maintaining a homeostatic level of O-GlcNAc is necessary for chromatid packing at the midzone. Likely the rate of O-GlcNAc cycling is a regulatory mechanism for chromatid condensation.
Previously, we proposed that the rate of O-GlcNAc cycling was critical for proper mitotic progression.Citation8 We demonstrated that faster cycling caused by either over-expression of OGT or OGA led to large, unstructured chromatids at metaphase; however, pharmacological inhibition of OGA with Thiamet-G (TMG) produced tighter spindle chromatids, and treatment of OGT/OGA over-expressing cells with TMG, partially restored spindle chromatid compaction.Citation8 The OGA KD cell lines 040 and 877 phenocopied the TMG treated cells demonstrating more compact spindle chromatids. Treatment with TMG slows O-GlcNAc cycling by blocking the removal of O-GlcNAc and establishes a state of increased O-GlcNAcylation. OGA knockdown also reduces O-GlcNAc cycling and increased O-GlcNAcylation. We previously proposed that increased O-GlcNAcylation caused specifically by reduced O-GlcNAc cycling would promote protein-protein interactions, but these O-GlcNAc mediated protein complexes would not be fully functional until the O-GlcNAc was removed.Citation8 The reduced O-GlcNAc cycling rate of the OGA KD cells is potentially promoting increased protein-protein interactions at the spindle and causing the more compact chromatid structure. However, the more compact chromatid structure is not without consequence. The OGA KD cells have a higher rate of multipolar spindles () than the control cells leading to loss of chromatid segregation fidelity. These data support the argument that O-GlcNAc cycling rates are critical for proper spindle development and function, and alterations in O-GlcNAc cycling will reduce segregation fidelity and promote aneuploidy.
Since O-GlcNAc affects numerous cellular pathways, the chromatid spindle phenotype is likely due to numerous factors. However, we did demonstrate increased EWS O-GlcNAcylation and mislocalization at the spindle (). EWS is a multi-functional protein that is localized at the spindle during metaphase and helps to target AurB to the spindle midzone. Although we saw no disruption in AurB midzone localization, we did measure an increase in midzone alignment errors. These data suggest that O-GlcNAcylation controls EWS spindle localization and potentially EWS spindle function. Because we cannot entirely exclude the possibility of O-GlcNAcylation of other unknown protein impairing the AurB alignment, future studies are required to identify the causal mechanisms of this phenotype.
Importantly, disruption in the rate of O-GlcNAc cycling either by overexpression of OGT/OGA, knockdown of OGA, or pharmacological inhibition of OGA modulates CDK1 inhibitory phosphorylation.Citation8,17 CDK1 is the master regulator of M phase entry and is regulated not just by Cyclin B expression but also by inhibitory and activating phosphorylations.Citation23 Due to the importance of CDK1 in initiating mitotic entry, CDK1 activation is likely tied to O-GlcNAc homeostasis. Alterations in O-GlcNAc homeostasis either through nutritional flux, stress, or disease development could signal to the cell to reduce CDK1 activity until cellular conditions improve. CDK1 is activated at G2 by binding to cyclin B, removal of inhibitory phosphorylations at threonine 14 and tyrosine 15 by the phosphatase Cdc25, and reduction in upstream Wee1 and MYT1 kinase activity.Citation31 Potentially, O-GlcNAc cycling regulates Cdc25c phosphatase activity toward CDK1 or Wee1/Myt1 activity. OGT and OGA interact with protein phosphatases as well as kinases at M phase suggesting that O-GlcNAc cycling can control mitotic signaling networks.Citation18 Interestingly, we did measure a decrease of CDK1 phosphorylation when OGA KD cells were synchronized into prophase (). Why OGA KD affects prophase differently than the rest of M phase is unclear. Previously, we reported that OGA inhibition also reduced CDK1 inhibitory phosphorylation at M phase.Citation8 Together, these results argue that reduced O-GlcNAc cycling during prophase either by OGA inhibition or OGA KD affects CDK1 phosphorylation. Investigation into how O-GlcNAc cycling can regulate Wee1/Myt1 or Cdc25c is unwarranted and would illuminate why reduced O-GlcNAc cycling affects CDK1 prophase phosphorylation.
In conclusion, these data demonstrate the key role of OGA function in promoting cell cycle progression and spindle fidelity. These data argue that in the case of mitotic progression the cycling rates of O-GlcNAc are more important for biological function than absolute stoichiometry of O-GlcNAc on proteins. Therefore, understanding the interactions of OGT and OGA with the mitotic machinery will provide new insight into the critical role for O-GlcNAc in controlling mammalian mitosis.
Materials and methods
Antibodies
Antibodies for immunoblotting: OGT (AL-34, rabbit) and OGA (345, chicken) antibodies were gracious gifts from the Laboratory of Gerald Hart in the Department of Biological Chemistry at the Johns Hopkins University School of Medicine. O-linked N-acetylglucosamine antibody [RL2] (ab2739), β-tubulin (ab6046), NuMA (ab36999), pY15-CDK1 (ab47594), CDK1 (ab18), INCENP (ab12183), Shugoshin (ab58023), Aurora B (ab2254), pS10-Histone H3 (ab5176), and pT3-Histone H3 (ab78351) were purchased from Abcam. Survivin (2802), Histone H3 (5192), and pAurora A (Thr288)/ pAurora B (Thr232) /pAurora C (Thr198) (D13A11) antibodies were purchased from Cell Signaling. Actin (A2066), pRB (SAB400109), RB (Ab-780), α-tubulin (T5168), Cyclin A (C4710), Cyclin B (C8831), Cyclin D (SAB4502602), and EWS (E4533) antibodies were purchased from Sigma. EWS (sc28327) antibody for protein gel blotting was purchased from Santa Cruz. Goat anti-rabbit IgG HRP (170–6515) and goat anti-mouse IgG HRP (170–6516) were purchased from Bio-Rad.
Cell culture and generation of OGA stable knockdown cells
HeLa cells were cultured in DMEM (D5796, Sigma) supplemented with 10% heat-inactivated fetal bovine serum (FBS, 100–106, Gemini) and 1% Penicillin-Streptomycin (P4333, Sigma) and incubated at 37°C, 5% CO2 in a 95% humidified incubator. Cell synchronization was performed as described previously.Citation8
Stable OGA knockdown cells lines were generated via electroporation. Briefly, two TRC lentiviral human OGA shRNA constructs 040 and 877 (RHS3979, Clone TRCN0000134040 and TRCN0000135877, Open Biosystem) and TRC lentiviral eGFP shRNA (RHS4459, Open Biosystem) were electroporated into HeLa cells by Ingenio Electroporation Solution (MIR 50114, Mirus) respectively according to manufacturer's instruction. HeLa cells were placed at 1 × 10⁶ cells/ml in 100 mm dish and incubated overnight. Next day, cells were trypsinized and resuspended in Ingenio Electroporation Solution at 3 × 10⁶ cells/ml. 250 μl of cell suspension were mixed with 5 μg of shRNA plasmid in a 0.4 cm electroporation cuvette (EC4, Midsci), and subjected to electroporation at voltage of 260 V and capacitance of 950 μF using exponential decay electroporator Gene Pulser Xcell Total System (1652660, Biorad). The cell mixture was immediately transferred to 2.5 ml of pre-warmed complete medium in a 6-well-plate and incubated for 48 hrs. After 48 hrs, puromycin (P8833, Sigma) was added to the medium at 1 mg/ml and continuously thereafter to generate the stable knock down cell lines.
Immunoprecipitation
Control or OGA knockdown HeLa cells were lysed on ice for 20 min in Nonidet P-40 (NP-40) Lysis Buffer (20 mM Tris-HCl, pH 7.4, 150 mM NaCl, 1 mM EDTA, 1 mM DTT, 40 mM GlcNAc, and 1% Nonidet P-40) supplemented with 1 mM PMSF, 1 mM sodium fluoride, 1 mM β-glycerol phosphate, and 1X protease inhibitor cocktail I (leupeptin 1 mg/ml, antipain 1 mg/ml, benzamidine 10 mg/ml and 0.1% aprotinin). For immune precipitations, 0.5 mg of cell lysates were incubated with 0.5 μg of antibody in 1 ml reaction volume overnight while rotating at 4°C. Next, approximately 20 μl Protein G Sepharose 4 Fast Flow (17-0618-01, GE) slurry was added into each reaction respectively, followed by end-to-end rotating at 4°C for 2 hrs. Beads were washed 3 × 1 ml NP-40 Lysis Buffer supplemented with NaCl to a final concentration of 0.5 M. Washed beads were mixed with 20 μL 2X protein solubility mixture (50 mM Tris-HCl, pH 6.8, 5 mM EDTA, 4% SDS, 25% sucrose, 2.5% β-mercaptoethanol, 0.04% Pyronin-Y). Cell lysates were also mixed with 4X protein solubility mixture as input. The beads and input were heated at 95°C for 2 min and subjected to immune blotting.Citation8
Immune blotting
SDS-PAGE was performed with 4–15% gradient Criterion TGX Precast Gels (567–1084, Bio-Rad) and separated at 140 V, followed by transfer to PVDF membrane (Immobilon, Millipore) at 0.4 Amps. Membranes were blocked with 3% BSA in TBST (25 mM Tris-HCl pH 7.6, 150 mM NaCl, 0.05 % Tween-20) at room temperature for 10 min, then incubated with primary antibody (1:1000) overnight at 4°C. Membranes were washed with TBST for 5 × 5 min and incubated with HRP- conjugated secondary for 1 hr at room temperature (1:10,000), then washed again with TBST and developed using chemiluminescent substrate (HyGlo E2400; Denville Scientific). Membranes were stripped in 200 mM glycine, pH 2.5 at room temperature for 1 hr prior to incubation with other primary antibodies. All immunoblotting results were repeated a minimum of three independent experiments.
Total RNA isolation and RT-PCR
A minimum of 2 × 10⁶ cells were resuspended in 1 mL TRI reagent solution (AM9738, Ambion) then incubated at room temperature for 5 min. Next, RNA was extracted using chloroform followed by a centrifugation. The upper phase containing RNA was collected and incubated with isopropanol. After centrifugation, precipitated RNA was washed once with 70% ethanol, air-dried and dissolved in nuclease free water.
1 μg of total RNA was mixed with iScript Reverse Transcription (RT) Supermix (170–8841, Bio-Rad). RNA was converted into cDNA using random primers and according to the manufacturer's instructions. Briefly, samples were incubated in a thermal cycler (Model 2720, Applied Biosystems) using the following protocol: priming 5 min at 25°C, RT 30 min at 42°C, and RT inactivation 5 min at 85°C. cDNA products were diluted with 100 μl of nuclease free water and analyzed by Qpcr.Citation24
qPCR assay
cDNA samples were analyzed by qPCR using SsoAdvanced Universal SYBR Green Supermix (172–5271, Bio-Rad) according to manufacturer's instruction. 2μl of cDNA samples, SYBR Green Supermix, nuclease-free water, and primers for OGA were mixed for a total reaction volume of 20 μl. OGA primers were TTCACTGAAGGCTAATGGCTCCCG and ATGTCACAGGCTCCGACCAAGT. Next, the mixture was loaded into a 96-well PCR plate (AVRT-LP, MIDSCI) and loaded into a CFX96 Touch Real-Time PCR Detection System (185–5195, Bio-Rad). The qPCR protocol was the following: polymerase activation and DNA denaturation 30 s at 95 °C, annealing/extension 5 s at 95 °C and 30 s at 60 °C, amplification with 40 cycles, and melt curve 65–95 °C with 0.5 °C increment 5 s/step.Citation24
OGA activity assay
Whole cell lysates (60ug/reaction) were mixed with OGA reaction buffer for a total of 200 μl volume per reaction. O-GlcNAcase activity was assayed with 10 μl of 500 mM sodium cacodylate, pH 6.4, 3% bovine serum albumin, and 2 μl of 100 mM p-Nitrophenyl-N-acetyl-β-D-glucosaminide (pNP-O-GlcNAc, as substrate) at 37 °C for a total of two hours. The reactions were stopped with 100 μl of 500 mM sodium carbonate every 30 min and the absorbance at 400 nm was measured after all the reactions were stopped. Specific activity was calculated as described previously.Citation32
Flow cytometry
Double thymidine block synchronized HeLa cells were released and harvested at different time points (0 hr, 3 hrs, 6 hrs, 9 hrs, and 12 hrs) by trypsin digestion. Cells were washed in PBS, pelleted, and then resuspended in 1 ml of ice-cold PBS and followed by fixing with ice-cold 70% ethanol. Samples were stored at −20 °C until further use. Fixed cells were washed with ice-cold PBS and resuspended in PBS containing 0.1% (v/v) NP-40, 1 mg/ml RNase A, and 0.2% (w/v) propidium iodide.Citation14 Subsequently, cell cycle stages of cells were acquired by FACSDiva software using a BD LSRII at the University of Kansas Medical Center Flow Cytometry Core Laboratory. Data were analyzed using FlowJo.
Histone purification
Histones were purified as described previously.Citation8 Briefly, cells were harvested and lysed followed by acid extraction of the histones. After histones were quantified by Bradford assay, 5 μg of histone extract was separated by SDS-PAGE and probed for either histone phosphorylation or total histone H3.
Immunofluorescence microscopy
Control or OGA KD cells were cultured on microscope slides and synchronized into G1/S by double thymidine block. 9 hours after G1/S release, cells were washed with 1X PBS fixation followed by fixation with 4% paraformaldehyde (158127, Sigma) for 20 min. Cells were permeabilized with 0.1% Triton X-100 (T8787, Sigma) in PBS for 20 min and washed with 1X PBS prior to blocking with a TBST blocking solution (0.2% azide, 0.2% powdered dry milk, 12% chicken serum, 1% bovine serum albumin, 100 mM glycine, 0.1% Triton X-100 in Tris buffer pH 7.5, all reagents from Sigma except dry milk, Sun Fresh Supermarket) for 1 hr.Citation8 Slides were incubated with primary antibody (1:200 to 1:1000 depending on antibody) in blocking buffer overnight. Slides were 5 × 5 min washed with TBST and then incubated with fluorescent secondary antibodies (1:1000, rabbit Alexa-fluor 488 nm A11008, mouse Alexa-fluor 488 nm A21202, rabbit Alexa-fluor 568 nm A10042, or mouse Alexa-fluor 568 nm A11004 Invitrogen) for 1 hr. Slides were again washed 5 × 5 min in TBST. Slides were then places in a DAPI solution (PBS, 0.01% Triton X-100, 0.001% DAPI, Sigma) for 20 min followed by 2 washes with PBS. Slides were mounted on cover slips using ProLong Gold Anti-fade (P36930, Invitrogen).Citation28
Image analysis
Image analysis was performed as previously described using ImageJ software (NIH).Citation8
Statistical analysis
Statistical significance for the qPCR, OGA activity and spindle midzone width and length were assessed via SPSS-Statistics software by performing Paired-Samples T Test.
Disclosure of potential conflicts of interest
The authors declare no conflict of interest. The content is solely the responsibility of the authors and does not necessarily represent the official views of the National Institutes of Health.
Author contributions
CL and ET performed the majority of experiments. ZZ created the OGA KD cell lines, MM and AB performed some experiments. MA performed imaging experiments with EWS. CS provided technical expertise and conceptual guidance. CS, MA, and ET wrote the paper. All authors have seen the results and approve of the manuscript.
Funding
An Institutional Development Award (IDeA) from the National Institute of Medical Science of the National Institutes for Health under grant P20GM104936 supported this research. Additionally, we would like to acknowledge the Flow Cytometry Core Laboratory, which is sponsored, in part, by the NIH/NIGMS COBRE grant P30GM103326. A National Institute of Diabetes and Digestive and Kidney Diseases R01DK100595 award to C. S., and a pilot award to M.A. and C.S. from National Cancer Center P30CA168524 also supported this research.
References
- Slawson C, Hart GW. O-GlcNAc signalling: implications for cancer cell biology. Nat Rev Cancer 2011; 11:678-84; PMID:21850036; http://dx.doi.org/10.1038/nrc3114
- Hart GW, Slawson C, Ramirez-Correa G, Lagerlof O. Cross talk between O-GlcNAcylation and phosphorylation: roles in signaling, transcription, and chronic disease. Annu Rev Biochem 2011; 80:825-58; PMID:21391816; http://dx.doi.org/10.1146/annurev-biochem-060608-102511
- Tan EP, Villar MT, E L, Lu J, Selfridge JE, Artigues A, Swerdlow RH, Slawson C. Altering O-linked β-N-Acetylglucosamine cycling disrupts mitochondrial function. J Biol Chem 2014; 289:14719-30; PMID:24713701; http://dx.doi.org/10.1074/jbc.M113.525790
- Ruan HB, Dietrich MO, Liu ZW, Zimmer MR, Li MD, Singh JP, Zhang K, Yin R, Wu J, Horvath TL, et al. O-GlcNAc Transferase Enables AgRP Neurons to Suppress Browning of White Fat. Cell 2014; 159:306-17; PMID:25303527; http://dx.doi.org/10.1016/j.cell.2014.09.010
- Yang X, Ongusaha PP, Miles PD, Havstad JC, Zhang F, So WV, Kudlow JE, Michell RH, Olefsky JM, Field SJ, et al. Phosphoinositide signalling links O-GlcNAc transferase to insulin resistance. Nature 2008; 451:964-9; PMID:18288188; http://dx.doi.org/10.1038/nature06668
- Whelan SA, Dias WB, Thiruneelakantapillai L, Lane MD, Hart GW. Regulation of insulin receptor substrate 1 (IRS-1)/AKT kinase-mediated insulin signaling by O-Linked β-N-acetylglucosamine in 3T3-L1 adipocytes. J Biol Chem 2010; 285:5204-11; PMID:20018868; http://dx.doi.org/10.1074/jbc.M109.077818
- Caldwell SA, Jackson SR, Shahriari KS, Lynch TP, Sethi G, Walker S, Vosseller K, Reginato MJ. Nutrient sensor O-GlcNAc transferase regulates breast cancer tumorigenesis through targeting of the oncogenic transcription factor FoxM1. Oncogene 2010; 29:2831-42; PMID:20190804; http://dx.doi.org/10.1038/onc.2010.41
- Tan EP, Caro S, Potnis A, Lanza C, Slawson C. O-linked N-acetylglucosamine cycling regulates mitotic spindle organization. J Biol Chem 2013; 288:27085-99; PMID:23946484; http://dx.doi.org/10.1074/jbc.M113.470187
- Fang B, Miller MW. Use of galactosyltransferase to assess the biological function of O-linked N-acetyl-d-glucosamine: a potential role for O-GlcNAc during cell division. Exp Cell Res 2001; 263:243-53; PMID:11161723; http://dx.doi.org/10.1006/excr.2000.5110
- Slawson C, Shafii S, Amburgey J, Potter R. Characterization of the O-GlcNAc protein modification in Xenopus laevis oocyte during oogenesis and progesterone-stimulated maturation. Biochim Biophys Acta 2002; 1573:121-9; PMID:12399021; http://dx.doi.org/10.1016/S0304-4165(02)00369-0
- Lefebvre T, Baert F, Bodart JF, Flament S, Michalski JC, Vilain JP. Modulation of O-GlcNAc glycosylation during Xenopus oocyte maturation. J Cell Biochem 2004; 93:999-1010; PMID:15389870; http://dx.doi.org/10.1002/jcb.20242
- Dehennaut V, Lefebvre T, Sellier C, Leroy Y, Gross B, Walker S, Cacan R, Michalski JC, Vilain JP, Bodart JF. O-linked N-acetylglucosaminyltransferase inhibition prevents G2/M transition in Xenopus laevis oocytes. J Biol Chem 2007; 282:12527-36; PMID:17329255; http://dx.doi.org/10.1074/jbc.M700444200
- Dehennaut V, Hanoulle X, Bodart JF, Vilain JP, Michalski JC, Landrieu I, Lippens G, Lefebvre T. Microinjection of recombinant O-GlcNAc transferase potentiates Xenopus oocytes M-phase entry. Biochem Biophys Res Commun 2008; 369:539-46; PMID:18298951; http://dx.doi.org/10.1016/j.bbrc.2008.02.063
- Slawson C, Zachara NE, Vosseller K, Cheung WD, Lane MD, Hart GW. Perturbations in O-linked β-N-acetylglucosamine protein modification cause severe defects in mitotic progression and cytokinesis. J Biol Chem 2005; 280:32944-56; PMID:16027160; http://dx.doi.org/10.1074/jbc.M503396200
- Dehennaut V, Slomianny MC, Page A, Vercoutter-Edouart AS, Jessus C, Michalski JC, Vilain JP, Bodart JF, Lefebvre T. Identification of structural and functional O-linked N-acetylglucosamine-bearing proteins in Xenopus laevis oocyte. Mol Cell Proteomics 2008; 7:2229-45; PMID:18617508; http://dx.doi.org/10.1074/mcp.M700494-MCP200
- Slawson C, Duncan FE. Sweet action: The dynamics of O-GlcNAcylation during meiosis in mouse oocytes. Mol Reprod Dev 2015; 82(12):915; PMID:26331270; http://dx.doi.org/10.1002/mrd.22577
- Wang Z, Udeshi ND, Slawson C, Compton PD, Sakabe K, Cheung WD, Shabanowitz J, Hunt DF, Hart GW. Extensive crosstalk between O-GlcNAcylation and phosphorylation regulates cytokinesis. Sci Signal 2010; 3:ra2; PMID:20068230
- Slawson C, Lakshmanan T, Knapp S, Hart GW. A mitotic GlcNAcylation/phosphorylation signaling complex alters the posttranslational state of the cytoskeletal protein vimentin. Mol Biol Cell 2008; 19:4130-40; PMID:18653473; http://dx.doi.org/10.1091/mbc.E07-11-1146
- Sakabe K, Hart GW. O-GlcNAc transferase regulates mitotic chromatin dynamics. J Biol Chem 2010; 285:34460-8; PMID:20805223; http://dx.doi.org/10.1074/jbc.M110.158170
- Shafi R, Iyer SP, Ellies LG, O'Donnell N, Marek KW, Chui D, Hart GW, Marth JD. The O-GlcNAc transferase gene resides on the X chromosome and is essential for embryonic stem cell viability and mouse ontogeny. Proc Natl Acad Sci U S A 2000; 97:5735-9; PMID:10801981; http://dx.doi.org/10.1073/pnas.100471497
- Yang YR, Song M, Lee H, Jeon Y, Choi EJ, Jang HJ, Moon HY, Byun HY, Kim EK, Kim DH, et al. O-GlcNAcase is essential for embryonic development and maintenance of genomic stability. Aging Cell 2012; 11:439-48; PMID:22314054; http://dx.doi.org/10.1111/j.1474-9726.2012.00801.x
- Wang T, Birsoy K, Hughes NW, Krupczak KM, Post Y, Wei JJ, Lander ES, Sabatini DM. Identification and characterization of essential genes in the human genome. Science 2015; 350:1096-101; PMID:26472758; http://dx.doi.org/10.1126/science.aac7041
- Fisher D, Krasinska L, Coudreuse D, Novak B. Phosphorylation network dynamics in the control of cell cycle transitions. J Cell Sci 2012; 125:4703-11; PMID:23223895; http://dx.doi.org/10.1242/jcs.106351
- Zhang Z, Tan EP, VandenHull NJ, Peterson KR, Slawson C. O-GlcNAcase Expression is Sensitive to Changes in O-GlcNAc Homeostasis. Front Endocrinol (Lausanne) 2014; 5:206; PMID:25520704
- Yehezkel G, Cohen L, Kliger A, Manor E, Khalaila I. O-linked β-N-acetylglucosaminylation (O-GlcNAcylation) in primary and metastatic colorectal cancer clones and effect of N-acetyl-β-D-glucosaminidase silencing on cell phenotype and transcriptome. J Biol Chem 2012; 287:28755-69; PMID:22730328; http://dx.doi.org/10.1074/jbc.M112.345546
- Li Q, Kamemura K. Adipogenesis stimulates the nuclear localization of EWS with an increase in its O-GlcNAc glycosylation in 3T3-L1 cells. Biochem Biophys Res Commun 2014; 450:588-92; PMID:24928395; http://dx.doi.org/10.1016/j.bbrc.2014.06.013
- Silk AD, Holland AJ, Cleveland DW. Requirements for NuMA in maintenance and establishment of mammalian spindle poles. J Cell Biol 2009; 184:677-90; PMID:19255246; http://dx.doi.org/10.1083/jcb.200810091
- Park H, Turkalo TK, Nelson K, Folmsbee SS, Robb C, Roper B, Azuma M. Ewing sarcoma EWS protein regulates midzone formation by recruiting Aurora B kinase to the midzone. Cell Cycle 2014; 13:2391-9; PMID:25483190; http://dx.doi.org/10.4161/cc.29337
- Azuma M, Embree LJ, Sabaawy H, Hickstein DD. Ewing sarcoma protein ewsr1 maintains mitotic integrity and proneural cell survival in the zebrafish embryo. PLoS One 2007; 2:e979; PMID:17912356; http://dx.doi.org/10.1371/journal.pone.0000979
- Keembiyehetty C, Love DC, Harwood KR, Gavrilova O, Comly ME, Hanover JA. Conditional knockout reveals a requirement for O-GlcNAcase in metabolic homeostasis. J Biol Chem 2015; 290(11):7097-113; PMID:25596529; http://dx.doi.org/10.1074/jbc.M114.617779
- Satyanarayana A, Kaldis P. Mammalian cell-cycle regulation: several Cdks, numerous cyclins and diverse compensatory mechanisms. Oncogene 2009; 28:2925-39; PMID:19561645; http://dx.doi.org/10.1038/onc.2009.170
- Butkinaree C, Cheung WD, Park S, Park K, Barber M, Hart GW. Characterization of β-N-acetylglucosaminidase cleavage by caspase-3 during apoptosis. J Biol Chem 2008; 283:23557-66; PMID:18586680; http://dx.doi.org/10.1074/jbc.M804116200