ABSTRACT
G0/G1 switch gene 2 (G0S2) is a direct retinoic acid target implicated in cancer biology and therapy based on frequent methylation-mediated silencing in diverse solid tumors. We recently reported that low G0S2 expression in breast cancer, particularly estrogen receptor-positive (ER+) breast cancer, correlates with increased rates of recurrence, indicating that G0S2 plays a role in breast cancer progression. However, the function(s) and mechanism(s) of G0S2 tumor suppression remain unclear. In order to determine potential mechanisms of G0S2 anti-oncogenic activity, we performed genome-wide expression analysis that revealed an enrichment of gene signatures related to PI3K/mTOR pathway activation in G0S2 null cells as compared to G0S2 wild-type cells. G0S2 null cells also exhibited a dramatic decreased sensitivity to PI3K/mTOR pathway inhibitors. Conversely, restoring G0S2 expression in human ER+ breast cancer cells decreased basal mTOR signaling and sensitized the cells to pharmacologic mTOR pathway inhibitors. Notably, we provide evidence here that the increase in recurrence seen with low G0S2 expression is especially prominent in patients who have undergone antiestrogen therapy. Further, ER+ breast cancer cells with restored G0S2 expression had a relative increased sensitivity to tamoxifen. These findings reveal that in breast cancer G0S2 functions as a tumor suppressor in part by repressing PI3K/mTOR activity, and that G0S2 enhances therapeutic responses to PI3K/mTOR inhibitors. Recent studies implicate hyperactivation of PI3K/mTOR signaling as promoting resistance to antiestrogen therapies in ER+ breast cancer. Our data establishes G0S2 as opposing this form of antiestrogen resistance. This promotes further investigation of the role of G0S2 as an antineoplastic breast cancer target and a biomarker for recurrence and therapy response.
Introduction
Breast cancer is the most commonly diagnosed cancer and is the second highest cause of cancer death in women.Citation1 Clinically-defined breast cancer subtypes are based on expression of the estrogen receptor (ER) and the progesterone receptor (PR), and amplification/overexpression of HER2.Citation2 Breast cancers are also classified based on gene expression into luminal A, luminal B, HER2-enriched, basal-like, claudin-low and normal-like subtypes.Citation3,Citation4 ER-positive (ER+) breast tumors tend to be of the luminal A and B subtypes while triple negative tumors (negative for ER, PR and HER2) tend to be of the basal or claudin-low subtypes.Citation3,Citation4 More than two-thirds of breast cancers are ER+. These patients typically receive post-surgery antiestrogen-based adjuvant therapy for 5 years, typically involving tamoxifen or an aromatase inhibitor. However, 20% of ER+ patients recur with advanced/metastatic disease that is usually antiestrogen therapy resistant and commonly fatal.Citation5,Citation6 There is a need to better predict which patients will do well without adjuvant treatment, benefit from adjuvant treatment, or respond poorly to adjuvant therapy to minimize overtreatment as well as to abandon non-curative therapies for alternative ones. In order to uncover new, alternative targeted therapies to treat this disease population, it is vital to further understand the mechanisms of recurrence.
Candidate biomarker and gene expression signature analyses have revealed the importance of alternative proliferative and survival pathways in ER+ breast cancer cells that adapt to estrogen deprivation.Citation7,Citation8 In particular, hyperactivation of the phosphatidylinositol 3-kinase (PI3K)/AKT/mechanistic target of rapamycin (mTOR) pathway was shown to promote escape from hormone dependence in preclinical models and ER+human breast tumors.Citation9−12 In addition, alterations in genes encoding this pathway are frequently found in ER+ breast cancer, promoting tumor growth and progression.Citation12,Citation13 Inhibition of the PI3K/AKT/mTOR pathway, potentially in combination with antiestrogen therapy, presents a promising option for treating ER+ breast cancer, re-sensitizing tumors to antiestrogen therapy, and/or preventing the occurrence of resistance.Citation12,Citation14 However, biomarkers that predict sensitivity to PI3K/AKT/mTOR pathway inhibitors in ER+ breast cancer patients remain largely undefined and require identification and validation. It is critical to identify patient populations that would benefit from this treatment approach.
G0/G1 switch gene 2 (G0S2) is implicated in the regulation of diverse biological processes and is silenced by DNA promoter methylation in diverse tumors.Citation15 G0S2 only exists in vertebrates and is highly conserved but lacks homology with well-characterized proteins. Recent studies support a role for G0S2 in fat homeostasis due to direct inhibition of adipose triglyceride lipase (ATGL).Citation16 We and others have shown that G0S2 null mice have alterations in adiposity, energy balance and thermogenesis.Citation17,Citation18 However, G0S2 is also silenced by gene promoter methylation in a variety of solid tumors and is associated with terminal differentiation, cell cycle withdrawal, quiescence and apoptosis.Citation19−24 Prior published work uncovered that G0S2 is a direct retinoic acid target gene associated with retinoic acid-mediated clinical remissions in acute promyelocytic leukemia.Citation25 In our recent published work utilizing G0S2 null murine embryonic fibroblasts (MEFs), we demonstrated that G0S2 has properties of a classical tumor suppressor to antagonize oncogene-induced transformation.Citation26 G0S2 null MEFs have greatly increased susceptibility to undergo transformation with mutated HRAS (V12) or EGFR. G0S2 suppression of oncogenic transformation was associated with repression of a MYC-regulated transcriptional program independent of ATGL.Citation26 These data implicate G0S2 as a barrier to transformation.
In addition, we recently reported that G0S2 is frequently repressed in human breast cancer and that this repression correlates with increased rates of recurrence, especially ER+ breast cancer.Citation26 However, the function(s) and mechanism(s) of G0S2 tumor suppression in breast cancer remained largely unknown. In the current study, we unexpectedly discovered that G0S2 loss results in enhanced gene expression signatures related to the PI3K/mTOR pathway. G0S2 null cells exhibited decreased sensitivity to PI3K/mTOR pathway inhibitors. Notably, restoring expression of G0S2 in human ER+ breast cancer cells decreased cell proliferation and basal mTOR signaling, and sensitized these cells to pharmacologic mTOR pathway inhibitors and to tamoxifen. Likewise, increased recurrence rates in G0S2 low-expressing breast cancers are evident in patients who have undergone antiestrogen therapy. Together, our new findings support the importance of PI3K/AKT/mTOR pathway inhibition in mediating tumor suppressive effects of G0S2 in breast cancer. Furthermore, these findings implicate a role for G0S2 as a predictive marker of recurrence and PI3K/mTOR-targeted therapy in breast cancer patients.
Results
G0S2 null cells upregulate gene signatures associated with PI3K/mTOR signaling
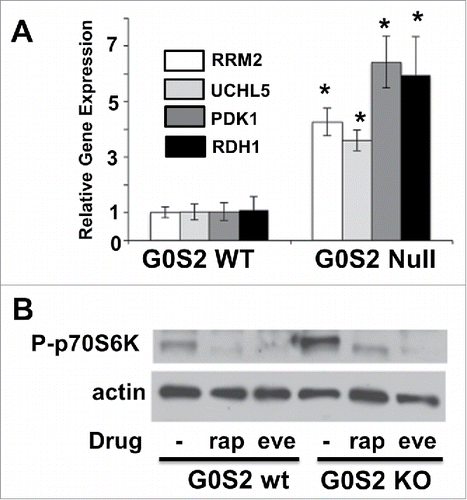
In previous microarray-based gene expression analysis of G0S2 null MEFs, we reported gene set enrichment analysis (GSEA) indicating an enrichment of genes sets corresponding to transformation, proliferation and MYC transcriptional responses.Citation26 However, the Molecular Signatures Database (MSigDB) has recently incorporated a new collection of “HALLMARKS” gene sets that are computationally designed to produce robust enrichment analysis by providing refined inputs representing distinct biological processes with reduced variation and redundancy within and between gene sets.Citation27 Performing GSEA with the HALLMARKS collection confirmed increased MYC-regulated transcriptional activity in G0S2 null cells as indicated by high enrichment of Hallmarks related to MYC and E2F targets (). Intriguingly, G0S2 null cells also exhibited upregulation of gene sets corresponding to PI3K/mTOR signaling, one of the most frequently deregulated pathways in human breast cancerCitation28 (). Further focused analysis of the GSEA database revealed that genes that are sensitive to PI3K and mTOR inhibition due to amino acid deprivation or pharmacologic inhibition were also enriched in G0S2 null cells, further indicating that G0S2 represses PI3K/mTOR as well as MYC signaling pathwaysCitation29 (). Consistently, genes from these activated PI3K/mTOR signatures were confirmed to be enhanced in G0S2-null cells in independent samples (). G0S2 null cells also have increased basal mTOR activity as indicated by increased levels of phosphorylated p70S6K, which is a direct target of mTOR (). Collectively, these analyses reveal a novel association exists between G0S2 and PI3K/mTOR signaling where G0S2 deletion upregulates this pro-proliferative pathway in addition to the MYC transcriptional pathway.
Figure 1. G0S2 null cells have upregulated gene signatures associated with PI3K/mTOR activation. A, Gene Set Enrichment Analysis (GSEA) of gene expression profiles of G0S2 null MEFs and wild-type MEFs in biological triplicate. G0S2 null cells are enriched for gene signatures associated with MYC activation and PI3K/mTOR signaling. B, Representative gene set enrichment plots. NES, normalized enrichment score.
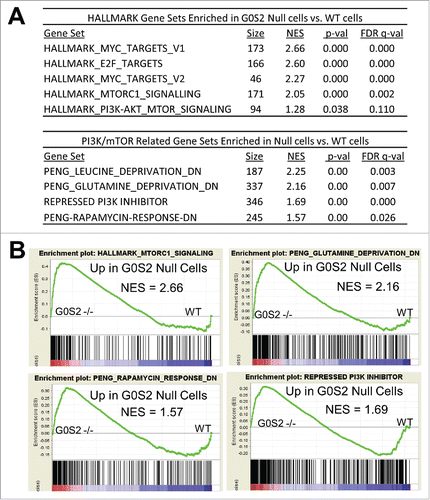
Figure 2. G0S2 null cells have enhanced basal mTOR signaling. A, Real-time PCR of select mTOR targets (from HALLMARK_MTORC1_SIGNALING) in G0S2 null cells as compared with wild-type cells. Samples were independent from those used in microarray analysis. Bars are the average of biological triplicates and the error bars are SD. *, P < 0.05. Experiment was repeated with similar results. B, G0S2 null cells have increased levels of the mTOR downstream effector, phospho-p70S6K. G0S2 wild-type and G0S2 null cells were treated with vehicle control, 20 nM rapamycin (rap) or 20 nM everolimus (eve) for 24 hours before cells were harvested for Western analysis with anti-P-p70S6K antibody. Experiment was repeated twice with similar results.
G0S2 null cells exhibit decreased sensitivity to PI3K and mTOR inhibitors
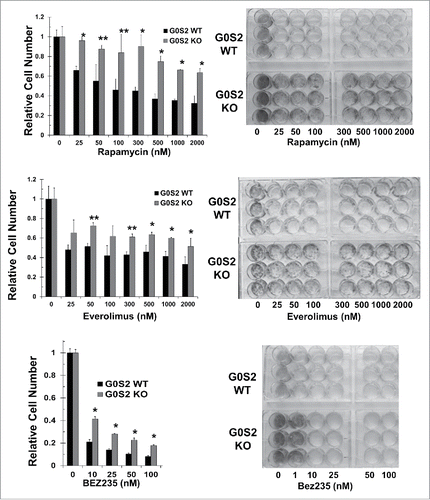
Basal activation of PI3K/mTOR signaling in G0S2 null cells prompted us to investigate whether G0S2 status influenced a response to PI3K and mTOR inhibitors. Upregulation of PI3K/mTOR signaling in G0S2 null cells was associated with a substantial degree of resistance to the mTOR inhibitors rapamycin and everolimus and the dual PI3K/mTOR inhibitor BEZ235 (). G0S2 null cells exhibited marked resistance to rapamycin even at high concentrations while G0S2 wild-type cells demonstrated a concentration-dependent inhibition of proliferation as assessed by both short-term and long-term clonogenic assays (). G0S2 null cells were also significantly less sensitive to everolimus and BEZ235 as compared to wild-type cells (). These results indicate that the upregulation of PI3K/mTOR signaling in G0S2 null cells is associated with decreased sensitivity to pharmacological inhibitors targeting the PI3K/mTOR pathway.
Figure 3. G0S2 null cells exhibit decreased sensitivity to inhibitors of PI3K/mTOR signaling as compared with wild-type cells. Wild-type and G0S2 null MEFs were treated with the mTOR inhibitors rapamycin and everolimus and the dual PI3K/mTOR inhibitor, BEZ235. Left, Cell proliferation was assessed by CellTiter-Glo assay after 72 hours of drug treatment. Data points are the average of biological triplicates. Error bars, SD. *, P < 0.05; **, P < 0.01. Right, representative long-term clonogenic assay. Cells were stained 9 to 11 days after initial drug treatment. Experiments were repeated three times with similar results.
G0S2 expression is associated with repression of basal mTOR signaling in human breast cancer cells and increased sensitivity to PI3K and mTOR inhibitors
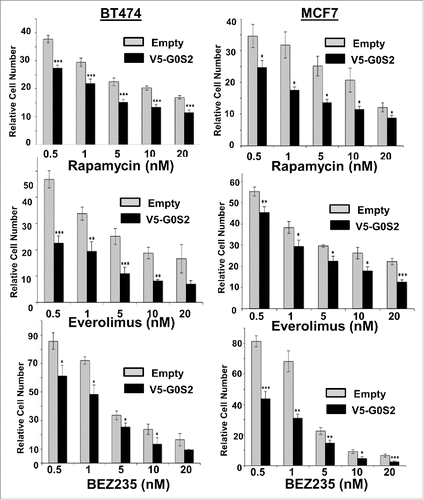
Since the PI3K/mTOR pathway is important in breast cancer biology, we assessed whether G0S2 could alter these pathways in human breast cancer cells. G0S2 is expressed at low levels in most human ER+ breast cancer cells including BT474, MCF7 and T47D cells.Citation26,Citation30,Citation31 G0S2 overexpression substantially suppressed mTOR signaling in ER+ BT474 cells, MCF7 and T47D cells as indicated by decreased P-p70S6K levels ( and Fig. S1). Consistent with our prior report, G0S2 overexpression resulted in decreased cell proliferation of BT474, MCF7 and T47D cells (see Citationref. 26 and not shown). We next investigated whether breast cancer cells stably overexpressing G0S2 would be more sensitive to the pharmacologic inhibition of PI3K/mTOR signaling. Engineered G0S2 overexpression in BT474, MCF7 and T47D increased sensitivity to rapamycin, everolimus and BEZ235, as indicated by significantly reduced proliferation ( and Supplementary Fig. S2). It should be noted that in both MEFs and breast cancer cell lines in both long and short term assays there was no evidence of apoptotic or floating cells and viable cell counting with trypan-blue confirmed that the major effects of PI3K and mTOR inhibitors was a decrease in cell proliferation. In addition, there was an enhancement in cell size reduction of G0S2 expressing BT474, MCF7 and T47D breast cancer cells treated with mTOR inhibitors compared to similarly treated control cells (not shown). Taken together, these data support a key role for G0S2 in modulating sensitivity to PI3K and mTOR inhibitors in ER+breast cancer cells, indicating a likely role for G0S2 as a biomarker predictive of drug response.
Figure 4. G0S2 overexpression represses basal mTOR signaling in ER+ breast cancer cell lines. Engineered overexpression of G0S2 in BT474, MCF7 and T47D cells results in decreased basal mTOR signaling as indicated by decreased levels of P-p70S6K as compared with empty vector control cells. Each immunoblot blot represents independent lysates harvested from newly generated stable cell lines.
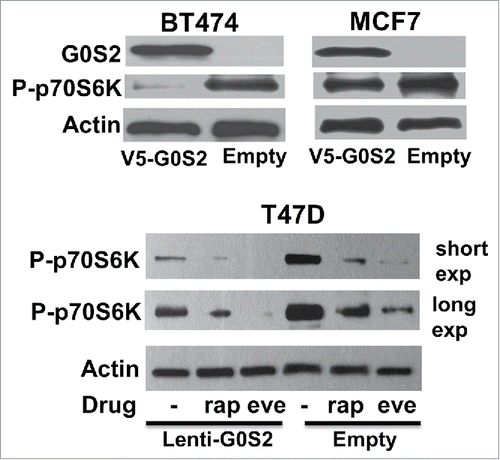
Figure 5. G0S2 overexpression increases sensitivity of breast cancer cells to pharmacological inhibitors targeting the PI3K/mTOR pathway. BT474 and MCF7 cells stably expressing V5-tagged G0S2 or empty-vector control were treated with rapamycin, everolimus or BEZ235 for 7 to 10 days and assessed for changes in cell proliferation as compared to vehicles. Experiments were repeated three times using independently generated stable cell lines, and similar results were obtained. Data points are biological triplicates. Error bars, SD. *, P < 0.05; **, P < 0.01; ***, P < 0.005. Similar results were seen with engineered T47D cells (Figure S2).
G0S2 expression is associated with reduced recurrence after antiestrogen therapy and enhanced tamoxifen suppression in breast cancer cells
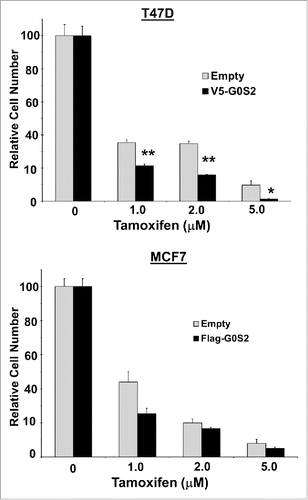
Prior in silico analysis revealed that of all tumor types, G0S2 is most prominently repressed in human breast cancer and that primary tumors with high G0S2 expression had a lower rate of clinical recurrence compared to those with low levels of G0S2.Citation26 Notably, the association between high G0S2 and low breast cancer recurrence was mainly in ER+ breast cancer patients. To further probe the clinical relevance of G0S2 expression in breast cancer, we utilized the SurvExpress web resource to conduct univariant Cox survival analysis on specific subgroups of breast cancer patients.Citation32 While the association of G0S2 with low recurrence occurred both in breast cancer cases receiving and not receiving adjuvant antiestrogen therapy (Supplementary Table S1), the association was strongest in stratified subgroups that went on the receive post-surgery endocrine or tamoxifen therapy, were lymph node negative or had luminal A and grade 1 tumors (). In addition, G0S2 overexpression in T47D and to a lesser extent MCF7 cells resulted in a relative enhancement in tamoxifen-mediated growth suppression (). Together these observations support a tumor suppressive role for G0S2 in human breast cancer.
Figure 6. G0S2 expression in breast cancer is associated with decreased recurrence after endocrine or tamoxifen therapy. Kaplan-Meier log-rank test and univariant Cox proportion analysis was performed using the SurvExpress databaseCitation32 with cases divided into two groups above and below the median G0S2 expression value. Results are from the 10 data set meta-analysis constructed by SurvExpress and the independent Sotiriou 2006 dataset. For list of other studies supporting an association between recurrence free survival and G0S2 level after antiestrogen therapy see Supplementary Table S1.
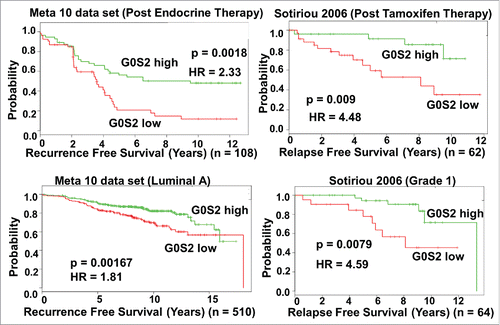
Figure 7. G0S2 overexpressing breast cancer cells exhibit enhanced response to tamoxifen. T47D and MCF7 cells stably expressing V5-tagged, Flag-tagged G0S2 or empty-vector control were treated with tamoxifen in phenol free media containing 0.1 nM estradiol for 8 to 10 days and assessed for changes in cell proliferation as compared to vehicle. Data points are biological triplicates. Error bars, SEM. *, P < 0.05; **, P < 0.01. Results in MCF7 cells trended similar to T47D but did not reach statistical significance.
Discussion
G0/G1 switch gene 2 (G0S2) only exists in vertebrates and is highly conserved, but lacks homology with other proteins. Recent studies support a role for G0S2 in fat homeostasis due to direct inhibition of adipose triglyceride lipase (ATGL).Citation16 G0S2 was implicated in cancer biology on the basis of frequent methylation-mediated silencing in diverse solid tumors and context-specific antitumor activities.Citation15,Citation19-24 In a previous study, we formally demonstrated anti-oncogenic activity for G0S2 in providing a barrier to transformation that was in part mediated by repression of MYC activation. In addition, we uncovered a link between G0S2 and human breast cancer.Citation26
Here, we further define the biological and therapeutic role of G0S2 in human breast cancer. Unbiased, genome-wide expression analyses indicated that G0S2 loss results in enhanced PI3K/mTOR pathway activation that was associated with decreased sensitivity to mTOR inhibitors, rapamycin and everolimus, and the dual PI3K/mTOR inhibitor BEZ235. Notably, G0S2 overexpression in ER+ breast cancer cells reciprocally repressed basal mTOR signaling and increased sensitivity to mTOR and PI3K inhibitors. High G0S2 levels were also associated with improved recurrence rates in breast cancer patients undergoing antiestrogen therapy and overexpression of G0S2 in breast cancer cells resulted in a relative enhancement in tamoxifen-induced growth suppression. Overall, our data present a previously unrecognized role for G0S2 in suppressing PI3K/mTOR signaling and imply that the presence of G0S2 improves the efficacy of PI3K/mTOR-targeted therapies in breast cancer. Our work further defines the tumor suppressor activity of G0S2 and supports the need for additional studies to determine whether G0S2 can be exploited as a novel therapeutic target, particularly in breast cancer.
Although beyond the scope of this work, it will be of interest to comprehensively delineate the molecular mechanisms underlying G0S2 regulation of MYC and PI3K/mTOR signaling pathways in cancer. G0S2 could directly bind to proteins that regulate or are a part of the PI3K/mTOR signaling cascade. Alternatively, G0S2 may inhibit oncogenic signaling via indirect mechanisms such as facilitating crosstalk with other oncogenic or tumor suppressive pathways or contributing to creating a hostile environment for cancer cells.
There are therapeutic implications of G0S2 and its association with PI3K/mTOR signaling in ER+ breast cancer. G0S2 suppresses proliferation of human breast cancer cells and G0S2 expression is prominently repressed in primary breast tumors as compared with normal breast tissue. Notably, low levels of G0S2 are associated with poor recurrence-free survival in breast cancer patients, particularly those of ER+ status.Citation26 Further stratification of patient populations revealed that this association was observed in cases treated with adjuvant antiestrogen therapies. Preclinical and clinical evidence implicate hyperactivation of the PI3K/AKT/mTOR pathway in the progression of human breast cancer and in development of antiestrogen resistance associated with poor prognosis.Citation12,Citation33,Citation34 It is tempting to postulate that negative outcomes such as high recurrence in ER+ breast cancer cases expressing low levels of G0S2 may be attributed in part to increased levels of PI3K/mTOR signaling, leading to resistance to antiestrogen therapy and ultimately recurrence. Activation of the MYC pathway has also been linked to emergence of antiestrogen resistance in human ER+ breast cancer and G0S2 loss is associated with increased MYC activity.Citation8,Citation26,Citation35−39 These findings provide a rationale to further investigate the role of G0S2 in antiestrogen resistance in breast cancer.
We demonstrate that loss of G0S2 is associated with increased basal mTOR activity and decreased sensitivity to pharmacological inhibitors targeting the mTOR pathway. Hyperactivation of mTOR kinase activity through mutation has been shown to reduce the sensitivity of breast cancer cells to ATP-competitive mTOR inhibitors. Likewise, loss of PTEN, a negative regulator of PI3K signaling, is associated with decreased sensitivity to everolimus in human bladder cancer.Citation40−42 In addition, MYC-driven breast tumors are resistant to MEK and PI3K/mTOR pathway inhibitors, suggesting a link between G0S2, MYC and drug sensitivity in ER+ breast cancer that warrants further study.Citation43,Citation44 Our findings demonstrate that G0S2 levels differentially affect cellular responses to PI3K/AKT/mTOR-targeted therapies, which are being explored as an alternative option for ER+ breast cancer cases, particularly those exhibiting resistance to hormone-based therapies.
In order to uncover new, alternative targeted therapies for breast cancers that fail adjuvant therapy, it is vital to understand the mechanisms of recurrence. We found that G0S2 expression is frequently repressed in human breast cancer and that this repression is associated with recurrence and activation of pathways linked to antiestrogen therapy resistance. This discovery could help predict recurrence and sensitivity to therapies targeting these pathways that are currently in clinical development.
Materials and methods
Cell lines and drugs
The generation of G0S2 null mice in the C57BL/6 background was previously described.Citation26 The wild-type and the G0S2 null MEFs were independently derived from the corresponding genotyped embryos and were used at passage number 20 or less. MEFs were cultured in DMEM (Gibco). Knockout MEF lines were confirmed to be G0S2 null by PCR assay of genomic DNA and by real-time PCR assay of total RNA, as described. MCF7, BT474 and T47D breast cancer cell lines were obtained from ATCC and authenticated by ATCC with karyotyping and short tandem repeat profiling. Cells were frozen within 1 month of purchase and used within 2 months after resuscitation. BT474 cells were cultured in RPMI 1640 (Cellgro) and MCF7 and T47D cells were cultured in DMEM (Gibco). All media were supplemented with 10% fetal bovine serum. Rapamycin (sirolimus; S1039), everolimus (RAD001; S1120) and BEZ235 (NVP-BEZ234, dactolisib; S1009) were purchased from Selleck Chemicals. A 1mM stock solution was prepared in DMSO for rapamycin and everolimus, and in DMF for BEZ235. All other drugs and chemicals including tamoxifen and 17-β-estradiol were purchased from Sigma.
Gene expression microarray analysis
Gene Set Enrichment Analysis (GSEA) was performed on microarray data described in our published report (26). In brief, RNA was extracted with TRIzol reagent. Expression analysis was performed in biological triplicate in G0S2 null and wild-type MEFs with MouseRef-8 BeadChip arrays (Illumina). GSEA software was downloaded from the Broad website (http://www.broadinstitute.org/gsea/index.jsp). The number of permutations was 1,000 and the permutation type was gene_set. The newly curated Molecular Signatures Database (MSigDB) collection called “Hallmark Gene Sets” and PI3K- and mTOR-related gene sets were used. Gene expression microarray data have been submitted to the NCBI GEO repository as GSE74696.
G0S2 overexpression
A lentiviral construct (LentiORF) expressing human G0S2 fused to a C-terminal V5 epitope tag (OHS6085-213580605) was purchased from Dharmacon. The insert sequence for G0S2 is available from GenBank (BC009694.1). A pLKO.1-blast lentiviral plasmid was used as an empty-vector control (Addgene ID: 26655). Lentiviral stocks for G0S2 and control were generated from 293T cells using the Trans-Lentiviral Packaging Kit with Calcium Phosphate Transfection Reagent (Thermo Scientific). Cells were cultured with lentiviral stocks for 48 hours, and stable pools were selected with 7.0 μg/ml blasticidin S.
Drug treatment and cell proliferation assays
For MEF proliferation assays, wild-type and G0S2 null cells were seeded in triplicate at 4000 cells per well of a 12-well plate. The next day, indicated cell lines were treated with rapamycin, everolimus or BEZ235 at the indicated concentrations, along with the respective vehicle for each drug as a control. Media was replaced with fresh media and inhibitors 48 hours post-treatment. After 72 hours of incubation, proliferation was measured by the CellTiter-Glo Luminescent Cell Viability Assay (Promega). For long-term proliferation assays, wild-type and G0S2 null cells were plated in triplicate at 2000 cells per well of a 12-well plate, and specified concentrations of drug or vehicle was added the following day. Media and inhibitors were refreshed every 2 days, and after 9 to 11 days, cells were fixed with methanol and stained with Giemsa. For cancer cell proliferation assays, G0S2-overexpressing and empty-vector control breast cancer cell lines, BT474, MCF7 and T47D were plated in triplicates per well of a 24-well tissue culture plate. The day after plating, cells were treated with rapamycin, everolimus, BEZ235 or vehicle control at the indicated final concentrations. Fresh media and inhibitors were replenished every 2–3 days. Viable cells were assessed by manually counting after trypan blue staining 7 to 10 days post-drug treatment. For tamoxifen assay, cells were cultured in phenol-red free DMEM (ThermoFisher) and 10% charcoal absorbed FBS (ThermoFisher) overnight before addition of 0.1 nM estradiol and the indicated concentrations of tamoxifen. Media and drugs were replaced every 3 days and cell proliferation was assessed via CellTiter-Glo assay or viable cell counting.
Real-time PCR and immunoblot analysis
RNA was isolated and purified using TRI-Reagent (Molecular Research Center) and Direct-zol RNA kit (Zymo Research). cDNA was generated using the High Capacity cDNA Reverse Transcription Kit (Applied Biosystems). Real-time PCR assays were performed with iTaq Universal SYBR Green Supermix (Bio-Rad), and gene expression values for each primer of interest were normalized to GAPDH using the ΔΔCt method. For immunoblot analysis, wild-type and G0S2 null MEFs were treated with 20 nM drug (rapamycin, everolimus or BEZ235) or vehicle control and cells were lysed after 24 hours. BT474, MCF7 and T47D cells stably transduced with G0S2 or empty-vector were used within one week of generation to minimize adaptation of cells. Cells were lysed in RIPA supplemented with Halt Protease Inhibitor Cocktail (Thermo Fisher Scientific) and sodium orthovanadate (New England Biolabs) and separated by SDS-PAGE. Lysates were analyzed by immunoblotting using antibodies against phospho-p70 S6 Kinase (P-p70S6K-Thr389, Cell Signaling Technology), Anti-V5 (R96025, Invitrogen) and actin (sc-1615, Santa Cruz).
In silico and survival analysis
Kaplan–Meier log-rank tests were performed using default parameters in SurvExpress.Citation32 The following datasets were used, Wang 2005, Sotiriou 2006, Ivshina 2006, Zhang 2009 and the 9 and 10 Meta-base cohorts described in SurvExpress.Citation32,Citation45−48 Specified subgroups of patients were divided into low or high G0S2 expression at the median expression value. Univariant Cox proportional analysis was performed using the above datasets and default parameters.
Statistical analysis
Statistical significance was determined by a two-sample, two-tailed t-test assuming equal variance. Data is shown as mean ± standard deviation.
Disclosure of potential conflicts of interest
The authors report no conflict of interest.
1371884_Supplemental_Material.zip
Download Zip (270.7 KB)Acknowledgments
The authors would like to thank Dr. Craig Tomlinson, Dr. Joanna Hamilton, Heidi Trask and Rachel West from the Geisel School of Medicine at Dartmouth, Genomics Shared Resource for performing expression array analysis and Dr. Todd Miller and Dr. Manabu Kurokawa, Geisel School of Medicine at Dartmouth for reagents and helpful advice in support of this study.
Funding
This work was supported by a Reach grant from the Alex's Lemonade Stand Foundation (M.J. Spinella) as well as by NIH and NCI grants R21-CA177781 (M.J. Spinella), R01- CA190722 (E. Dmitrovsky), R01-CA087546 (E. Dmitrovsky), and a Samuel Waxman Cancer Research Foundation grant (E. Dmitrovsky) and a UT-STARS award (E. Dmitrovsky).
References
- American Cancer Society. Breast Cancer: Facts and Figures 2013–2014. Atlanta (GA): American Cancer Society, Inc; 2013.
- Metzger-Filho O, Sun Z, Viale G, Price KN, Crivellari D, Snyder RD, Gelber RD, Castiglione-Gertsch M, Coates AS, Goldhirsch A, et al. Patterns of Recurrence and outcome according to breast cancer subtypes in lymph node-negative disease: results from international breast cancer study group trials VIII and IX. J Clin Oncol. 2013;3125:3083-90. doi:10.1200/JCO.2012.46.1574
- Curtis C, Shah SP, Chin SF, Turashvili G, Rueda OM, Dunning MJ, Speed D, Lynch AG, Samarajiwa S, Yuan Y, et al. The genomic and transcriptomic architecture of 2,000 breast tumours reveals novel subgroups. Nature. 2012; 486:346-52. PMID:22522925
- Cancer Genome Atlas Network. Comprehensive molecular portraits of human breast tumours. Nature. 2012;490:61-70. doi:10.1038/nature11412. PMID:23000897
- Kemp-Casey A, Roughead ER, Saunders C, Boyle F, Lopez D, Bulsara M, Preen DB. Breast cancer recurrence following active treatment: determining its incidence in the NSW population. Public Health Res Pract. 2016;26:2611607. doi:10.17061/phrp2611607. PMID:26863170
- Brown S. Improvements in breast cancer recurrence. Post Reprod Health. 2015;214:137-8. doi:10.1177/2053369115613292
- Almstedt K, Schmidt M. Targeted Therapies Overcoming Endocrine Resistance in Hormone Receptor-Positive Breast Cancer. Breast Care (Basel). 2015;10:168-72. doi:10.1159/000405017. PMID:26557821
- Miller TW, Balko JM, Ghazoui Z, Dunbier A, Anderson H, Dowsett M, González-Angulo AM, Mills GB, Miller WR, Wu, et al. A gene expression signature from human breast cancer cells with acquired hormone independence identifies MYC as a mediator of antiestrogen resistance. Clin Cancer Res. 2011;17:2024-34. doi:10.1158/1078-0432.CCR-10-2567. PMID:21346144
- Dey N, De P, Leyland-Jones B. PI3K-AKT-mTOR inhibitors in breast cancers: From tumor cell signaling to clinical trials. Pharmacol Ther. 2017;S0163-7258:30051-7.
- Miller TW, Hennessy BT, Gonzalez-Angulo AM, Fox EM, Mills GB, Chen H, Higham C, Garcia-Echeverria C, Shyr Y, Arteaga CL Hyperactivation of phosphatidylinositol-3 kinase promotes escape from hormone dependence in estrogen receptor-positive human breast cancer. J Clin Invest. 2010;120:2406-13. doi:10.1172/JCI41680. PMID:20530877
- Cavazzoni A, Bonelli MA, Fumarola C, La Monica S, Airoud K, Bertoni R, Alfieri R., Galetti M, Tramonti S, Galvani E, et al. Overcoming acquired resistance to letrozole by targeting the PI3K/AKT/mTOR pathway in breast cancer cell clones. Cancer Lett. 2012; 323:77-87. doi:10.1016/j.canlet.2012.03.034. PMID:22484466
- Ciruelos Gil EM. Targeting the PI3K/AKT/mTOR pathway in estrogen receptor-positive breast cancer. Cancer Treat Rev. 2014;40:862-71. doi:10.1016/j.ctrv.2014.03.004. PMID:24774538
- Yang SX, Polley E, Lipkowitz S. New insights on PI3K/AKT pathway alterations and clinical outcomes in breast cancer. Cancer Treat Rev. 2016;45:87-96. doi:10.1016/j.ctrv.2016.03.004. PMID:26995633
- Hosford SR, Miller TW. Clinical potential of novel therapeutic targets in breast cancer: CDK4/6, Src, JAK/STAT, PARP, HDAC, and PI3K/AKT/mTOR pathways. Pharmgenomics Pers Med. 2014;7:203-15. PMID:25206307
- Heckmann BL, Zhang X, Xie X., Liu J. The G0/G1 Switch Gene 2 (G0S2): Regulating metabolism and beyond. Biochim Biophys Acta. 2013;1831:276-81. doi:10.1016/j.bbalip.2012.09.016. PMID:23032787
- Yang X, Lu X, Lombès M, Rha GB, Chi YI, Guerin TM, Smart EJ, Liu J. The G(0)/G(1) switch gene 2 regulates adipose lipolysis through association with adipose triglyceride lipase. Cell Metab. 2010;11:194-205. doi:10.1016/j.cmet.2010.02.003. PMID:20197052
- Ma T, Lopez-Aguiar AG, Li A, Lu Y, Sekula D, Nattie EE, Freemantle S, Dmitrovsky E. Mice lacking G0S2 are lean and cold-tolerant. Cancer Biol Ther. 2014;15:643-50. doi:10.4161/cbt.28251. PMID:24556704
- Zhang X, Xie X, Heckmann BL, Saarinen AM, Czyzyk TA, Liu J. Targeted disruption of G0/G1 switch gene 2 enhances adipose lipolysis, alters hepatic energy balance, and alleviates high-fat diet-induced liver steatosis. Diabetes. 2014;63:934-46. doi:10.2337/db13-1422. PMID:24194501
- Kusakabe M, Kutomi T, Watanabe K, Emoto N, Aki N, Kage H, Hamano E, Kitagawa H, Nagase T, Sano A, et al. Identification of G0S2 as a gene frequently methylated in squamous lung cancer by combination of in silico and experimental approaches. Int J Cancer. 2010;126:1895-902. PMID:19816938
- Chang X, Monitto CL, Demokan S, Kim MS, Chang SS, Zhong X, Califano JA, Sidransky D. Identification of hypermethylated genes associated with cisplatin resistance in human cancers. Cancer Res. 2010;70:2870-379. doi:10.1158/0008-5472.CAN-09-3427. PMID:20215521
- Choi H, Lee H, Kim TH, Kim HJ, Lee YJ, Lee SJ, Yu JH, Kim D, Kim KS, Park SW, et al G0/G1 switch gene 2 has a critical role in adipocyte differentiation. Cell Death Diffe.r 2014;21:1071-80. doi:10.1038/cdd.2014.26
- Yamada T, Park CS, Shen Y, Rabin KR, Lacorazza HD. G0S2 inhibits the proliferation of K562 cells by interacting with nucleolin in the cytosol. Leuk Res 2014;38:210-7. doi:10.1016/j.leukres.2013.10.006. PMID:24183236
- Yamada T, Park CS, Burns A, Nakada D, Lacorazza HD. The cytosolic protein G0S2 maintains quiescence in hematopoietic stem cells. PLoS One. 2012;7:e38280. doi:10.1371/journal.pone.0038280. PMID:22693613
- Welch C, Santra MK, El-Assaad W, Zhu X, Huber WE, Keys RA, Teodoro JG, Green MR. Identification of a protein, G0S2, that lacks Bcl-2 homology domains and interacts with and antagonizes Bcl-2. Cancer Re.s 2009;69:6782-89. doi:10.1158/0008-5472.CAN-09-0128
- Kitareewan S, Blumen S, Sekula D, Bissonnette RP, Lamph WW, Cui Q, Gallagher R, Dmitrovsky E. G0S2 is an all-trans-retinoic acid target gene. Int J Oncol. 2008;33:397-404. PMID:18636162
- Yim CY, Sekula DJ, Hever-Jardine MP, Liu X, Warzecha JM, Tam J, Freemantle SJ, Dmitrovsky E, Spinella MJ. G0S2 suppresses oncogenic transformation by repressing a MYC-regulated transcriptional program. Cancer Res. 2016;76:1204-13. doi:10.1158/0008-5472.CAN-15-2265. PMID:26837760
- Liberzon A, Birger C, Thorvaldsdóttir H, Ghandi M, Mesirov JP, Tamayo P. The Molecular Signatures Database (MSigDB) hallmark gene set collection. Cell Syst. 2015;1:417-25. doi:10.1016/j.cels.2015.12.004. PMID:26771021
- Lux MP, Fasching PA, Schrauder MG, Hein A, Jud SM, Rauh C, Beckmann MW. The PI3K Pathway: Background and Treatment Approaches. Breast Care (Basel). 2016;11:398-404. doi:10.1159/000453133. PMID:28228706
- Jewell JL, Russell RC, Guan KL. Amino acid signalling upstream of mTOR. Nat Rev Mol Cell Biol 2013;14:133-9. doi:10.1038/nrm3522. PMID:23361334
- Liu R, Wang X, Chen GY, Dalerba P, Gurney A, Hoey T, Sherlock G, Lewicki J, Shedden K, Clarke MF. The prognostic role of a gene signature from tumorigenic breast-cancer cells. N Engl J Med. 2007;356:217-26. doi:10.1056/NEJMoa063994. PMID:17229949
- Ma L, Nie L, Liu J, Zhang B, Song S, Sun M, Yang J, Yang Y, Fang X, Hu S, et al. An RNA-seq-based gene expression profiling of radiation-induced tumorigenic mammary epithelial cells. Genomics Proteomics Bioinformatics. 2012;10:326-35. doi:10.1016/j.gpb.2012.11.001. PMID:23317700
- Aguirre-Gamboa R, Gomez-Rueda H, Martínez-Ledesma E, Martínez-Torteya A, Chacolla-Huaringa R, Rodriguez-Barrientos A, Tamez-Peña JG, Treviño V. SurvExpress: an online biomarker validation tool and database for cancer gene expression data using survival analysis. PLoS One. 2013;8:e74250. doi:10.1371/journal.pone.0074250. PMID:24066126
- Turner NC, Neven P, Loibl S, Andre F. Advances in the treatment of advanced oestrogen-receptor-positive breast cancer. Lancet. 2016;S0140-6736:32419-32419.
- Steelman LS, Martelli AM, Cocco L, Libra M, Nicoletti F, Abrams SL, McCubrey JA. The therapeutic potential of mTOR inhibitors in breast cancer. Br J Clin Pharmacol. 2016;82:1189-212. doi:10.1111/bcp.12958. PMID:27059645
- Bosco EE, Wang Y, Xu H, Zilfou JT, Knudsen KE, Aronow BJ, Lowe SW, Knudsen ES. The retinoblastoma tumor suppressor modifies the therapeutic response of breast cancer. J Clin Invest. 2007;117:218-28. doi:10.1172/JCI28803. PMID:17160137
- McNeil CM, Sergio CM, Anderson LR, Inman CK, Eggleton SA, Murphy NC, Millar EK, Crea P, Kench JG, Alles MC, et al. c-Myc overexpression and endocrine resistance in breast cancer. J Steroid Biochem Mol Biol. 2006;102:147-55. doi:10.1016/j.jsbmb.2006.09.028. PMID:17052904
- Shajahan-Haq AN, Cook KL, Schwartz-Roberts JL, Eltayeb AE, Demas DM, Warri AM, Facey CO, Hilakivi-Clarke LA, Clarke R. MYC regulates the unfolded protein response and glucose and glutamine uptake in endocrine resistant breast cancer. Mol Cancer. 2014;13:239. doi:10.1186/1476-4598-13-239. PMID:25339305
- Al-azawi D, Ilroy MM, Kelly G, Redmond AM, Bane FT, Cocchiglia S, Hill AD, Young LS. Ets-2 and p160 proteins collaborate to regulate c-Myc in endocrine resistant breast cancer. Oncogene. 2008;27:3021-31. doi:10.1038/sj.onc.1210964. PMID:18059336
- Green AR, Aleskandarany MA, Agarwal D, Elsheikh S, Nolan CC, Diez-Rodriguez M, Macmillan RD, Ball GR, Caldas C, Madhusudan S et al. MYC functions are specific in biological subtypes of breast cancer and confers resistance to endocrine therapy in luminal tumours. Br J Cance.r 2016;114:917-28. doi:10.1038/bjc.2016.46
- Rodrik-Outmezguine VS, Okaniwa M, Yao Z, Novotny CJ, McWhirter C, Banaji A, Won H, Wong W, Berger M, de Stanchina E, et al. Overcoming mTOR resistance mutations with a new-generation mTOR inhibitor. Nature. 2016;534:272-6. PMID:27279227
- Seront E, Pinto A, Bouzin C, Bertrand L, Machiels JP, Feron O. PTEN deficiency is associated with reduced sensitivity to mTOR inhibitor in human bladder cancer through the unhampered feedback loop driving PI3K/Akt activation. Br J Cancer. 2013;109:1586-92. doi:10.1038/bjc.2013.505. PMID:23989949
- Carver BS, Chapinski C, Wongvipat J, Hieronymus H, Chen Y, Chandarlapaty S, Arora VK, Le C, Koutcher J, Scher H, et al. Reciprocal feedback regulation of PI3K and androgen receptor signaling in PTEN-deficient prostate cancer. Cancer Cell. 2011;19:575-86. doi:10.1016/j.ccr.2011.04.008. PMID:21575859
- Dey N, Leyland-Jones B, De P. MYC-xing it up with PIK3CA mutation and resistance to PI3K inhibitors: summit of two giants in breast cancers. Am J Cancer Res. 2014;5:1-19. PMID:25628917
- Ilic N, Utermark T, Widlund HR, Roberts TM. PI3K-targeted therapy can be evaded by gene amplification along the MYC-eukaryotic translation initiation factor 4E (eIF4E) axis. Proc Natl Acad Sci USA. 2011;108:E699−708. doi:10.1073/pnas.1108237108. PMID:21876152
- Wang Y, Klijn JG, Zhang Y, Sieuwerts AM, Look MP, Yang F, Talantov D, Timmermans M, Meijer-van Gelder ME, Yu J, et al. Gene-expression profiles to predict distant metastasis of lymph-node-negative primary breast cancer. Lancet. 2005;365:671-9. doi:10.1016/S0140-6736(05)70933-8. PMID:15721472
- Sotiriou C, Wirapati P, Loi S, Harris A, Fox S, Smeds J, Nordgren H, Farmer P, Praz V, Haibe-Kains B, et al. Gene expression profiling in breast cancer: understanding the molecular basis of histologic grade to improve prognosis. J Natl Cancer Inst. 2006;98(4):262-72. doi:10.1093/jnci/djj052. PMID:16478745
- Ivshina AV, George J, Senko O, Mow B, Putti TC, Smeds J, Lindahl T, Pawitan Y, Hall P, Nordgren H, et al. Genetic reclassification of histologic grade delineates new clinical subtypes of breast cancer. Cancer Res. 2006;66:10292-301. doi:10.1158/0008-5472.CAN-05-4414. PMID:17079448
- Zhang Y, Sieuwerts AM, McGreevy M, Casey G, Cufer T, Paradiso A, Harbeck N, Span PN, Hicks DG, Crowe J, et al. The 76-gene signature defines high-risk patients that benefit from adjuvant tamoxifen therapy. Breast Cancer Res Treat. 2009;116:303-9. doi:10.1007/s10549-008-0183-2. PMID:18821012
