ABSTRACT
Most studies on new cancer drugs are based on population-derived data, where the absence of response of a small population may pass unnoticed. Thus, individual longitudinal tracking of cells is important for the future development of efficient cancer treatments. We have used digital holographic microscopy to track individual JIMT-1 human breast cancer cells and L929 mouse fibroblast cultivated in normoxia or hypoxia. In addition, JIMT-1 cells were treated with salinomycin, a cancer stem cell targeting compound. Three-day time-lapse movies were captured and individual cells were analysed with respect to cell division (cell cycle length) and cell movement. Comparing population-doubling time derived from population-based growth curves and individual cell cycle time data from time-lapse movies show that the former hide a sub-population of dividing cells. Salinomycin treatment increased the motility of cells, however, this motility did not result in an increased distant migration i.e. the cells increased their local movement. MCF-7 breast cancer cells showed similar motility behaviour as salinomycin-treated JIMT-1 cells. We suggest that combining features, such as motility and migration, can be used to distinguish cancer cells with mesenchymal (JIMT-1) and epithelial (MCF-7) features. The data clearly emphasize the importance of longitudinal cell tracking to understand the biology of individual cells under different conditions.
Introduction
In cancer, the intra-tumour heterogeneity displayed as differences in e.g. cell morphology, gene expression, metabolism, proliferation including cell cycle dynamics, metastatic potential, and the tumour microenvironment have become more and more obvious.Citation1,2 The impacts of this heterogeneity on cancer treatment outcome clearly needs further elucidation as these factors affect drug sensitivity. A sub-population of cells presumed to be part of the heterogeneity is cancer stem cells (CSCs).Citation3
In the search for CSC specific drugs, using a high-throughput screening system, the ionophore salinomycin was found to efficiently target this population.Citation4 Besides reducing the number of CSCs, salinomycin has been shown to reduce the migration of cellsCitation5 through inhibition of epithelial to mesenchymal transition (EMT) and by inducing mesenchymal to epithelial transition (MET).Citation5-7 The EMT process is known to be a major cause of metastasis,Citation8 making it an interesting drug-target to reduce the metastatic burden of patients.
It is well known that tumours have areas of both fixed and cyclic hypoxia. This is caused by the abnormal structure and function of the micro vessels supplying the tumour, resulting in increased diffusion distances between blood vessels and the tumour cells.Citation9-11 Hypoxia causes a multitude of changes in gene expression, which contribute to the malignant process and development of tumour heterogeneity. CSCs have e.g. been shown to thrive in areas of tumour hypoxia. Thus, it is important to study individual cancer cell behaviour in both contexts of normoxia and hypoxia.
Most studies of effects of new drugs on proliferation and migration of cancer cells in culture are performed on a population level. However, studying cancer cells on a single cell level can give information that otherwise is hidden in population-based data. Differences in drug responses between cancer cells in a population can give an explanation to the outcome of treatment.Citation12,13 By using live cell time-lapse imaging followed by analysis of individual cells, both time dependent interactions between cells and effects of drugs on individual cells can be monitored.Citation12-14 This information can be used in developing and designing new target-directed drugs.Citation15 Digital holographic microscopy is well suited for live cell imaging as no labelling or stains are necessary.Citation16,17 As the illumination intensity is very low, there is no phototoxicity, allowing cells to be monitored and tracked over the course of several days.Citation18 The images can be used for cell division and motility studies, as well as for cytotoxicity and cell morphology studies.Citation17,19-23
We have used digital holographic imaging to obtain time-lapse movies to monitor and track individual human breast cancer JIMT-1 and MCF-7 cells and mouse fibroblast L929 cells, cultured in normoxia (21% O2) or hypoxia (1% O2). In addition, the JIMT-1 cells were treated with salinomycin as we have extensive knowledge on a population-based level of how the treatment affects the CSC population.Citation7 The data was used to create phylogenetic trees of cell divisions and to monitor the movement of individual cells. Our data shows that there is variability in cell behaviour, which indicates the need for individual lineage tracing experiments in order to increase our understanding of the heterogeneity of cancer cell populations and how this affects responses to different conditions including treatments.
Results
Cell proliferation
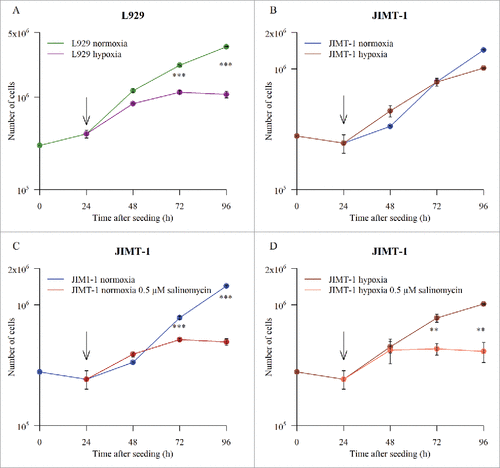
As the basis for our study, we established growth curves for the L929 and JIMT-1 cell lines in the conventional way by cell counting. The growth curves show that L929 cells were more sensitive to hypoxia than the JIMT-1 cells ( and ). The rate of cell proliferation estimated as population doubling time () of L929 cells was lowered already during the first 24 h in hypoxia compared to normoxia and cell proliferation was inhibited totally when cells had been incubated in hypoxia for 48 h (i.e. between 72 to 96 h after seeding). The proliferation of JIMT-1 cells was similar in normoxia and hypoxia 24 to 72 h after seeding and thereafter proliferation decreased in hypoxia (compare population doubling times in ). Salinomycin treatment reduced cell proliferation of JIMT-1 cells to a similar extent under both normoxic () and hypoxic () conditions.
Figure 1. Growth curves for L929 and JIMT-1 cells cultivated under normoxic or hypoxic (1% O2) conditions without or with treatment with 0.5 µM salinomycin. The cells were seeded on day 0. Twenty-four h after seeding (arrows in figures), the cells were subjected to the different incubation conditions shown in the figures. The cell number was determined by counting in a hemocytometer after detachment of cells with trypsin. Data represents mean ± SD for n = 3. *P < 0.05, **P < 0.005, ***P < 0.0005, Students T-test (unpaired).
Individual cell cycle time
The next step was to use time-lapse holographic movies to extract information regarding cell division of individual cells during the same time period as the population doubling times were calculated. Cell family trees were constructed () and cells were categorized according to four different fates (). In , cell 1 shows the fate of a mother cell that was tracked from the first frame of the time-lapse, until the division into two daughter cells (Cells 1.1 and 1.2). The start of the cell cycle for the mother cell is unknown. Such cells are depicted as orange Xs in the bottom panels of , , , and . If the daughter cells divide later in the time-lapse, their entire cell cycle is known. Such cells are depicted with open circles in , , , and . Daughter cells that do not divide during the time-lapse are marked with red Xs (, , , and ). Cell 2 shows the fate of a cell that was tracked from the start of the time-lapse and which did not divide throughout the 72 h observation period. Thus, this is a cell where there is no known start and end of the cell cycle. Such cells are marked with purple Xs (, , , and ).
Figure 2. The structure of two typical cell trees. Cell 1 divides approximately 15 h after initiation of the time-lapse experiment, resulting in the two daughter cells 1.1 and 1.2. Their fates are different, as can be seen in the cell tree i.e. cells 1.1 and 1.2 divide after different times. Blue lines indicate cells that go through an entire cell cycle (○) during the time-lapse experiment. Cell 2 does not divide at all during the time-lapse experiment (X). The entire cell cycle was not obtained for all cells of different reasons. (X) Cells where there is no information on when the cell cycle started i.e. division of the mother cell. (X) Cells where there is no information on when the cell divided. The arrow points to the last division of each branch. For each cell, the cell cycle time, the motility, and the migration between divisions were extracted from the data. The symbols are used in , , , and and described in .
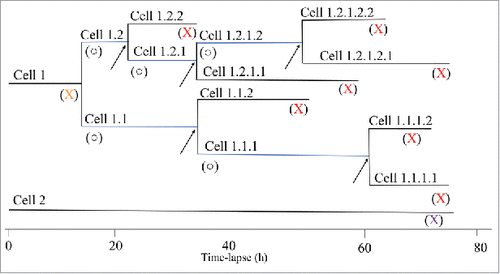
Table 1. Descriptions of symbols used in , , , , , and .
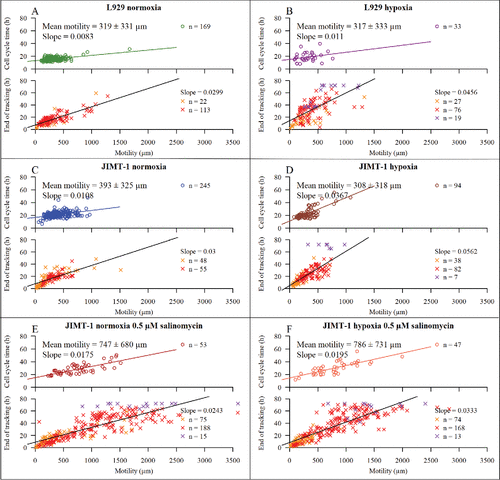
Figure 3. Distribution of cell cycle times in relation to time-lapse duration (h). Time 0 of the time-lapse is equivalent to 24 h after seeding in , thus equivalent to time of treatment. The upper part of each subfigure shows the duration of the time-lapse versus cell cycle time. The lower part of each subfigure shows duration of time-lapse in relation to tracking time for cells with non-completed cell cycles. Symbols are shown in and described in . n is number of cells. Coloured lines are linear regression lines, with slope values in figure. (A) L929 cells in normoxia. (B) L929 cells in hypoxia. (C) JIMT-1 cells in normoxia. (D) JIMT-1 cells in hypoxia. (E) JIMT-1 cells in normoxia treated with 0.5 µM salinomycin. (F) JIMT-1 cells in hypoxia treated with 0.5 µM salinomycin.
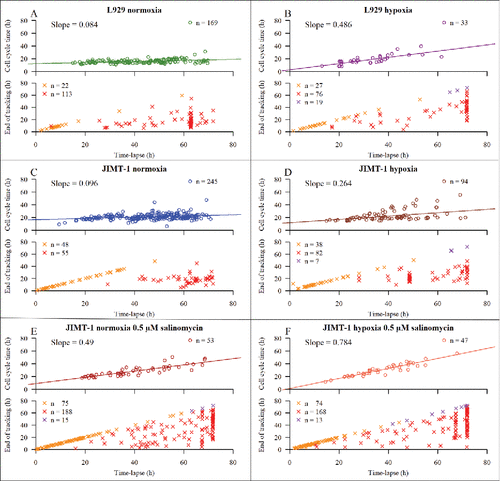
There are different reasons for an unknown end of the cell cycle, e.g. a very long cell cycle time, or the cell moved out of the frame during the time-lapse experiment, or the cell clumped together with other cells, which did not permit continued tracking. To exclude possible bias from the person performing the tracking, all tracked cells are included in the figures.
The x-axis label “Time-lapse (h)” in and equals time of treatment, i.e time point 0 in and , equals 24 h after seeding in the growth curves ().
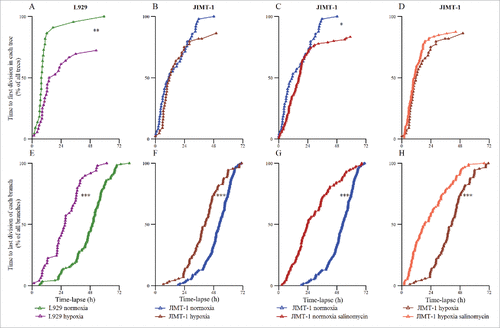
Figure 4. Time to first and last division of each cell tree. Each triangle represents one division of the first (A-D) or last (E-H) generation of a cell tree. (A) L929 cells in normoxia and hypoxia. (B) JIMT-1 cells in normoxia and hypoxia. (C) JIMT-1 cells in normoxia cultured in the absence or presence of 0.5 µM salinomycin. (D) JIMT-1 cells cultured in hypoxia in the absence or presence of 0.5 µM salinomycin. (E) L929 cells in normoxia and hypoxia. (F) JIMT-1 cells in normoxia and hypoxia. (G) JIMT-1 cells in normoxia cultured in the absence or presence of 0.5 µM salinomycin. (H) JIMT-1 cells cultured in hypoxia in the absence or presence of 0.5 µM salinomycin. *P < 0.05, **P < 0.005, ***P < 0.0005. The data are compiled from three experiments.
The cell cycle time for individual L929 cells cultivated in normoxia did not vary much during the observation time (, upper panel), shown by the almost horizontal regression line. For L929 cells cultivated in hypoxia (, upper panel), the cell cycle time increased with culturing time as shown by the positive slope of the regression line. When comparing population doubling time and mean cell cycle time () for L929 cells cultivated in normoxia or hypoxia, it is clear that the latter gives information about the presence of rapidly dividing cells that were not detected in the population-derived data. also shows the percentage of cells that were still cycling during the last 24 h of the experiment. Thus, for L929 cells in hypoxia, the growth curve showed complete growth inhibition between 72 and 96 h after seeding while the tracking of individual cells showed that 3% of the tracked cells were still dividing although with prolonged cell cycle times.
Table 2. Population doubling times and cell cycle times for L929 cells and JIMT-1 cells, cultivated in normoxia or hypoxia and treated with 0.5 µM salinomycin (JIMT-1 only).
A similar pattern for cell cycle times was found for JIMT-1 cells cultured in normoxia and hypoxia as described for L929 cells i.e the cell cycle time for individual JIMT-1 cells cultivated in normoxia did not vary much during the observation time (, upper panel, almost horizontal regression line) while it increased for cells cultured in hypoxia (, upper panel) during the experimental period shown by the positive slope of the regression line. Comparing cell cycle times and population doubling times, it is apparent that the population-based growth curve is lacking information that can be found with individual cell tracking.
When JIMT-1 cells, cultivated in normoxia or hypoxia, were treated with salinomycin, the cell cycle time of dividing cells increased gradually during the experimental period (compare and including slopes, upper panels). Although the growth curves show a complete inhibition of cell proliferation after 48 and 24 h of treatment of cultures in normoxia and hypoxia, respectively, the analysis of individual cells show a small percentage of cells that were still proliferating ().
Cells with non-completed cell cycles (for both cell lines) are also included in , shown in the lower panels. The remaining Xs are cells that have not divided during the tracking time (red and purple Xs). Incubation in hypoxia and/or treatment with salinomycin resulted in an increased number of tracked JIMT-1 cells that did not divide during the time-lapse.
Time dependent effect on cell division
show the time from start of the time-lapse until the first division of the tracked cells that divided i.e. the cells marked with yellow crosses in the lower panels of . All initially tracked L929 cells () and JIMT-1 () cells cultivated in normoxia eventually divided as shown by the number reaching 100%. Cultivation in hypoxia prevented about 30% of the initially tracked L929 cells () and 20% of the initially tracked JIMT-1 cells () from dividing during the time of the time-lapse (i.e. the percent divided cells reached 70%, and 80%, respectively). Salinomycin treatment of JIMT-1 cells cultivated in normoxia () or hypoxia () prevented about 20% of the initially tracked cells from dividing during the time of the time-lapse i.e. similar result as cultivation in hypoxia alone.
show the time to the last division of each branch in each cell tree. Culturing cells in hypoxia (, L929 cells and , JIMT-1 cells) or treating with 0.5 µM salinomycin (, JIMT-1 cells in normoxia and , JIMT-1 cells in hypoxia) shifted the curves to the left, demonstrating a total inhibition of cell division in more trees at earlier time points than in respective controls. Here, salinomycin treatment had a higher impact than hypoxia compared to the effect on the first cell division where salinomycin treatment and hypoxia showed similar effects (compare and ).
Cell movement
In addition to investigating cell division using the HoloMonitor M3 or M4, it is also possible to track cell movement in the acquired time-lapses using the software HStudio™. In Hstudio™, cell movement can be described by the parameters motility and migration (). Motility is defined as the total accumulated distance a cell has moved over the time of tracking. Migration is defined as the shortest distance from the starting point of the tracking to the point where the cell is located in each captured frame. For each individual cell, migration directness is calculated as the ratio between migration and motility for each frame. In average, for each cell, approximately 240–360 migration directness values were calculated, depending on the time of tracking. The average migration directness was then calculated based on all these values. An average migration directness value close to 0 is obtained if a cell moves totally random around one spot and a value of 1 is obtained if a cell moves away from its origin in a straight line. Thus, each cell has a direction of migration independent of the other cells.
Figure 5. Motility and migration as defined in HStudio™. Motility (blue line) is the accumulated movement of the cell over time. Migration (red line) is the shortest distance from the starting point of the cell at time 0 and the current position for each time point, regardless of the movement in between the two time points.

shows the motility of cells in relation to cell cycle time (cells that divide, upper panels) and observation time (cells that do not divide, lower panels). The motility was similar for L929 cells that divided either cultivated in normoxia (, upper panel) or hypoxia (, upper panel). The slightly positive slope of the lines indicates that motility increased with cell cycle time, which is expected as longer cell cycle times results in a longer time for cell movement. This was also true for cells with incomplete cell cycles, as seen in the lower panel of and . The same results were found for JIMT-1 cells cultivated in normoxia () or hypoxia (). When treating JIMT-1 cells cultivated in normoxia or hypoxia with 0.5 µM salinomycin ( and , respectively), the motility of the cells, regardless of normoxic () or hypoxic () condition, increased significantly compared to control (p-value, 1.2 × 10⁻⁹ and 2.3 × 10⁻¹⁰, respectively). The linear relationship with the cell cycle time is still evident.
Figure 6. The dependence of cell motility on cell cycle time and tracking time. Motility is defined as the total distance a cell has moved during the observation time. The upper part of each subfigure shows the motility versus cell cycle time. The lower part of each subfigure shows motility in relation to tracking time for cells with non-completed cell cycles. The symbols are described in and . The mean motility is calculated for cells with completed cell cycles ± confidence interval at 95% confidence level. n is number of cells. Linear regression lines with their respective slopes are shown. Black regression lines represents the collected regression of orange, red, and purple X:s. (A) L929 cells cultured in normoxia. (B) L929 cells cultured in hypoxia. (C) JIMT-1 cells cultured in normoxia. (D) JIMT-1 cells cultured in hypoxia. (E) JIMT-1 cells treated with 0.5 µM salinomycin cultivated in normoxia. (F) JIMT-1 cells treated with 0.5 µM salinomycin cultured in hypoxia. The data are compiled from three experiments.
The mean average migration directness of cells with completed cell cycles was similar for L929 cells cultured in normoxia () or hypoxia (). The mean average migration directness of cells with completed cell cycles was similar for control and salinomycin-treated JIMT-1 cells cultured in normoxia (, top panel and , top panel, respectively) or hypoxia (, top panel and , top panel, respectively). The distribution of average migration directness was broad (large confidence interval) and had no correlation with cell cycle time.
Figure 7. The dependence of average migration directness on cell cycle time and tracking time. Average migration directness describes how far a cell has travelled from the starting point of tracking averaged over the time of tracking. The upper part of each sub-figure shows data for cells with completed cell cycles. The lower part of each subfigure shows data for cells with non-completed cell cycles. The mean average migration directness is calculated for cells with completed cell cycles ± confidence interval of 95% confidence level. The symbols are described in and . (A) L929 cells in normoxia. (B) L929 cells in hypoxia (1% O2). (C) JIMT-1 cells in normoxia. (D) JIMT-1 cells in hypoxia. (E) JIMT-1 cells treated with 0.5 µM salinomycin cultivated in normoxia. (F) JIMT-1 cells treated with 0.5 µM salinomycin cultivated in hypoxia. The data are compiled from three experiments.
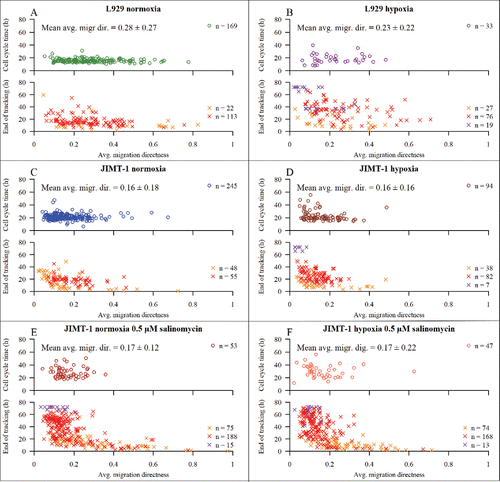
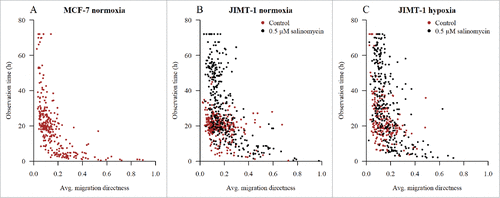
When JIMT-1 cells cultivated in normoxia or hypoxia were treated with salinomycin (, bottom panel and , bottom panel, respectively), the pattern of distribution of cells, with non-completed cell cycles, regarding average migration directness versus end of tracking changed compared to the pattern of cells not treated with salinomycin (, bottom panel and , bottom panel, respectively). There was a shift in the distribution of more cells towards a lower average migration directness compared to non-treated control in normoxia or hypoxia (, bottom panel and , bottom panel, respectively). We have previously shown that salinomycin treatment induces MET in JIMT-1 cells.Citation7 Thus, we hypothesized that this shift maybe reflects a change from mesenchymal to epithelial phenotype. To test our hypothesis, we investigated the more epithelial-like breast cancer cell line MCF-7. In MCF-7 cells, the motility pattern was similar to that of salinomycin-treated JIMT-1 cells i.e. the cells showed a high degree of motility (). However, the mean average migration directness was low, indicating that the increased motility did not result in distant migration ().
Figure 8. Motility and average migration directness in human epithelial MCF-7 cells. The symbols are described in and . Lines show linear regression with slope indicated. Black regression lines represents the collected regression of orange, red, and purple X:s. (A) Motility versus cell cycle time for MCF-7 cells in normoxia. (B) Avg. migration directness versus cell cycle time for MCF-7 cells in normoxia. The data are compiled from three experiments.
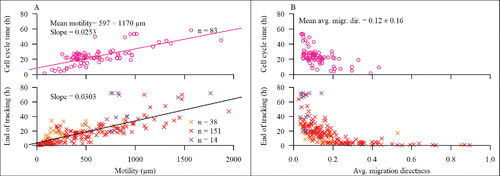
In , the average migration directness versus observation time (i.e. cell cycle time or tracking time depending on fate) for all tracked cells are shown. When the mesenchymal JIMT-1 breast cancer cells cultured in normoxia or hypoxia were treated with salinomycin, the distribution of cells shifted to a distribution more resembling that of the epithelial MCF-7 breast cancer cells in normoxia i.e. an increased number of cells with a low average migration directness and long observation time.
Discussion
It has been increasingly acknowledged that the outcome of cancer therapy is determined by the response of drug treatment on the molecular level in individual cells. Thus, methods of longitudinal tracking are a powerful approach to understand the biology of individual cells and to observe cell-to-cell variability within a population and this contributes to knowledge about population response dynamics. In the present study, we used digital holographic microscopy achieving 72-h data from non-labelled cells. Time-lapse phase contrast and immunofluorescence microscopy are most commonly used for longitudinal cell tracking although in general for shorter time periods than in our study.Citation13,24-26 Another method used to track longitudinal changes in mass and area of cell clusters under different growth conditions is spatial light interference microscopy.Citation27
The population doubling time, obtained from growth curves, is derived from both cycling and non-cycling cells. Our data clearly show that there are sub-populations of rapidly dividing cells hiding in population-based data such as the population doubling time. Thus, by only drawing conclusions based on population data, important biological processes on individual cell levels may be neglected. For instance, if only observing the growth curve for L929 cells growing in hypoxia, we would conclude that all cells have stopped dividing at 72 h after seeding, while the time-lapse data show that there still are cells dividing. Similar results have been reported for HeLa cells using a spinning disc confocal microscopy system.Citation28 Thus, data on individual cell features are hiding within the data of the population, which is also apparent for JIMT-1 cells.
The L929 cells showed higher sensitivity towards the hypoxic condition than the JIMT-1 cells. Differences in cell proliferation in normoxia compared to hypoxia is also apparent for other cells lines.Citation29,30 Altogether these data reflect a phenotypic and genotypic diversity in cell populations resulting in heterogeneity of cell responses to a common stimulus. Presently it is not possible to use digital holographic imaging to accurately distinguish how differences in lengths of the individual cell cycle phases contribute to heterogeneity in cell cycle times.
The growth inhibiting effect of salinomycin treatment has been shown in numerous studies.Citation4,7,31-33 However, this is the first study of how salinomycin affects individual cells cultured in normoxia or hypoxia during a 72 h time period. By monitoring the times to first and last division in individual cell trees it is possible to get an indication of sensitivity to different conditions. In control, the length of time to the first division depends on the variation in the cell cycle time of individual cells of a population and the asynchrony of the population including if there were cells in G0 phase of the cell cycle when the tracking was initiated. When cells are treated, the time to first division will also be affected by the molecular mechanism of the compound e.g. if there are cell cycle specific effects or non-specific effects. Our data show that treatment with 0.5 μM salinomycin had limited effect on ongoing cell cycle progression when the treatment started and that the daughter cells in the next generations were blocked in their cell cycle progression. Salinomycin is well-documented regarding CSC specificity in population-based studies.Citation4,7,34,35 Although the present study investigates the response of individual cells to salinomycin treatment, we cannot yet distinguish cells with different phenotypes using digital holographic imaging. We can only speculate that the early responder cells (i.e. a halted daughter cell after division) and cells that never divide, maybe are CSCs and are presently investigating this notion combining digital holography with fluorescence microscopy. Our previous work has shown that treatment of JIMT-1 cells with 0.5 μM salinomycin reduces the CSC population around 50%.Citation7 The phenotype of JIMT-1 cells still proliferating after 72 h of treatment with 0.5 μM salinomycin remains to be elucidated as well as their sensitivity to other chemotherapeutic drugs. A synergistic effect between salinomycin and conventional chemotherapeutic drugs that target cycling cells has been demonstratedCitation36,37 as well as the development of resistance to salinomycin.Citation38
When JIMT-1 cells were treated with salinomycin, motility increased significantly. At a first glance this is contrary to a number of observations showing that salinomycin treatment decreases cell movement as evaluated in wound healing and Boyden chamber assays.Citation5,7,39-42 However, those assays evaluate migration from a start point to an end point, while motility is a measure of how much cells are moving, independent of how far they migrate from the starting point. Thus, a cell can have very high motility but migrate a very short distance, i.e. move around in a small spot. Taking into account the distance the cells move by using the parameter average migration directness, it is obvious that salinomycin treatment, despite inducing increased motility, resulted in decreased migration as has been reported previously. We have shown that salinomycin treatment-induced decrease in cell migration is accompanied by increased expression of the epithelial marker E-cadherin and decreased expression of the mesenchymal marker vimentin in JIMT-1 cells, indicating epithelial transition to MET to epithelial transition.Citation7 Thus, we decided to investigate motility and migration in the MCF-7 breast cancer cell line, which has more epithelial features than the JIMT-1 cell line. MCF-7 cells grow in tighter colonies than JIMT-1 cells and MCF-7 cells have higher expression of the epithelial markers E-cadherin and β-catenin at the cell surface.Citation7,43 Our data show that, similar to salinomycin-treated JIMT-1 cells, the MCF-7 cells had a high motility, but low average migration directness. Thus, based on our data we propose that MET and EMT can be investigated by longitudinal cell tracking of motility and migration. However, this notion must be more thoroughly investigated using normal mesenchymal and epithelial cells.
In conclusion, our data show that there are individual cell responses, regarding cell cycle length and progression and cell movement behaviour, upon treatment with salinomycin of cells cultured under normoxic or hypoxic conditions that were not to be found in population based data. Thus, methods for longitudinal investigation of cell fates during different treatment conditions, is an important tool to understand the heterogeneity in responses and most importantly to guide cutting-edge drug development.
Materials and methods
Cell culturing
The experiments were conducted using three cell lines: the human breast cancer cell line JIMT-1 (ACC-589) was purchased from the German Collection of Microorganisms and Cell Cultures (Braunschweig, Germany), the human breast cancer cell line MCF-7 (ATCC® 67244™) and the mouse fibroblast cell line L929 (ATCC® CCL-1™) were purchased from American Type Culture Collection (Manassas, VA, USA).
JIMT-1 cells were routinely cultured in DMEM:Ham's F-12 (1:1) medium containing 10% fetal calf serum (VWR, Lund, Sweden), 1 mM non-essential amino acids (VWR), 100 U/ml penicillin (VWR), 100 µg/ml streptomycin (VWR), 2 mM L-glutamine (VWR) and 10 µg/ml insulin (Sigma-Aldrich, Stockholm, Sweden). MCF-7 cells were routinely cultured in RPMI 1640 medium (VWR), supplemented as the JIMT-1 cell medium. L929 cells were routinely cultured in RPMI 1640 medium containing 5% donor horse serum (Sigma-Aldrich), 1 mM non-essential amino acids, 1 mM Na-pyruvate (VWR), 50 U/ml penicillin, 50 mg/ml streptomycin, 10 µg/ml insulin and 1 mg/ml hydrocortisone. All cell lines were routinely passaged twice a week. The cells were kept in an incubator with 5% CO2 in air at 37 °C.
For time-lapse experiments, cells were seeded in Petri dishes (3.5 cm diameter, Sarstedt, Nümbrecht, Germany) at a density of 7300 cells/cm2 in 3 ml of regular growth medium, or in 25 cm2 cell culture flasks (Nalge Nunc International, Penfield, New York, USA) at a density of 15000 cells/cm2 in 5 ml of regular growth medium. For growth curve experiments, the cells were seeded in 3.5 cm Petri dishes (Sarstedt) at a density of 15000 cells/cm2 in regular growth medium. The lower cell density for the time-lapse experiments have previously been evaluated as a proper number to prevent a too confluent image over time, since this would affect the ability to track the cells. The different cell densities did not affect the result (not shown).
Treatment in normoxia or hypoxia
After seeding, cells were incubated in normoxia for 24 h to allow attachment. For experiments in hypoxia, the Petri dishes were then moved to a hypoxia chamber (DonWhitley H35 hypoxiastation, DonWhitely Scientific, West Yorkshire, UK) with an atmosphere containing 1% O2, 5% CO2 and 60% humidity. The medium was changed to a medium equilibrated for the hypoxic environment.
Cells incubated in either normoxia or hypoxia were then treated with salinomycin (Chemtronica AB)Citation7. The compound was kept as a 10 mM stock solution in 100% dimethyl sulfoxide (DMSO). Salinomycin was further diluted in phosphate-buffered saline (PBS) to a concentration of 200 µM. This solution was added to the tissue culture vessels to a final concentration of 0.5 µM salinomycinCitation33 giving a final DMSO concentration of 0.2%. Control cells were exposed to 0.2% DMSO.
Growth curve experiments
For growth curve experiments, cells were harvested by trypsinization (0.05% trypsin and 0.5 mM EDTA) and kept on ice before they were manually counted in a hemocytometer. The cell number was determined 24, 48, 72, and 96 h after seeding. All experiments were repeated at least three times.
Digital holography time-lapse imaging and tracking
Holomonitor M3 and M4 (Phase Holographic Imaging AB, Lund, Sweden) are quantitative phase imaging systems based on digital holographic microscopy.Citation19,44,45 The images acquired from the systems are the digital reconstruction of the cells imprinted by the laser on a CCD-camera.Citation46 In the HoloMonitor system, a low power laser (635 nm wavelength, 0.2 mW/cm2) is split into a reference and an object beam. The object beam is directed through the sample with cells, creating a phase shift in the laser beam, while the reference beam is kept undisturbed. Thereafter, the two beams are merged together creating an interference pattern, the hologram, that is projected on a CCD camera. Based on the hologram, a cell image is computationally reconstructed and can be used for analysis of e.g. cell morphology, cell movement and cell division.
Cells used for time-lapse imaging were placed on the HoloMonitor M3 or M4, immediately after the addition of the compound or the diluent (control) (in both normoxic and hypoxic conditions). Images were acquired with the software Hstudio™ (Phase Holographic Imaging AB) at the same position in the cell culture vessel every 5th minute for 72 h. One representative time-lapse movie per treatment is found in supplementary information (7 movies altogether). After image acquisition, the time-lapses were analysed by individual tracking of the cells also using HStudio™. The tracking is semi-automated. The algorithm attempts to find each tracked cell in the next frame by selecting the closest cell based on the centroid position. The user has to go through each individual captured image of the time-lapse and correct potential errors in the tracking. The data was used to calculate cell cycle time, motility, and average migration directness. Time of tracking equals time of treatment in all figures.
Statistics
The computer language R was used for creating figures and statistical analysis (R Core Team, 2015). Unpaired Students' t-test was used to detect differences between treated and control. Regression lines are plotted in , , and . The slope of the lines is calculated and presented in each plot.
Abbreviations
| CSC | = | cancer stem cell |
| MET | = | mesenchymal to epithelial transition |
| EMT | = | epithelial to mesenchymal transition |
| DHM | = | digital holographic microscopy |
Disclosure of potential conflicts of interest
No potential conflicts of interest were disclosed.
Authors' contributions
SK did the growth curve and analysed the time-lapse movies. SK and SO prepared the HoloMonitor for imaging. DS synthesized the salinomycin. SO, KA, BJ, and SK conceived the study, its design and coordination and drafted the manuscript. All authors read and approved the final manuscript.
1380131_Supplemental_Material.zip
Download Zip (9.4 MB)Acknowledgements
We thank Sebastian Kempengren and Helena Fritz for expert technical help with cell culturing.
Funding
We thank the Swedish Research Council, the Swedish Cancer Foundation, and Carolina LePrince with the “Kalenderflickorna” and associated sponsors.
References
- Hanahan D, Weinberg RA. Hallmarks of cancer: the next generation. Cell. 2011;144(5):646-74. https://doi.org/10.1016/j.cell.2011.02.013. PMID:21376230
- Gay L, Baker A-M, Graham TA. Tumour cell heterogeneity. F1000Res. 2016;5:238. https://doi.org/10.12688/f1000research.7210.1
- Dick JE. Stem cell concepts renew cancer research. Stem Cells. 2008;112(13):4793-4807.
- Gupta PB, Onder TT, Jiang G, Tao K, Kuperwasser C, Weinberg RA. Identification of selective inhibitors of cancer stem cells by high-throughput screening. Cell. 2009;138(4):645-59. https://doi.org/10.1016/j.cell.2009.06.034. PMID:19682730
- Kopp F, Hermawan A, Oak PS, Herrmann A, Wagner E, Roidl A. Salinomycin treatment reduces metastatic tumor burden by hampering cancer cell migration. Mol Cancer. 2014;13(16):2-7. PMID:24387108
- Zhang C, Lu Y, Li Q, Mao J, Hou Z, Yu X, Fan S, Li J, Gao T, Yan B, et al. Salinomycin suppresses TGF- b 1-induced epithelial-to-mesenchymal transition in MCF-7 human breast cancer cells. Chem Biol Interact. 2016;248:74-81. https://doi.org/10.1016/j.cbi.2016.02.004. PMID:26896736
- Huang X, Borgström B, Kempengren S, Persson L, Hegardt C, Strand D. Breast cancer stem cell selectivity of synthetic nanomolar-active salinomycin analogs. BMC Cancer. 2016;16:1-13. https://doi.org/10.1186/s12885-016-2142-3
- Thiery JP, Acloque H, Huang RYJ, Nieto MA. Epithelial-mesenchymal transitions in development and disease. Cell. 2009;139(5):871-90. https://doi.org/10.1016/j.cell.2009.11.007. PMID:19945376
- Braun RD, Ong T, Secomb W, Hong K, Dewhirst MW. Fluctuations in red cell flux in tumor microvessels can lead to transient hypoxia and reoxygenation in tumor parenchyma. Cancer Res. 1996;56:5522-28. PMID:8968110
- Plaks V, Kong N, Werb Z. The cancer stem cell niche: how essential is the niche in regulating stemness of tumor cells? Cell Stem Cell. 2015;16(3):225-38. https://doi.org/10.1016/j.stem.2015.02.015. PMID:25748930
- McKeown SR. Defining normoxia, physoxia and hypoxia in tumours – Implications for treatment response. Br J Radiol. 2014;87(1035):1-12. https://doi.org/10.1259/bjr.20130676
- Spencer SL, Gaudet S, Albeck JG, Burke JM, Peter K. Non-genetic origins of cell-to-cell variability in TRAIL-induced apoptosis. Nature. 2010;459(7245):428-32. https://doi.org/10.1038/nature08012
- Pearl Mizrahi S, Gefen O, Simon I, Balaban NQ. Persistence to anti-cancer treatments in the stationary to proliferating transition. Cell Cycle. 2016;15(24):3442-53. https://doi.org/10.1080/15384101.2016.1248006. PMID:27801609
- Gross SM, Rotwein P. Live cell imaging reveals marked variability in myoblast proliferation and fate. Skeletal Muscle. 2013;3(10):1-11. PMID:23282144
- Heath JR, Ribas A, Mischel PS. Single-cell analysis tools for drug discovery and development. Nature Publishing Group. 2015;15(3):204-16.
- Mölder A, Sebesta M, Gustafsson M, Gisselson L, Wingren AG, Alm K. Non-invasive, label-free cell counting and quantitative analysis of adherent cells using digital holography. J Microsc. 2008;232(2):240-47. https://doi.org/10.1111/j.1365-2818.2008.02095.x. PMID:19017223
- Kühn J, Shaffer E, Mena J, Breton B, Parent J, Rappaz B, Chambon M, Emery Y, Magistretti P, Depeursinge C, et al. Label-free cytotoxicity screening assay by digital holographic microscopy. Assay Drug Dev Technol. 2013;11(2). https://doi.org/10.1089/adt.2012.476
- Langehanenberg P, Ivanova L, Bernhardt I, Ketelhut S, Vollmer A, Dirksen D, Georgiev G, von Bally G, Kemper B. Automated three-dimensional tracking of living cells by digital holographic microscopy. J Biomed Opt. 2009;14(1):14018. https://doi.org/10.1117/1.3080133
- Alm K, El-Schich Z, Falck Miniotis M, Gjörloff Wingren A, Janicke B, Oredsson S. Cells and holograms – holograms and digital holographic microscopy as a tool to study the morphology of living cells. In: Holography - Basic Principles and Contemporary Applications, E. Mihaylova (Ed.). InTech; 2013. https://doi.org/10.5772/54505.
- Bettenworth D, Lenz P, Krausewitz P, Brückner M, Ketelhut S, Domagk D, Kemper B. Quantitative stain-free and continuous multimodal monitoring of wound healing jn vitro with digital holographic microscopy. PLoS ONE. 2014;9(9):e107317. https://doi.org/10.1371/journal.pone.0107317. PMID:25251440
- Dubois F, Yourassowsky C, Monnom O, Legros J-C, Debier O, Van Ham P, Kiss R, Decaestecker C. Digital holographic microscopy for the three-dimensional dynamic analysis of in vitro cancer cell migration. J Biomed Opt. 2006;11(5):1-5. https://doi.org/10.1117/1.2357174
- Kemper B, Bauwens A, Vollmer A, Ketelhut S, Lengehanenberg P, Müthig J, Karch H, Von Bally G. Label-free quantitative cell division monitoring of endothelial cells by digital holographic microscopy. J Biomed Opt. 2010;15(June 2010):1-6.
- Miniotis MF, Mukwaya A, Gjörloff Wingren A. Digital holographic microscopy for non-invasive monitoring of cell cycle arrest in L929 cells. PLOS ONE. 2014;9(9):1-6.
- Burke RT, Orth JD. Through the looking glass: time-lapse microscopy and longitudinal tracking of single cells to study anti-cancer therapeutics. J Vis Exp. 2016;14(111):1-23.
- Hand AJ, Sun T, Barber DC, Hose DR, MacNeil S. Automated tracking of migrating cells in phase-contrast video microscopy sequences using image registration. J Microsc. 2009;234(1):62-79. https://doi.org/10.1111/j.1365-2818.2009.03144.x. PMID:19335457
- Marcus JM, Burke RT, DeSisto JA, Landesman Y, Orth JD. Longitudinal tracking of single live cancer cells to understand cell cycle effects of the nuclear export inhibitor, selinexor. Sci Rep. 2015;5(14391):14391. https://doi.org/10.1038/srep14391. PMID:26399741
- Mir M, Bergamaschi A, Katzenellenbogen BS, Popescu G. Highly sensitive quantitative imaging for monitoring single cancer cell growth kinetics and drug response. PLoS ONE. 2014;9(2):e89000. https://doi.org/10.1371/journal.pone.0089000. PMID:24558461
- Sato S, Rancourt A, Sato Y, Satoh MS. Single-cell lineage tracking analysis reveals that an established cell line comprises putative cancer stem cells and their heterogeneous progeny. Nature Publishing Group. 2016;(6):1-11.
- Wu M, Wang X, McGregor N, Pienta KJ, Zhang J. Dynamic regulation of Rad51 by E2F1 and p53 in prostate cancer cells upon drug-induced DNA damage under hypoxia. Mol Pharmacol. 2014;85(6):866-76. https://doi.org/10.1124/mol.113.090688. PMID:24627085
- Ma Y, Liang D, Liu J, Axcrona K, Kvalheim G, Stokke T, Nesland JM, Suo Z. Prostate cancer cell lines under hypoxia exhibit greater stem-like properties. PLoS ONE. 2011;6(12):1-13. https://doi.org/10.1371/journal.pone.0029170
- Wang F, He L, Dai W, Xu Y, Wu D, Lin C, Wu S, Cheng P, Zhang Y, Shen M, et al. Salinomycin inhibits proliferation and induces apoptosis of human hepatocellular carcinoma cells in vitro and in vivo. PLOS One. 2012;7(12):e50638. https://doi.org/10.1371/journal.pone.0050638. PMID:23284640
- Wu D, Zhang Y, Huang J, Fan Z, Shi F, Wang S. Salinomycin inhibits proliferation and induces apoptosis of human nasopharyngeal carcinoma cell in vitro and suppresses tumor growth in vivo. Biochem Biophys Res Commun. 2014;443(2):712-17. https://doi.org/10.1016/j.bbrc.2013.12.032. PMID:24333874
- Huang X, Ma L, Persson L, Oredsson S, Hegardt C, Strand D. Semisynthesis of SY – 1 for Investigation of Breast Cancer Stem Cell Selectivity of C – Ring-Modified Salinomycin Analogues. ACS Chem Biol. 2014;9:1587-94. https://doi.org/10.1021/cb5002153. PMID:24841425
- Wang T, Narayanaswamy R, Ren H, Torchilin VP. Combination therapy targeting both cancer stem-like cells and bulk tumor cells for improved efficacy of breast cancer treatment. Cancer Biology & Therapy. 2016;17(6):698-707. https://doi.org/10.1080/15384047.2016.1190488
- Larzabal L, El-Nikhely N, Redrado M, Seeger W, Savai R, Calvo A. Differential effects of drugs targeting cancer stem cell (CSC) and non-CSC populations on lung primary tumors and metastasis. PLoS ONE. 2013;8(11):1-13. https://doi.org/10.1371/journal.pone.0079798. PMID:24278179
- Wang F, Dai W, Wang Y, Shen M, Chen K, Cheng P, Zhang Y, Wang C, Li J, Zheng Y, et al. The synergistic in vitro and in vivo antitumor effect of combination therapy with salinomycin and 5-fluorouracil against hepatocellular carcinoma Chang Y-J, editor. PLoS ONE. 2014;9(5):e97414. https://doi.org/10.1371/journal.pone.0097414. PMID:24816638
- Liffers S-T, Tilkorn DJ, Stricker I, Junge CG, Al-Benna S, Vogt M, Verdoodt B, Steinau H-U, Tannapfel A, Tischoff I, et al. Salinomycin increases chemosensitivity to the effects of doxorubicin in soft tissue sarcomas. BMC cancer. 2013;13(490):1-9. PMID:23282137
- Kopp F, Hermawan A, Oak PS, Ulaganathan VK, Herrmann A, Elnikhely N, Thakur C, Xiao Z, Knyazev P, Ataseven B, et al. Sequential salinomycin treatment results in resistance formation through clonal selection of epithelial-like tumor cells. Transl Oncol. 2014;7(6):702-11. https://doi.org/10.1016/j.tranon.2014.09.002. PMID:25500079
- Dong T-T, Zhou H-M, Wang L-L, Feng B, Lv B, Zheng M-H. Salinomycin selectively targets “CD133+” cell subpopulations and decreases malignant traits in colorectal cancer lines. Ann Surg Oncol. 2011;18(6):1797-1804. https://doi.org/10.1245/s10434-011-1561-2. PMID:21267784
- Lieke T, Ramackers W, Bergmann S, Klempnauer J, Winkler M, Klose J. Impact of Salinomycin on human cholangiocarcinoma: induction of apoptosis and impairment of tumor cell proliferation in vitro. BMC Cancer. 2012;12:1-12. https://doi.org/10.1186/1471-2407-12-466. PMID:23057720
- Ketola K, Hilvo M, Hyötyläinen T, Vuoristo A, Ruskeepää A-L, Orešič M, Kallioniemi O, Iljin K. Salinomycin inhibits prostate cancer growth and migration via induction of oxidative stress. Br J Cancer. 2012;106(1):99-106. https://doi.org/10.1038/bjc.2011.530. PMID:22215106
- Scherzed A, Hackenberg S, Froelich K, Rak K, Technau A, Radeloff A, Nöth U, Koehler C, Hagen R, Kleinsasser N. Effects of salinomycin on human bone marrow-derived mesenchymal stem cells in vitro. Toxicol Lett. 2013;218(3):207-14. https://doi.org/10.1016/j.toxlet.2013.02.001. PMID:23410960
- Akasaka H, Sato F, Morohashi S, Wu Y, Liu Y, Kondo J, Odagiri H, Hakamada K, Kijima H. Anti-apoptotic effect of claudin-1 in tamoxifen- treated human breast cancer MCF-7 cells. BMC Cancer. 2010;10(548):1-13. PMID:20937153
- Gabor D. A new microscope principle. Nature. 1948;161:777-78. https://doi.org/10.1038/161777a0. PMID:18860291
- Cuche E, Bevilacqua F, Depeursinge C. Digital holography for quantitative phase-contrast imaging. Opt. Lett. 1999;24(5):291-93. https://doi.org/10.1364/OL.24.000291. PMID:18071483
- Schnars U, Jüptner WP. Digital recording and numerical reconstruction of holograms. Meas. Sci. Technol. 2002;13:R85-R101. https://doi.org/10.1088/0957-0233/13/9/201

