
ABSTRACT
Cancer stem cells resemble normal tissue-specific stem cells in many aspects, such as self-renewal and plasticity. Like their non-malignant counterparts, cancer stem cells are suggested to exhibit a relative quiescence. The established cancer cell lines reportedly harbor slow-proliferating cells that are positive for some cancer stem cells markers. However, the fate of these cells and their progeny remains unknown. We used time-lapse microscopy and the contrast-based segmentation algorithm to identify and monitor actively dividing and non-dividing cells in human osteosarcoma MG-63 cell line. Within the monitored field of view the non-dividing cells were represented by three cells that never divided, and one cell that attempted to divide, but failed cytokinesis, and later, after significantly prolonged division, produced the progeny with enlarged segmented nuclei, thus pointing to a possible mitotic catastrophe. Together, these cells initially constituted about 6.2% of the total number of seeded cells, yet only 0.02% of all cells at the end of the observation period when cells became confluent. Non-dividing cells were characterized by rounded shape, dark nuclei, random cytoplasmic streaming and subtle oscillatory movement, however, they did not migrate and rarely formed cell-cell contacts as compared to actively dividing cells. Our data indicate that the observed non-dividing MG-63 cells do not have a growth advantage over other cells and, therefore, they do not contribute to the cancer stem cells pool.
Introduction
Tissue-specific SC include the subpopulations of quiescent SC and primed SC [Citation1]. Primed SC give rise to robustly proliferating tissue-specific progenitors, the so-called TA cells [Citation2]. In turn, TA cells provide signals for infrequent division of quiescent SC [Citation3] and eventually enter the terminally differentiated compartment [Citation4]. SC demonstrate plasticity [Citation5,Citation6] and ability to regenerate damaged tissues [Citation7,Citation8]. SC are located within a defined local microenvironment, referred to as the SC niche [Citation9,Citation10], where they are regulated by the neighboring heterologous cells [Citation3]. In vivo, under normal conditions, quiescent SC divide rarely, presumably to conserve their proliferative potential and to minimize DNA errors [Citation11]. When removed from their niche's milieu, the placed in cell culture SC proliferate and form colonies [Citation12], and the colony-forming efficiency reflects the SC potential to propagate and differentiate [Citation13].
CSC are believed to represent a rare population of self-renewing tumor cells with the exclusive ability to initiate tumor growth and metastases [Citation14–18]. CSC display some plasticity, that is, they reproduce themselves and other tumor cells, and form blood vessel-like structures [Citation19–22]. Analogously to their non-malignant counterparts, CSC have been suggested to possess relative quiescence [Citation17,Citation23–27], which is believed to be maintained in vivo by their tumor stromal microenvironment and contribute to the resistance of tumors to radiation and chemotherapy [Citation16,Citation26,Citation28,Citation29]. The existence of distinct proliferative states of CSC has also been proposed [Citation30]. However, the factors triggering interconversion between actively dividing and quiescent CSC are not well understood. Transient quiescence is shown to be a common response to chemotherapeutic treatment [Citation28–31] and can protect cancer cells from chemotherapy-induced cell death [Citation32]. Solid tumors are characterized by aberrant vascularization and hypoxia, which results in significant heterogeneity of tumor cells. Although tumor cells demonstrate their growth superiority in the environment with low concentrations of nutrients and oxygen [Citation33], prolonged severe hypoxia slows down cell proliferation and results in cell death [Citation34]. Consequently, whereas the hypoxia has been reported to contribute to the resistance of tumor cells to radiation and chemotherapy [Citation35], the slowly proliferating cells within the hypoxic areas of the growing tumor mass may not necessary belong to the CSC pool.
Cancer cell lines are known to differ significantly in their ability to initiate tumor growth in immunocompromised animals, which probably depends on the presence of CSC [Citation36]. It has been reported that cultured cancer cell lines, in which all cells are provided with the sufficient amounts of oxygen and nutrients, contain subpopulations of slow-proliferating and ND cells, and some of them display various cancer stem cells markers [Citation25,Citation37–48]. The fate of these cells and their progeny, and how such slow-proliferating and ND cells are maintained at a constant ratio from passage to passage, remains poorly understood.
We used time-lapse microscopy to identify and monitor cells with varied frequencies of cycling in the cultured human osteosarcoma MG-63 cell line. We concluded that whereas MG-63 cell line may harbor ND cells out of the tumor niche context, under the normal in vitro oxygen levels and without being exposed to chemotherapeutic agents, such cells do not have a growth advantage over the other cultured cells, tend to be eliminated with continued passaging and, therefore, do not contribute to the CSC population.
Results
Actively dividing and ND cells
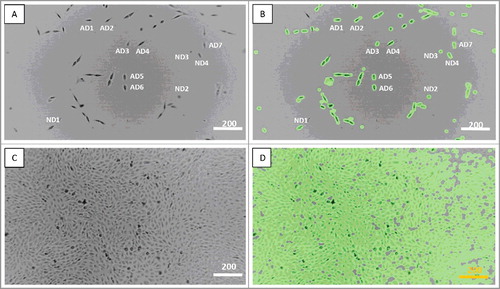
Time-lapse microscopy was repeatedly used to monitor cultured MG-63 cells. These cells are characterized by rapid proliferation, easily visible migration and frequent cell-cell contact, the parameters we planned to evaluate. The experimental conditions (seeding density and time interval) were optimized in the preliminary experiments. While MG-63 cells were seeded at the relatively low density (50 to 70 cells per the monitored field of view), most of the cultured MG-63 cells migrated, interacted with other cells through cell-cell contacts and divided until they reached confluence. The cycling activity of cultured MG-63 cells significantly varied. Presented in the current report images (Supplementary Data) were observed at two-minute interval for a period of 124 h 52 min. after plating. We monitored seven actively dividing cells located in the different areas within the monitored field of view. We also found cells, which we termed ND. One of these cells demonstrated failed cytokinesis and significantly delayed cell division, and divided only once (ND1) Other cells (ND2-ND4) failed to divide during the entire observation period (). Immediately after seeding, ND cells constituted 6.2% of the cell population, however they represented only 0.02% at the end of observation. Although actively dividing cells and their progeny differed in their capacity to divide, all observed actively dividing cells had undergone, at least, three cell divisions (Supplementary Data).
Figure 1. Actively dividing (AD) and non-dividing (ND) MG-63 cells. A, C – the regular view, and B, D – the tracking view mode. A, B – the image taken at 2 min (the starting culture), C, D – the image taken at 124 hours and 52 min (full confluence). Scale bars – 200 µm. See also Supplementary Data.
Failed cytokinesis of ND1 cell
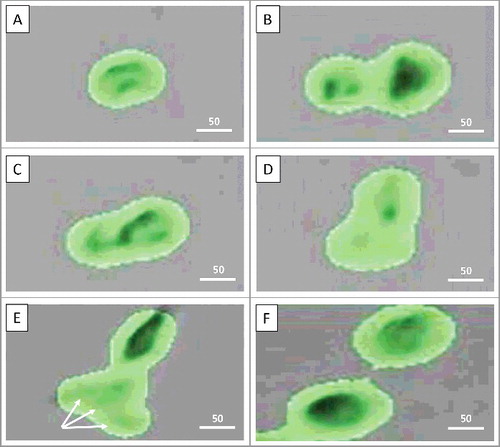
While ND2-ND4 cells never divided, ND1 began dividing at 14 h 58 min after seeding. By 15 h 30 min, two new cells with separate nuclei could be observed, yet without cytoplasmic abscission. At 15 h 56 min, division was aborted, and two daughter cells merged back to the single cell. At 23 h 20 min, ND1 cell appeared to resume cytokinesis, which was completed only by 75 h 46 min when two daughter cells finally separated from each other. Of note, around 56 hours and 40 min, the ND1 daughter cell displayed the multiple segments of the nucleus. (, Supplementary Data).
Figure 2. Failure of cytokinesis. A: Non-dividing cell #1 (ND1) is starting to divide (14 h 58 min); B: ND1 cell has divided without cytoplasmic abscission (15 h 30 min); C: Division is aborted, two daughter cells merged into the single one (15 h 56 min); D: ND1 cell resumes cytokinesis (23 h 20 min); E: ND1 in the process of division (cytokinesis) without cytoplasmic abscission. Arrows point to the nuclear segments, which may represent either several nuclei, or the single multi-lobed nucleus (around 56 hours and 40 min); F: Completion of ND1 cell division by 75 h 46 min. Scale bars – 25 µm. See also Supplementary Data.
Motility and morphology of ND cells
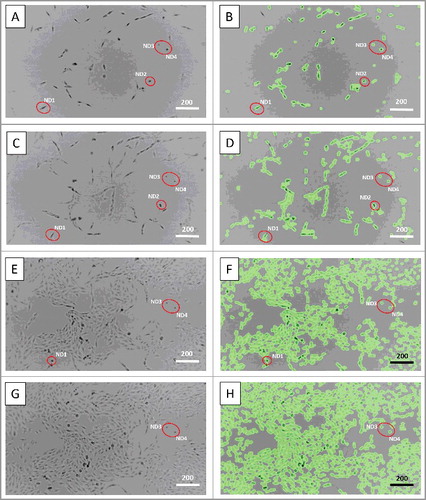
ND cells did not migrate and remained in the same place throughout the whole period of observation, while most of the cultured cells, including the monitored actively dividing cells and their progeny frequently moved. MG-63 are fibroblast-like cells. However, except for ND1, whose morphology had been changing due to the prolonged cell division, ND2-ND4 cells could be characterized by rounded shape, dark nuclei, random cytoplasmic streaming and subtle oscillatory movement. Of note, even after ND2, ND3 and ND4 cells started merging with the growing cell mass, they still could be distinguished by their well-defined dark nuclei. On the contrary, the latter were not always visible in other cells, including actively dividing cells and their progeny, especially when the growing cell mass reached confluency (, Supplementary Data).
Figure 3. Motility and morphology of non-dividing cells. A, B – 8 hours, C, D – 40 hours, E, F – 80 hours, and G, H – 92 hours and 6 min of time-lapse microscopic observation. Red circles indicate non-dividing cells, which did not migrate and maintained their morphology as rounded with dark nuclei. Scale bars – 200 µm. See also Supplementary Data.
ND cells rarely formed cell-cell contacts
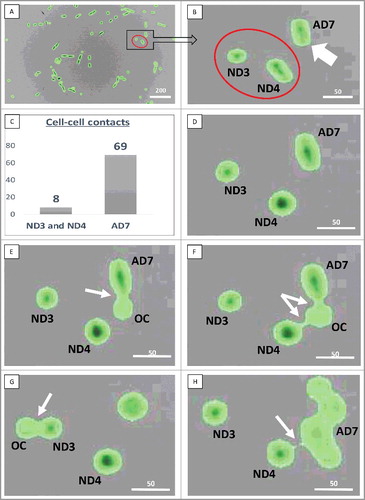
Actively dividing cells and their progeny displayed adhesion with each other and other cultured cells. Furthermore, ND1 cell completed its prolonged division only at 76 h 46 min when it became surrounded by the expanding cell mass and began experiencing more frequent cell-cell contacts with other cultured cells. We hypothesized that intensity of cell cycling could be directly proportional to the frequency of cell-cell contacts. Calculations revealed that the number of cell-cell contacts increased with the increasing cell density, while the latter considerably varied between the different areas within the monitored field of view. ND cells formed the permanent cell-cell contacts with other cultured cells as follows: ND1 – at 82 h 42 min, ND2 – at 50 h 34 min, ND3 – at 97 h 46 min, and ND4 – 103 h 30 min respectively. We compared the incidence of intercellular contacts for the actively dividing cell #7 (AD7), which divided 6 times, and ND3-ND4 cells. These cells were located very close to each other and remained separated from the growing cell mass significantly longer than in other areas within the field of view. We did not count cell-cell contacts between two daughter cells, because they established frequent cell-cell contact with each other immediately after their separation. Because cell density increased during the period of observation we divided the observation period into the early (before 70 h 50 min) and the late phases (71 h 51 min to 124 h 52 min).
During the early phase, when the cell density increased approximately from 15% to 70%, ND3-ND4 cells remained separated from the expanding cell mass. ND4 cell contacted other cultured cells seven times, while ND3 cell contacted other cultured cells only once. In the late phase, ND4 cell had four contacts with the progeny of the AD7 cell, including the prolonged contact from 70 h 52 min until 71 h 30 min. ND3 cell had only one contact with the other cell. During the entire observation period (124 h and 52 min) ND3 and ND4 cells never contacted each other. In contrast, AD7 cell and its progeny interacted 69 times with other cultured cells during the early phase. In the late phase, due to the growing cell density, the progeny of AD7 cell formed prolonged and later stable contacts with other cultured cells and with ND4 cell, while ND3 cell established prolonged and stable contacts with the surrounding cells (, Supplementary Data).
Figure 4. Cell-cell contacts. A, B: Red circles show non-dividing (ND3 and ND4) cells, white arrow indicates the actively dividing (AD7) cell. C: The number of observed cell-cell contacts in the early phase (before 70 h 50 min); D: 3 h 32 min, no cell-cell contacts; E: 3 h 34 min, cell-cell contact between AD7 and the other cultured cell (OC); F: 3 h 44 min, interaction of ND4 and AD7 cells with the OC; G: 5 h 08 min, interaction of ND3 cell with the OC; H: 70 h 52 min, prolonged interaction of the ND4 cell with the progeny of AD7 cell, which was lasting for 38 min. White arrows point to the sites of cell-cell interaction. Scale bars: A – 200 µm, B-H – 50 µm. See also Supplementary data.
Discussion
Cancer cells originate from normal cells and go through a process of continued somatic cell evolution. The course toward malignant transformation is underlined by growing genomic instability: accumulation of mutations and chromosomal translocations. As a result, tumor cells can be selected for tolerance to lower concentrations of oxygen and nutrients and for resistance to chemical and radiation therapies. Perhaps most importantly cancer cells acquire a significant growth advantage, including metastatic potential over the non-malignant cells, and later over the neighboring cells once the tumor is formed [Citation49]. In this regard, it remains poorly understood whether CSC could be exclusively rarely cycling cells, or their quiescence is rather a feature of dormant cancer cells that are responsible for the metastatic relapse long time after initial treatment [Citation18].
Rarely cycling / slow-proliferating cells have been detected in freshly isolated cultures of various tumors [Citation24,Citation28,Citation37,Citation50,Citation51] and cancer cell lines [Citation37,Citation39–42,Citation44–46,Citation52–58]. Some of these cells were positive for a number of markers that are believed to be associated with CSC, such as CD133, CD24, CD44, CD166, EpCAM, CXCR4, Oct4, Nanog, nestin, aldehyde dehydrogenase; they also belonged to SP cells and were characterized by the higher resistance to DNA-damaging agents [Citation24,Citation37,Citation40–42,Citation45,Citation53,Citation54,Citation58]. While cultured brain tumor neurospheres expressed the CSC marker nestin, the nestin-positive cells were present during all phases of the cell cycle, indicating that not all CSCs were quiescent [Citation58]. Although continuous tumor growth may depend on a temporarily distinct subpopulation of slow-cycling cells in some melanoma cell lines, it was acknowledged that tumors could also be initiated by all melanoma cells [Citation43]. In these cell lines, slow-cycling cells showed only partial overlap with CSC markers, such as CD24, CD44, CD133 and aldehyde dehydrogenase, albeit they survived chemotherapeutic treatment, and were able to recreate the initial heterogeneous tumor cell population [Citation45]. In some human lung cancer and nasopharyngeal cell lines the majority of the SP fraction was reported to be in the G(0) quiescent state [Citation39], and telomerase reverse transcriptase expression was higher in SP [Citation48]. However, experiments with monolayer cancer cell lines revealed no significant difference in tumorigenic potential between SP and non-SP [Citation39].
Recent reports indicate that CSC can enter prolonged but reversible quiescence in response to chemotherapy, and remain dormant without causing any clinical manifestations until activated [Citation28,Citation30–32,Citation52,Citation55,Citation59–61]. Short-term exposure of cultured cancer cells to various chemotherapeutic agents at clinically relevant doses enriched for a slow-cycling cells that were resistant to the chemotherapeutic agents, and this subpopulation could resume growth after drug removal [Citation31]. Some of these slow-cycling cells expressed CD133, CD45, CD90, CD117, Oct4 and Nanog [Citation29,Citation31,Citation59,Citation62], and CD44, CD90 and CXCR4 at the mRNA level [Citation52]. When transplanted to immune deficient mice, the cells that were resistant to the chemotherapeutic agents produced tumors [Citation29].
When a fraction of G0 cells is isolated from the hypoxic and anoxic areas of solid tumors, these cells have been reported to be highly resistant to radiation and DNA damage from chemotherapeutic agents [Citation16,Citation33,Citation35]. However, while prolonged hypoxia activates growth factor signaling, immortalization, genetic instability, tissue invasion and metastasis [Citation33], it may also temporarily suppress the proliferative capacity of the cells located within the hypoxic and anoxic tumor regions even if such cells are not related to CSC. This also applies to those cells derived from tumors three-dimensional organoid cultures, which recapitulate the hypoxic gradients of tumors found in vivo [Citation63], as well as established cancer cell lines cultured under hypoxic conditions [Citation64].
It appears that CSC within the stable cell lines can switch between the proliferating (sensitive to chemotherapeutic agents) and chemotherapy-resistant states [Citation60], and divide asymmetrically to produce SP and non-SP cells [Citation39]. These observations are in accord with the concept of two subpopulations of normal SC: the quiescent SC and TA SC, the latter controlling quiescent SC through Sonic Hedgehog signaling [Citation3,Citation65]. Analogously, fast-growing cancer cells might keep their slow-cycling counterparts in a reversible state of quiescence associated with high resistance to chemotherapeutic agents. This implies that two different subpopulations of tumor cells may contribute to aberrant growth and tumor recurrence after therapy [Citation55]. Nevertheless, the mechanisms that control quiescent tumor cell activation remain poorly understood [Citation66]. It is not clear whether the slow-cycling subpopulation of cells that are resistant to chemotherapeutic agents can only be induced or pre-exist in the cultured cancer cells before the onset of chemotherapy.
Using time-lapse microscopy and the novel imaging algorithm, we identified ND MG-63 human osteosarcoma cells that avoided cycling for the entire period of observation, whereas other cells frequently divided. Migration, communication (cell-cell contact) and cell division are linked [Citation67]. ND cells did not migrate although they could be characterized by oscillatory movement and constant random cytoplasmic streaming. The frequency of cell-cell contacts for ND cells was much lower than that of the neighboring AD7 cell and its progeny. This did not increase even in the late phase of observation (after 70 hours and 50 min) when the cell density increased approximately from 70% to 98%. The fate of the observed ND cells is not clear. Such cells failed to re-enter a typical MG-63 cell proliferative cycle, did not demonstrate a growth advantage over other cultured cells and, therefore, they presumably should be eliminated from the population with continued passaging, unless some of them are merged with other cells by entosis. For example, at the end of observation period (97 h 46 min), ND3 cell appears to merge with another cell (Supplementary Data).
Aneuploidy is characteristic for most cancer cells, and aneuploid populations within developing tumors are also considered as possible factors of tumor dormancy [Citation68]. MG-63 cells are hypo-triploid with a modal chromosome number of 66 occurring in 44% of cells [Citation69]. The observed fragmentation of the nucleus in ND1 progeny could be explained by the presence of several nuclei, or by several parts of the multi-lobed nucleus, thus pointing to the possible aneuploidy and/or mitotic catastrophe [Citation70]. One might speculate that the failure of other ND cells to undergo cell division could be due to high genomic instability resulting in significant structural changes and inactivation of cell cycle genes.
Normal SC comprise the slow- and fast-cycling subpopulations [Citation2,Citation71], and the existence of two CSC subpopulations – fast- and slow-growing has also been proposed [Citation55]. We monitored ND cells in monolayer culture. Our data does not indicate that the observed ND cells are truly quiescent and belong to CSC, but rather points to the fact that, due to genomic instability, the cycling potential of cancer cells significantly varies even under normal cell culture oxygen levels and in the absence of chemotherapeutic agents. It would be of interest to correlate the presence of such cells in different cancer cell lines with their ability to initiate tumor growth in vivo. As interpretation of CSC markers may be complicated due to the lack of consensus among different CSC isolation procedures [Citation55], time-lapse microscopy coupled with the novel imaging algorithm can serve as an powerful tool to characterize cancer cells by common functional and phenotypic criteria.
Methods
Culturing MG-63 cells
MG-63 (ATCC® CRL-1427™) human osteosarcoma cell line was cultured in ATCC-formulated Eagle's Minimum Essential Medium (Catalog No. 30–2003) with 10% heat-inactivated fetal bovine serum at 37o C degree in the atmosphere of air, 95%, and carbon dioxide (CO2), 5%. The cells were subcultured at the ratio of 1:4 to 1:8. After optimization in the preliminary experiments the cells were plated for time-lapse monitoring onto the T25 flasks (surface area 2,500 mm2) at the seeding density of 1.0 × 10⁵ cells / flask.
Time-lapse microscopy and image analysis
The CytoSmart LUX10X device (CytoSMART Technologies BV, Eindhoven, The Netherlands) was used to monitor the cultured cells. Bright field images were acquired every two minutes for a period of 124 h and 52 min. Cell tracking (“tracking view” mode) was obtained by a novel contrast-based segmentation algorithm provided by CytoSMART Technologies BV. Image analysis was used to distinguish cells from the background. Contrast-limited histogram equalization was applied to the Gaussian filtered images to remove uneven background shading and improve overall contrast. Foreground masks were obtained by inverse binarization using Otsu's thresholding method and post-processed by using morphological closing with a circular kernel.
Cell-cell interactions
The tracking view imaging allowed us to observe short-term communication between cells, even when they appeared to be separated from each other in the regular view (bright field) mode. We observed cell-cell contacts and registered the time points and the participating cells. The cells were considered as being in contact with each other only if they could be visualized as two separate cells without significant overlap. We monitored ND and the neighboring actively dividing cells and their progeny, and calculated the total numbers of cell-cell interactions.
| Abbreviations | ||
| SC | = | stem cells |
| TA | = | transit-amplifying |
| CSC | = | cancer stem cells |
| AD | = | actively dividing |
| ND | = | non-dividing |
| SP | = | side population |
Disclosure of Potential Conflicts of Interest
No potential conflicts of interest were disclosed.
KCCY_A_1395535_supplementary.rar
Download (6.3 MB)Acknowledgements
We thank Yvannah Garcia, Matthew Honey, Chelsea Joyce, Samuel Sulcer, Jennifer Greenwood, James Smart, Ian Cleary and Jessica Matheson for assistance on various aspects during this study and preparation of this manuscript. Research reported in this publication was partially supported by an Institutional Development Award (IDeA) from the National Institute of General Medical Sciences of the National Institutes of Health under grant number 5P20GM103443. The content is solely the responsibility of the authors and does not necessarily represent the official views of the National Institutes of Health.
Additional information
Funding
Related Research Data
References
- Li L, Clevers H. Coexistence of quiescent and active adult stem cells in mammals. Science. 2010;327:542–545. doi:10.1126/science.1180794. PMID:20110496
- Doupe DP, Alcolea MP, Roshan A, et al. A single progenitor population switches behavior to maintain and repair esophageal epithelium. Science. 2012;337:1091–1093. 10.1126/science.1218835. PMID:22821983
- Hsu YC, Li L, Fuchs E. Transit-amplifying cells orchestrate stem cell activity and tissue regeneration. Cell. 2014;157:935–949. doi:10.1016/j.cell.2014.02.057. PMID:24813615
- Insco ML, Leon A, Tam CH, et al. Accumulation of a differentiation regulator specifies transit amplifying division number in an adult stem cell lineage. Proc Natl Acad Sci USA. 2009;106:22311–22316. doi:10.1073/pnas.0912454106. PMID:20018708
- Sanchez Alvarado A, Yamanaka S. Rethinking differentiation: stem cells, regeneration, and plasticity. Cell. 2014;157:110–119. doi:10.1016/j.cell.2014.02.041. PMID:24679530
- Rojas-Rios P, Gonzalez-Reyes A. Concise review: The plasticity of stem cell niches: a general property behind tissue homeostasis and repair. Stem Cells. 2014;32:852–859. doi:10.1002/stem.1621. PMID:24356972
- Grayson WL, Bunnell BA, Martin E, et al. Stromal cells and stem cells in clinical bone regeneration. Nat Rev Endocrinol. 2015;11:140–150. doi:10.1038/nrendo.2014.234. PMID:25560703
- Blau HM, Cosgrove BD, Ho AT. The central role of muscle stem cells in regenerative failure with aging. Nat Med. 2015;21:854–862. doi:10.1038/nm.3918. PMID:26248268
- Morrison SJ, Spradling AC. Stem cells and niches: mechanisms that promote stem cell maintenance throughout life. Cell. 2008;132:598–611. doi:10.1016/j.cell.2008.01.038. PMID:18295578
- Rezza A, Sennett R, Rendl M. Adult stem cell niches: cellular and molecular components. Curr Top Dev Biol. 2014;107:333–372. doi:10.1016/B978-0-12-416022-4.00012-3. PMID:24439812
- Cotsarelis G, Sun TT, Lavker RM. Label-retaining cells reside in the bulge area of pilosebaceous unit: implications for follicular stem cells, hair cycle, and skin carcinogenesis. Cell. 1990;61:1329–1337. doi:10.1016/0092-8674(90)90696-C. PMID:2364430
- Heimfeld S, Hudak S, Weissman I, et al. The in vitro response of phenotypically defined mouse stem cells and myeloerythroid progenitors to single or multiple growth factors. Proc Natl Acad Sci USA. 1991;88:9902–9906. doi:10.1073/pnas.88.21.9902. PMID:1946416
- Digirolamo CM, Stokes D, Colter D, et al. Propagation and senescence of human marrow stromal cells in culture: a simple colony-forming assay identifies samples with the greatest potential to propagate and differentiate. Brit J Haematol. 1999;107:275–281. doi:10.1046/j.1365-2141.1999.01715.x. PMID:10583212
- Reya T, Morrison SJ, Clarke MF, et al. Stem cells, cancer, and cancer stem cells. Nature. 2001;414:105–111. doi:10.1038/35102167. PMID:11689955
- Malanchi I, Santamaria-Martinez A, Susanto E, et al. Interactions between cancer stem cells and their niche govern metastatic colonization. Nature. 2012;481:85–89. doi:10.1038/nature10694.
- Moore N, Lyle S. Quiescent, slow-cycling stem cell populations in cancer: a review of the evidence and discussion of significance. J Oncol. 2011;2011. doi:10.1155/2011/396076. PMID:20936110
- Hurt EM, Chan K, Serrat MA, et al. Identification of vitronectin as an extrinsic inducer of cancer stem cell differentiation and tumor formation. Stem Cells. 2010;28:390–398. PMID:19998373
- Clevers H. The cancer stem cell: premises, promises and challenges. Nat Med. 2011;17:313–319. doi:10.1038/nm.2304. PMID:21386835
- Soda Y, Marumoto T, Friedmann-Morvinski D, et al. From the cover: Feature article: Transdifferentiation of glioblastoma cells into vascular endothelial cells. Proc Natl Acad Sci USA. 2011;108:4274–4280. doi:10.1073/pnas.1016030108. PMID:21262804
- Wang R, Chadalavada K, Wilshire J, et al. Glioblastoma stem-like cells give rise to tumour endothelium. Nature. 2010;468:829–833. doi:10.1038/nature09624. PMID:21102433
- Ricci-Vitiani L, Pallini R, Biffoni M, et al. Tumour vascularization via endothelial differentiation of glioblastoma stem-like cells. Nature. 2010;468:824–828. doi:10.1038/nature09557. PMID:21102434
- Kofman AV, Abounader R. When tumor cells make blood vessels: implications for glioblastoma therapy. Future Oncol. 2011;7:841–843. doi:10.2217/fon.11.58. PMID:21732755
- Boral D, Nie D. Cancer stem cells and niche mircoenvironments. Front Biosci. 2012;4:2502–2514.
- Gao MQ, Choi YP, Kang S, et al. CD24+ cells from hierarchically organized ovarian cancer are enriched in cancer stem cells. Oncogene. 2010;29:2672–2680. doi:10.1038/onc.2010.35. PMID:20190812
- Dembinski JL, Krauss S. A distinct slow-cycling cancer stem-like subpopulation of pancreatic adenocarcinoma cells is maintained in Vivo. Cancers. 2010;2:2011–2025. doi:10.3390/cancers2042011. PMID:24281215
- Roberts PE. Isolation and establishment of human tumor stem cells. Met Cell Biol. 2008;86:325–342. doi:10.1016/S0091-679X(08)00015-0. PMID:18442655
- Lou H, Dean M. Targeted therapy for cancer stem cells: the patched pathway and ABC transporters. Oncogene. 2007;26:1357–1360. doi:10.1038/sj.onc.1210200. PMID:17322922
- Moore N, Houghton J, Lyle S. Slow-cycling therapy-resistant cancer cells. Stem Cells Dev. 2012;21:1822–1830. doi:10.1089/scd.2011.0477. PMID:21973238
- Kang MK, Kang SK. Tumorigenesis of chemotherapeutic drug-resistant cancer stem-like cells in brain glioma. Stem Cells Dev. 2007;16:837–847. doi:10.1089/scd.2007.0006. PMID:17999604
- Essers MA, Trumpp A. Targeting leukemic stem cells by breaking their dormancy. Mol Oncol. 2010;4:443–450. doi:10.1016/j.molonc.2010.06.001. PMID:20599449
- Li S, Kennedy M, Payne S, et al. Model of tumor dormancy/recurrence after short-term chemotherapy. PloS One. 2014;9:e98021. doi:10.1371/journal.pone.0098021. PMID:24845582
- Touil Y, Igoudjil W, Corvaisier M, et al. Colon cancer cells escape 5FU chemotherapy-induced cell death by entering stemness and quiescence associated with the c-Yes/YAP axis. Clin Cancer Res. 2014;20:837–846. doi:10.1158/1078-0432.CCR-13-1854. PMID:24323901
- Harris AL. Hypoxia–a key regulatory factor in tumour growth. Nat Rev Cancer. 2002;2:38–47. doi:10.1038/nrc704. PMID:11902584
- Strese S, Fryknas M, Larsson R, et al. Effects of hypoxia on human cancer cell line chemosensitivity. BMC Cancer. 2013;13:331. doi:10.1186/1471-2407-13-331. PMID:23829203
- Mao Q, Zhang Y, Fu X, et al. A tumor hypoxic niche protects human colon cancer stem cells from chemotherapy. J Cancer Res Clin Oncol. 2013;139:211–222. doi:10.1007/s00432-012-1310-3. PMID:23052691
- Pece S, Tosoni D, Confalonieri S, et al. Biological and molecular heterogeneity of breast cancers correlates with their cancer stem cell content. Cell. 2010;140:62–73. doi:10.1016/j.cell.2009.12.007. PMID:20074520
- Fujita T, Chiwaki F, Takahashi RU, et al. Identification and Characterization of CXCR4-Positive Gastric Cancer Stem Cells. PloS One. 2015;10:e0130808. doi:10.1371/journal.pone.0130808. PMID:26110809
- Puca F, Colamaio M, Federico A, et al. HMGA1 silencing restores normal stem cell characteristics in colon cancer stem cells by increasing p53 levels. Oncotarget. 2014;5:3234–3245. doi:10.18632/oncotarget.1914. PMID:24833610
- Hoe SL, Tan LP, Jamal J, et al. Evaluation of stem-like side population cells in a recurrent nasopharyngeal carcinoma cell line. Cancer Cell Int. 2014;14:101. doi:10.1186/s12935-014-0101-0. PMID:25317078
- Melin C, Perraud A, Akil H, et al. Cancer stem cell sorting from colorectal cancer cell lines by sedimentation field flow fractionation. Anal Chem. 2012;84:1549–1556. doi:10.1021/ac202797z. PMID:22236375
- Martins-Neves SR, Lopes AO, do Carmo A, et al. Therapeutic implications of an enriched cancer stem-like cell population in a human osteosarcoma cell line. BMC Cancer. 2012;12:139. doi:10.1186/1471-2407-12-139. PMID:22475227
- Chen Y, Li D, Wang D, et al. Quiescence and attenuated DNA damage response promote survival of esophageal cancer stem cells. J Cell Biochem. 2012;113:3643–3652. doi:10.1002/jcb.24228. PMID:22711554
- Roesch A, Fukunaga-Kalabis M, Schmidt EC, et al. A temporarily distinct subpopulation of slow-cycling melanoma cells is required for continuous tumor growth. Cell. 2010;141:583–594. doi:10.1016/j.cell.2010.04.020. PMID:20478252
- Palapattu GS, Wu C, Silvers CR, et al. Selective expression of CD44, a putative prostate cancer stem cell marker, in neuroendocrine tumor cells of human prostate cancer. The Prostate. 2009;69:787–798. doi:10.1002/pros.20928. PMID:19189306
- Dembinski JL, Krauss S. Characterization and functional analysis of a slow cycling stem cell-like subpopulation in pancreas adenocarcinoma. Clin Exp Metastas. 2009;26:611–623. doi:10.1007/s10585-009-9260-0.
- Seigel GM, Hackam AS, Ganguly A, et al. Human embryonic and neuronal stem cell markers in retinoblastoma. Mol Vis. 2007;13:823–832. PMID:17615543
- Ozolek JA, Jane EP, Krowsoski L, et al. Human embryonic stem cells (HSF-6) show greater proliferation and apoptoses when grown on glioblastoma cells than mouse embryonic fibroblasts at day 19 in culture: comparison of proliferation, survival, and neural differentiation on two different feeder cell types. Stem Cells Dev. 2007;16:403–412. doi:10.1089/scd.2006.0109. PMID:17610370
- Ho MM, Ng AV, Lam S, et al. Side population in human lung cancer cell lines and tumors is enriched with stem-like cancer cells. Cancer Res. 2007;67:4827–4833. doi:10.1158/0008-5472.CAN-06-3557. PMID:17510412
- Hanahan D, Weinberg RA. The hallmarks of cancer. Cell. 2000;100:57–70. doi:10.1016/S0092-8674(00)81683-9. PMID:10647931
- Richichi C, Brescia P, Alberizzi V, et al. Marker-independent method for isolating slow-dividing cancer stem cells in human glioblastoma. Neoplasia. 2013;15:840–847. doi:10.1593/neo.13662. PMID:23814495
- Deleyrolle LP, Rohaus MR, Fortin JM, et al. Identification and isolation of slow-dividing cells in human glioblastoma using carboxy fluorescein succinimidyl ester (CFSE). J Vis Exp. 2012;(62):3918. doi:10.3791/3918. PMID:22565048
- Xue Z, Yan H, Li J, et al. Identification of cancer stem cells in vincristine preconditioned SGC7901 gastric cancer cell line. J Cell Biochem. 2012;113:302–312. doi:10.1002/jcb.23356. PMID:21913215
- Vincent Z, Urakami K, Maruyama K, et al. CD133-positive cancer stem cells from Colo205 human colon adenocarcinoma cell line show resistance to chemotherapy and display a specific metabolomic profile. Gen Cancer. 2014;5:250–260. doi:10.18632/genesandcancer.23. PMID:25221643
- Zhao Y, Zhang W, Guo Z, et al. Inhibition of the transcription factor Sp1 suppresses colon cancer stem cell growth and induces apoptosis in vitro and in nude mouse xenografts. Oncol Rep. 2013;30:1782–1792. doi:10.3892/or.2013.2627. PMID:23877322
- Campos B, Gal Z, Baader A, et al. Aberrant self-renewal and quiescence contribute to the aggressiveness of glioblastoma. J Pathol. 2014;234:23–33. doi:10.1002/path.4366. PMID:24756862
- Sun Y, Kong W, Falk A, et al. CD133 (Prominin) negative human neural stem cells are clonogenic and tripotent. PloS One. 2009;4:e5498. doi:10.1371/journal.pone.0005498. PMID:19430532
- Banelli B, Carra E, Barbieri F, et al. The histone demethylase KDM5A is a key factor for the resistance to temozolomide in glioblastoma. Cell Cycle. 2015;14:3418–3429. doi:10.1080/15384101.2015.1090063. PMID:26566863
- Hussein D, Punjaruk W, Storer LC, et al. Pediatric brain tumor cancer stem cells: cell cycle dynamics, DNA repair, and etoposide extrusion. Neuro-Oncol. 2011;13:70–83. doi:10.1093/neuonc/noq144. PMID:20978004
- Li L, Li B, Shao J, et al. Chemotherapy sorting can be used to identify cancer stem cell populations. Mol Biol Rep. 2012;39:9955–9963. doi:10.1007/s11033-012-1864-9. PMID:22744428
- Kobayashi S, Yamada-Okabe H, Suzuki M, et al. LGR5-positive colon cancer stem cells interconvert with drug-resistant LGR5-negative cells and are capable of tumor reconstitution. Stem Cells. 2012;30:2631–2644. doi:10.1002/stem.1257. PMID:23081779
- Li HZ, Yi TB, Wu ZY. Suspension culture combined with chemotherapeutic agents for sorting of breast cancer stem cells. BMC Cancer. 2008;8:135. doi:10.1186/1471-2407-8-135. PMID:18477410
- Cole JM, Joseph S, Sudhahar CG, et al. Enrichment for chemoresistant ovarian cancer stem cells from human cell lines. J Vis Exp. 2014;(91):51891. doi:10.3791/51891. PMID:25285606
- Hubert CG, Rivera M, Spangler LC, et al. A three-dimensional organoid culture system derived from human glioblastomas recapitulates the hypoxic gradients and cancer stem cell heterogeneity of tumors found in vivo. Cancer Res. 2016;76:2465–2477. doi:10.1158/0008-5472.CAN-15-2402. PMID:26896279
- Li P, Zhou C, Xu L, et al. Hypoxia enhances stemness of cancer stem cells in glioblastoma: an in vitro study. Int J Med Sci. 2013;10:399–407. doi:10.7150/ijms.5407. PMID:23471193
- Zhang B, Tsai PC, Gonzalez-Celeiro M, et al. Hair follicles' transit-amplifying cells govern concurrent dermal adipocyte production through Sonic Hedgehog. Gen Dev. 2016;30:2325–2338. doi:10.1101/gad.285429.116.
- Ostyn P, El Machhour R, Begard S, et al. Transient TNF regulates the self-renewing capacity of stem-like label-retaining cells in sphere and skin equivalent models of melanoma. Cell Commun Signal: CCS. 2014;12:52. doi:10.1186/s12964-014-0052-z. PMID:25223735
- De Donatis A, Ranaldi F, Cirri P. Reciprocal control of cell proliferation and migration. Cell Commun and Signal: CCS. 2010;8:20. doi:10.1186/1478-811X-8-20. PMID:20822514
- Kusumbe AP, Bapat SA. Cancer stem cells and aneuploid populations within developing tumors are the major determinants of tumor dormancy. Cancer Res. 2009;69:9245–9253. doi:10.1158/0008-5472.CAN-09-2802. PMID:19951996
- Billiau A, Edy VG, Heremans H, et al. Human interferon: mass production in a newly established cell line, MG-63. Antimicrob Agents Chemoth. 1977;12:11–15. doi:10.1128/AAC.12.1.11. PMID:883813
- Kofman AV, Kim J, Park SY, et al. microRNA-34a promotes DNA damage and mitotic catastrophe. Cell Cycle. 2013;12:3500–3511. doi:10.4161/cc.26459. PMID:24091633
- Fuchs E, Horsley V. Ferreting out stem cells from their niches. Nat Cell Biol. 2011;13:513–518. doi:10.1038/ncb0511-513. PMID:21540847