
 ?Mathematical formulae have been encoded as MathML and are displayed in this HTML version using MathJax in order to improve their display. Uncheck the box to turn MathJax off. This feature requires Javascript. Click on a formula to zoom.
ABSTRACT
Human leukemia Jurkat T cells were analyzed for apoptosis and cell cycle by flow cytometry, using the Annexin V/propidium iodide (PI) standard assay, and a simple PI staining in Triton X-100/digitonin-enriched PI/RNase buffer, respectively. Cells treated with doxorubicin or menadione displayed a very strong correlation between the apoptotic cell fraction measured by the Annexin V/PI assay, and the weight of a secondary cell population that emerged on the forward scatter (FS)/PI plot, as well as on the side scatter (SS)/PI and FL1/PI plots generated from parallel cell cycle recordings. In both cases, the Pearson correlation coefficients were >0.99. In cell cycle determinations, PI fluorescence was detected on FL3 (620/30 nm), and control samples exhibited the expected linear dependence of FL3 on FL1 (525/40 nm) signals. However, increasing doses of doxorubicin or menadione generated a growing subpopulation of cells displaying a definite right-shift on the FS/FL3, SS/FL3 and FL1/FL3 plots, as well as decreased PI fluorescence, indicative of ongoing fragmentation and loss of nuclear DNA. By gating on these events, the resulting fraction of presumably sub-cycling cells (i.e. cells with cleaved DNA, counting sub-G0/G1, sub-S and sub-G2/M cells altogether) was closely similar to the apoptotic rate assessed by Annexin V/PI labeling. Taken together, these findings suggest a possible way to recognize the entire population of cells undergoing apoptotic DNA cleavage and simultaneously determine the cell cycle distribution of non-apoptotic cells in PI-labeled cell samples with various degrees of DNA fragmentation, using a simple and reproducible multiparametric analysis of flow cytometric recordings.
Introduction
Doxorubicin (DOX), an anthracycline sold under the trade name of adriamycin, is one of the most effective antineoplastic agents. Although it has been used in the treatment of various malignancies for decades, including Acute Lymphoblastic Leukemia [Citation1], its molecular mechanism of action is not yet completely understood. Studies have shown that anthracyclines inhibit nucleic acid synthesis by intercalating between the DNA base pairs and also by inhibiting the activity of topoisomerase II, thus preventing the DNA repair [Citation2]. As an amphiphilic molecule, DOX can easily diffuse through intracellular membranes, accumulates in mitochondria where it impairs electron transport followed by enhanced production of reactive oxygen species (ROS) [Citation3], and, due to its anthraquinone ring, can undergo redox cycling, resulting in the formation of highly reactive free radicals [Citation4], which is considered to be the basis of the well-known cardiotoxicity induced by DOX [Citation5,Citation6].
DOX can induce apoptosis in various cell types [Citation7–Citation11]. In Jurkat T lymphoblasts, a cellular model for Acute Lymphoblastic Leukemia, DOX initiates apoptosis mainly by mitochondrial depolarization and release of mitochondrial apoptogen factors [Citation7]. Necrosis can also be induced by DOX, depending on drug concentration and time of exposure. Apoptosis appears to be preferentially induced by relatively high DOX concentrations (250–1000 nM applied for 18–24 h) in Jurkat T cells or other malignant cell types [Citation8,Citation12,Citation13], while in cardiomyocytes apoptosis is triggered by low, and necrosis by high concentrations of DOX [Citation10].
A central mechanism underlying the anti-cancer activity of DOX is connected to its ability to produce DNA alterations that result in cell cycle arrest predominantly in G2/M phase in several cell lines, both p53-negative (e.g. Jurkat cells) and p53-positive [Citation14,Citation15]. It has been reported that DOX concentrations as low as 40 nM applied for 24 h elicit G2/M blockage but essentially no apoptosis in Jurkat cells, whereas prolonged exposure (72 h) appears to induce necrosis in most of the Jurkat cells, but in this case DNA endoreplication can also appear in some of the lymphoblasts, probably due to lack of p53 control in this type of cells [Citation8]. Other studies have suggested that Chk1 phosphorylation is a critical step in DOX-induced cell cycle arrest [Citation16], while inhibition of Chk1 by the antibiotic geldamycin can convert DOX-induced necrosis into apoptosis in Jurkat cells [Citation15].
Menadione (vitamin K3, 2-methyl-1,4-naphthoquinone; MD) is a well-known oxidative stressor, with antitumor activity proved for several cell lines [Citation17–Citation20], including Jurkat T cells [Citation19,Citation21–Citation23]. Studies have shown that MD acts like a radiosensitizing agent as well as a chemosensitiser for a variety of conventional chemotherapeutic agents [Citation24]. In addition, MD proved to be effective against multidrug resistant and parental leukemia cell lines and also against DOX-resistant rat leukemia cells [Citation25,Citation26]. Interestingly, MD has synergistic cytotoxic effects in combination with vitamin C or with flavonoids quercetin and epigallocatechin-3-gallate in leukemia Jurkat cells [Citation23,Citation27,Citation28].
Considering the high potency of MD in augmenting the cytotoxicity of chemotherapeutic agents, we are currently investigating the effect of DOX/MD combination on Jurkat T cells survival. However, an interesting observation has emerged since our earliest experiments, when we first evaluated, using the flow cytometry technique, the pro-apoptotic and cell cycle blocking effects of each agent applied alone.
For apoptosis evaluation, we used the standard Annexin V/propidium iodide (PI) double staining, which enabled us to discriminate early apoptotic cells from late apoptotic and necrotic ones. In early stages, apoptotic cells are Annexin V-positive due to externalization of membrane phosphatidylserine which binds Annexin V with high affinity, and PI-negative because the plasma membrane is still intact and impermeable to this nucleic acid dye [Citation29], while late apoptotic and/or necrotic cells, due to the loss of membrane integrity, stain positive for both Annexin V and PI [Citation30].
For cell cycle distribution, in order to assess the DNA ploidy level, permeabilized cells were stained with propidium iodide, a fluorogenic compound that binds to nucleic acids in a stoichiometric manner, so that the amount of the emitted light is proportional to the DNA content of the cell (RNases being present in the staining buffer). By quantifying the DNA level, one can evaluate the proportion of cells in each phase of the cell cycle and even the presence of apoptotic cells [Citation31]. The distribution of cells within the major phases of the cell cycle is given by the difference in DNA ploidy between the pre-replicative (G0/G1), the replicative (S) and post-replicative + mitotic cells (G2/M). In flow cytometric investigations based exclusively on PI labeling, the apoptotic cells are generally characterized by hypodiploidy (due to DNA fragmentation and subsequent loss via the apoptotic bodies) resulting in a measurable reduction in DNA stainability for the dye, and in many instances can be observed as the sub-G0/G1 population appearing in the PI histogram on the left side of the G0/G1 peak that is associated with a 2n DNA content [Citation32]. However, to the best of our knowledge, the propidium iodide single-staining flow cytometric approach which is routinely used for cell cycle evaluation has currently no conventional criterion for the discrimination of cells that undergo apoptosis from the S- or G2/M phases of the cell cycle but are still carrying, at the time of the recording, a DNA content that is higher than or equal to 2n, and less than 4n [Citation33]. In a rather wide range of apoptotic stages, such cells will experience a progressive loss of nuclear DNA and even long time after exposure to the pro-apoptotic drug, the PI fluorescence of these cells may fall in the cell-cycle region of the PI histogram, so the estimation of the actual cell cycle fractions inherently becomes problematic if the proportion of these events is significant. Signs indicative for such conditions are the enlargement of the G0/G1 and G2/M peaks, or the appearance of a distinct wide, hill-like peak within the region corresponding to the S-phase. Such shape alterations visible in the DNA histograms may render the data virtually unusable, and indicate that the standard cell cycle analysis is inadequate.
In this study we examine a possible way to simultaneously recognize the entire population of events with degraded DNA and determine the cell cycle distribution of the remaining non-apoptotic cells by propidium iodide flow cytometric assay in Jurkat cell samples with various degrees of DNA fragmentation, using a rapid, simple and reproducible multiparametric analysis of FL3 (red) and FL1 (green) fluorescence emission and light scattering parameters (forward scatter and side scatter), and show that the data obtained with the currently proposed method are in tight agreement with the apoptotic cell fraction determined in parallel measurements by the Annexin V/PI assay. Consequently, we were able to characterize the cell cycle effects of the two drugs in a considerably extended dose range. For example, in our experimental setup the standard cell cycle analysis could be applied only for treatments with DOX levels up to 50–100 nM in order to derive the apoptotic, G0/G1, S and G2/M cell fractions, whereas by using the method described here, the cell cycle distributions and the apoptotic cell fractions could be properly calculated for treatments with up to 1800 nM DOX. If also confirmed in other cell lines, these findings may be of aid in oncological studies.
Results
In the course of our current studies on the cytotoxicity of DOX and MD in human leukemia Jurkat cells, we noticed, in treated samples, a net differentiation of a population of events exhibiting increased FS, SS, and FL1 emission of cells incubated with propidium iodide in a Triton X-100/digitonin-enriched PI/RNase buffer.
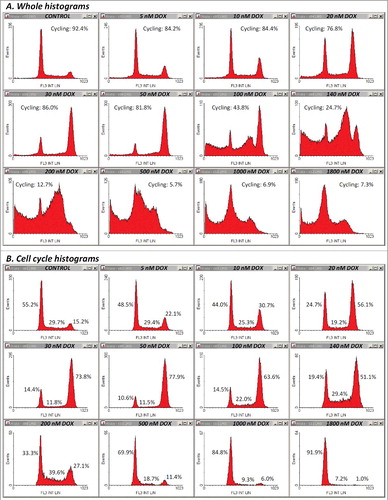
Thus, increasing doses of DOX applied for 45 h produced FS/FL3 density plots as shown in Supplementary Material ESM_2, Figure S1. A simple counter-intuitive examination of the cell fraction associated with the normodiploid events residing in what we supposed to be the “cycling-cell region” – the left area delimited by the borderline between the two distinct subpopulations (Supplementary Material ESM_2, Figure S2) – generated a close correlation with the viable cell fraction measured in parallel determinations using the Annexin V/PI apoptosis assay (not shown). However, because at high doses of DOX, an apparent depletion of this pool of events made the distinction of the borderline rather difficult and somewhat arbitrary, we sought for a more objective way to quantify this effect. In the very same measurements, we noticed a similar differentiation on the SS/FL3 plots, as well as a significant dose-dependent increase in the FL1 signal. So, we defined on each of these three plots a region encompassing the cell-cycle population detected in the control sample (–). In FS/FL3 and SS/FL3 plots we adapted the reference cell-cycle region in order to accommodate the potential enlargement of the G2/M-associated area, which was noticeable in some treatments. The differential response imaged on the FL1/FL3 plot was robust as well, and the reference cycling-cell region strictly preserved its shape between samples, irrespective of the cell cycle blockage (). Since the FL1/FL3 data recorded in control samples align in a quite narrow linear shape, one can infer that the fluorescence collected on FL1 for this population of events is basically emitted by PI. Nevertheless, the nature of the secondary FL1 signal observed in treated samples is unclear, but it may be linked to some green-light emitting cellular fluorescent species that are not lost by Triton X-100/digitonin permeabilization, such as, for examples, certain flavins or lipofuscin, which are widely recognized as the dominant contributors to cellular autofluorescence within this wavelength domain (∼525 nm). Finally, we gated the events on all the three regions described above, and calculated the corresponding fraction of “cycling cells” in the sample. In fact, this term is used here as such, in order to better discriminate between cells carrying a normal nuclear DNA content (including cells arrested at some point in the cell cycle) and their counterpart sub-cycling cells, i.e. cells undergoing DNA fragmentation. The corresponding whole PI histograms and cell-cycle PI histograms associated with the entire cell population and with the cycling-cell population in each sample are shown in (A) and (B), respectively. For this particular set of measurements, details on other gates (R1-R6) defined in order to exclude cellular debris and agglomerates are presented in Supplementary Material ESM_2, Figures S3-S8.
Figure 1. Typical density plots of PI fluorescence (FL3 int lin) versus forward scatter (FS int lin) obtained by propidium iodide flow cytometric analysis of an individual set of twelve samples treated with DOX at indicated doses. Reference cell-cycle region R7 encompassing single-cell events with integer DNA content in the control sample was evenly propagated to all drug-treated samples. The corresponding cell fraction is indicated for each sample. To exclude cellular debris and multi-nucleate events, gates R1-R6 described in Supplementary Material ESM_2 were all set “on”.
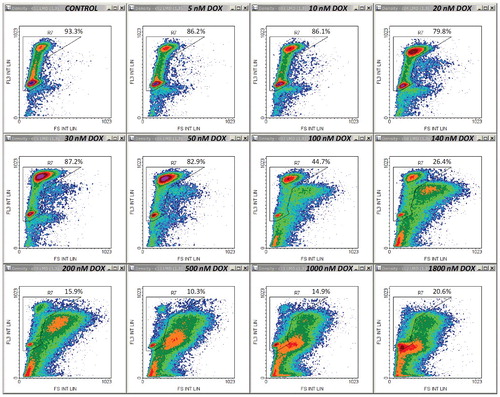
Figure 2. Density plots of PI emission versus side scatter (SS int lin) on the same samples as in . Control cell-cycle region R8 was drawn similarly to region R7. Other details are as in .
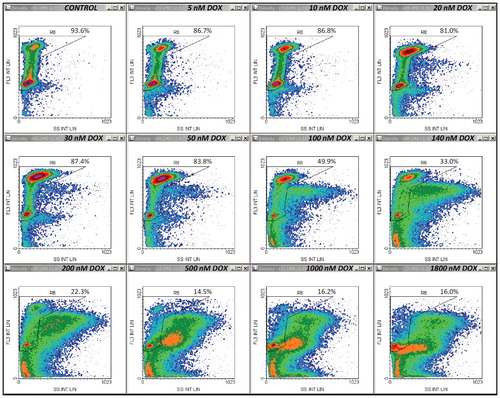
Figure 3. Density plots of PI emission versus emission recorded on FL1 (FL1 int lin) on the same samples as in . Control cell-cycle region R9 was drawn based on the same principle as regions R7 and R8. Other details are as in .
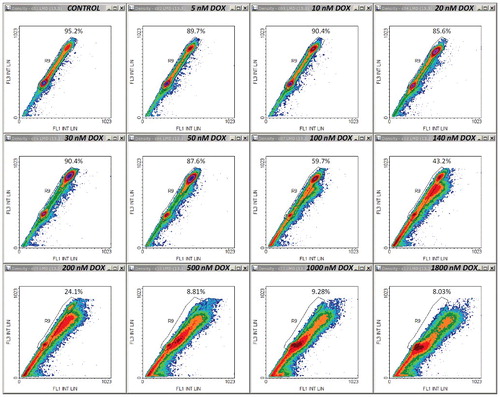
Figure 4. PI fluorescence profiles in the twelve samples discussed in –. (A) Whole histograms were obtained for single-cell events containing both integer and hypodiploid nuclear DNA content (gates R1-R6 “on”, gates R7-R9 “off”). (B) Cell-cycle histograms were constructed by selecting single-cell events with unfractionated DNA only (gates R1-R9 “on”).
Results obtained from this analysis unequivocally show a close connection between the cycling-cell fraction and the apoptotic rate assessed in parallel Annexin V/PI measurements under equivalent treatment conditions ((A)). The corresponding Pearson correlation coefficient (r = 0.992) proves a very strong linear correlation between the two data sets. Both assays indicated a biphasic dose-dependent increase of the apoptotic cell fraction, yielding similar parameter values (). Thus, the dominant contribution to the pro-apoptotic effect of DOX appeared to be associated with an apparent affinity K1 ∼100 nM and an elevated value of the Hill coefficient (H1 ∼3 – 4.4), indicating a strong cooperativity between the DOX-induced processes underlying the biological endpoint evaluated here (i.e., apoptosis). A second apoptosis-triggering mechanism, yet showing a minor contribution to the overall effect, appeared to be activated at higher doses of the drug, revealing an apparent affinity K2 ∼2000 nM and a very high value of the Hill coefficient (H2 ∼5). Likely causes for this dual and cooperative sensitivity to DOX may be linked to the two basic mechanisms underlying the powerful cytostatic activity of this drug, namely binding to DNA intercalative sites, which under certain conditions can display strong positive cooperativity [Citation34], and oxidative stress generation via the cardiolipin-dependent inhibition of mitochondrial respiratory complexes I, III and IV [Citation35,Citation36], which may require association of four DOX molecules to form an antibiotic-cardiolipin complex [Citation35].
Figure 5. Correlation between the sub-cycling cell fraction derived from the propidium iodide cell cycle assay and the apoptotic frequency determined by the Annexin V/PI apoptosis assay in DOX-treated Jurkat cells. (A) Dose-dependence of the viable (Annexin V- and PI-negative) cell fraction and of the cycling cell fraction measured by the two techniques under similar treatment conditions. The Pearson correlation coefficient (r) is indicated. Both data sets were fitted to the sum of two Hill-type functions: , where x represents DOX concentration. Parameter values derived from the best fit to the data are displayed in . (B) Dose-dependence of the cell-cycle phase distributions calculated from cell cycle PI histograms in the same experiments that produced the data on the cycling cell fraction shown in panel A. For the G0/G1 and G2/M cell fractions, the data were fitted to the functions
, and
, respectively. Parameter values obtained from the best fit to the data are displayed in . The curve corresponding to the S-phase data was drawn as
, using the best fit parameters shown in . (C) Typical Annexin V/PI density plots obtained by flow cytometry after treatment with DOX at indicated doses. Cell fractions associated to each quadrant are indicated. (D) FS/SS density plots obtained from the same measurements shown in panel C.
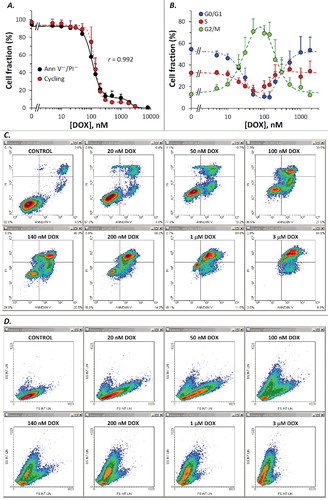
Table 1. Parameters characteristic for the efficiency of doxorubicin in inducing apoptosis of Jurkat cells, as derived from the two indicated assays.
Cell-cycle phase distributions obtained from the cell cycle analysis described above suggest a bimodal effect of DOX ((B)) associated with a dose-dependent increase in the G2/M cell fraction up to about 100 nM DOX, and an apparent recovery at higher levels of the drug, probably reflecting a gradual increase in the severity of cellular damage, which eventually leads, at very high doses, to full impairment of the cell cycle progression, regardless of the actual stage at exposure. The data presented in (B) suggest that the drug-induced G2/M arrest observed in our experiments is mediated by a cooperative process requiring the interaction of most likely two DOX molecules with high affinity (Ka2 = 33 nM; ) toward its specific molecular target(s). The parallel decrease in the G0/G1 and S-phase cell fractions indicates that the progression through these two phases is not affected by drug levels up to 50–100 nM. At higher concentrations, the progressive decline of the G2/M pool appeared to be linked with a decrease in DOX affinity and an increase of the Hill coefficient, which suggests the cooperative interaction of three molecules of the drug (). Taken together, our cell-cycle and Annexin V/PI measurements indicate that in this dose range (>100 nM) apoptosis is triggered, in a dose-dependent manner, from any phase of the cell cycle, with an apparent DOX affinity Ki1 = 240 nM in the G0/G1 cell subpopulation, and Ki2 = 170 nM in the G2/M cells. The potent G2/M blockage observed after treatments with 50–140 nM DOX, which generated G2/M cell fractions higher than 60%, may be connected to the large fractions of early apoptotic cells detected by the Annexin V/PI assay, which were observed in parallel with a progressive migration of the cell subpopulations through the lower right (early apoptosis) quadrant in Annexin V/PI plots ((C)), suggesting that under our conditions cell death proceeded mainly through the apoptotic pathway. In addition, considering that forward scatter is widely recognized as a cell size estimate, whereas the side scatter is largely dependent on cellular granularity, the FS/SS data indicate that the dead cell population detected in DOX-treated samples was essentially composed of apoptotic cells, appearing as a dose-dependently growing subpopulation of events with reduced FS and increased SS (shrunken cells with reduced cytoplasm and condensed chromatin) ((D)). It should also be mentioned that our data are in good agreement with apoptotic rates reported by other studies on DOX-induced apoptosis after 18 or 24 hours of exposure [Citation8,Citation12].
Table 2. Parameters characterizing the efficiency of doxorubicin in arresting the cell cycle at indicated phases.
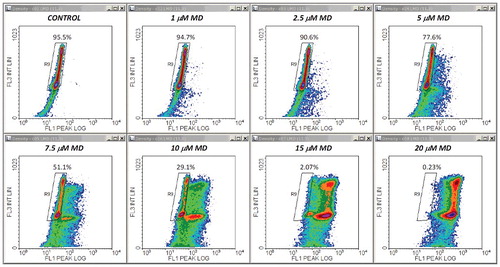
The central conclusion of the experiments described above was further reinforced by a second set of measurements employing a different cytotoxic agent. Thus, qualitatively similar results were obtained after treatments with MD, a well-known oxidative stressor displaying strong apoptogenic effects in the Jurkat cell line. – show a typical example of FS/FL3, SS/FL3 and FL1/FL3 plots obtained from samples of cells stained with propidium iodide in PI/RNase/Triton X-100/digitonin buffer. An obvious difference was that the increase in the FL1 signal was much larger than in DOX-treated cells. Thus, at moderate and high doses of MD, this enhancement was one order of magnitude higher than the emission of control cells (). For this reason we recorded the FL1 signal in logarithmic scale, and in this case we preferred using the FL1 peak intensity instead of the FL1 integral intensity, as it was more effective for drawing region R6 in logarithmic-linear scale. As noticed, due to this scaling change, the FL1/FL3 dependence in control samples has now a different appearance than in , but it is actually a linear one.
Figure 6. Typical density plots of PI fluorescence versus forward scatter obtained by propidium iodide flow cytometric analysis of an individual set of eight samples treated with MD at indicated doses. Other details are as in .
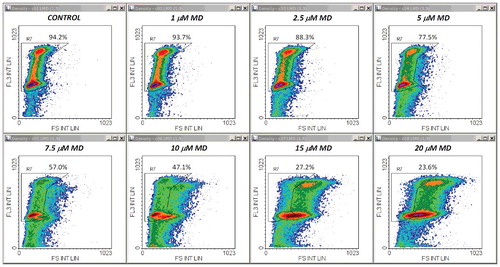
Figure 7. Density plots of PI emission versus side scatter obtained from the same measurements as in . Other details are as in .
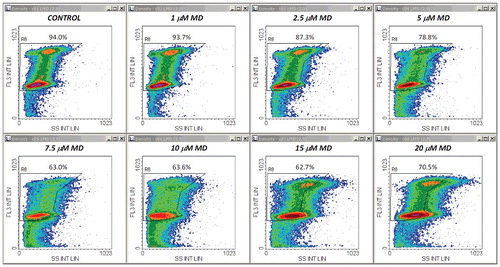
Figure 8. Density plots of PI emission versus emission recorded on FL1 (FL1 peak log) in the same measurements as in . Other details are as in .
Whole and cell-cycle PI profiles derived from these data are displayed in . It appeared that under our conditions, MD had modest effects on the cell cycle. A reduced, yet significant S-phase arrest could be detected for treatments with 5–10 μM MD ((B), (A)). Nevertheless, the cycling-cell fraction decreased in a dose dependent manner, in very good correlation with the Annexin V−/PI− cell fraction assessed in separate experiments ((B)). The corresponding Pearson correlation coefficient was again very high (r = 0.992). The apparent affinities of the drug and Hill coefficient values derived from these data are closely similar () and indicate a strong positive cooperativity involving interaction of at least three MD molecules. In line with this, evidences for a high cooperativity underlying the cytotoxicity of MD, associated therein with a Hill coefficient value of 3.44, have been previously reported by Gao et al. in their studies on human retinal pigment epithelial cells [Citation37]. In our current determinations, Annexin V/PI and FS/SS plots obtained by the apoptosis assay ( (C), (D)) indicate that the cytotoxic effects of MD in Jurkat cells are associated with the induction of apoptosis, which appears to be the dominant form of cell death induced by MD in the current setup.
Figure 9. Histograms of propidium iodide fluorescence in the eight samples discussed in –. Whole (A) and cell-cycle (B) histograms are computed as described in .
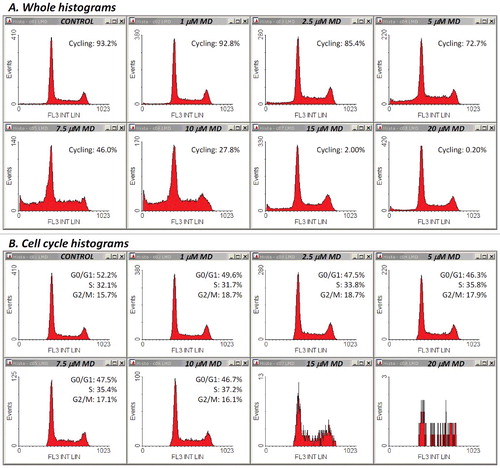
Figure 10. Cell cycle effects and apoptosis induction in MD-treated cells. (A) Dose-dependence of the cell-cycle phase distributions calculated from cell cycle PI histograms. Statistical differences from control values are marked by an asterisk. (B) The sub-cycling cell fractions derived from the propidium iodide cell cycle assay and the apoptotic rates determined by the Annexin V/PI apoptosis assay under similar treatment conditions show a very close correlation. The dose-dependence of the viable (Annexin V- and PI-negative) cell fraction and that of the cycling cell fraction measured by the two techniques under similar treatment conditions was monophasic. The Pearson correlation coefficient (r) is indicated. Both data sets were fitted to a Hill-type function: , where x represents the concentration of menadione. Parameter values obtained from the best fit to the data are displayed in . (C) Typical Annexin V/PI density plots obtained by flow cytometry after MD-treatment at indicated doses. Cell fractions associated to each quadrant are indicated. (D) FS/SS density plots obtained from the same measurements shown in panel C.
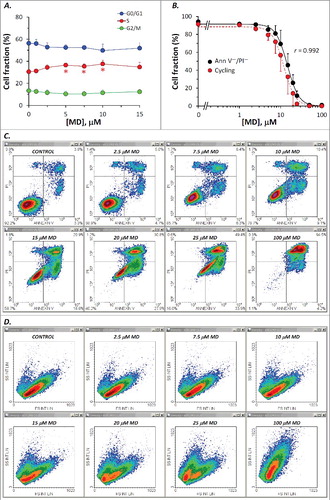
Table 3. Parameters characteristic for the efficiency of menadione in inducing apoptosis of Jurkat cells, as derived from the two indicated assays.
One could notice that low to intermediate doses of MD, up to 10 μM, generated increasing sub-G0/G1 cell fractions that were readily distinguishable on the whole PI histograms ((A)). However, higher levels of the drug progressively depleted the sub-G0/G1 cell population, and the apparent cell cycle phase distributions observed on the whole PI histograms were closely similar to the control ones (data not shown). A likely interpretation for this peculiar result is that in these cases the MD-induced cellular damage was so severe that progression of the cell cycle was fully blocked, irrespective of the current phase at the time of drug addition. Nevertheless, such treatments induced extensive apoptosis, not necrosis, as reported from Annexin V/PI studies described above. Having in view that no evident reduction in PI fluorescence emission could be observed at very high levels of MD in PI labeled samples used for cell cycle analysis, it is possible that the activation of specific endonucleases and the ensuing DNA cleavage proceed at a much slower pace under these treatment conditions, so DNA fragments may be present in the nucleus but they are probably rather large and therefore still dwelling inside the nucleus at the time of the investigation. In addition, care should be taken with respect to the large increase in FL1 emission, which may require proper compensation on FL1/FL3 in order to reduce the impact of the spectral overlap between PI and the secondary MD-activated fluorescent emitter (discussed below). For the analysis presented in –, no compensation was done (further details on the definition of gates R1-R6 for these samples are given in Supplementary Material ESM_2, Figures S9-S14). However, other sets of samples did require a good compensation on FL1/FL3, so that FL3 intensity at the sub-G2/M peak in the 100 μM MD-treated sample should be aligned at the level of FL3 emission at the G2/M peak in the control sample. In early experiments, some PI staining inhomogeneity has been observed, even though the starting cell density was similar between samples (however, the variability in the FL3 emission at the level of the G2/M peak was generally low, within 5% of the control value, and quite infrequently raised up to about 8%; afterwards, we found that errors were considerably reduced by in-depth homogenization of the suspension at each staining step, by adjusting the final cell density to equivalent levels between samples, and by fluorescence compensation where needed). Thus, samples showing high levels of apoptosis may contain significant numbers of cells that are more friable and prone to rapid breakdown during mechanical maneuvers; the resulting cellular fragments will be inherently lost in the supernatant during centrifugation steps of the preparation, and the final cell density of the sample will be consequently diminished. Therefore, both techniques used in this study are likely to underestimate the apoptotic cell fraction in high-dose treatments.
Under both DOX- and MD-treatments, we observed a significant dose-dependent increase in the viable cells’ red autofluorescence detected on FL3 in Annexin V/PI determinations; early apoptotic cells also displayed high autofluorescence with red light emission, but this appeared to be rather dose-independent ((C) and (C)). It is likely that such red fluorescence emission comes from endogenous oxidized cytochromes, so the observation that live, non-apoptotic cells display a dose-dependent increase in red autofluorescence could be an indicator for the occurrence of early cellular lesions that may progress and eventually trigger one or another form of cell death.
Discussion
In this study we propose a possible method for discriminating the entire population of sub-cycling cells (i.e., cells with fragmented DNA, including sub-G0/G1, sub-S and sub-G2/M cells) in Jurkat cell samples stained with propidium iodide in a Triton X-100/digitonin-enriched PI/RNase buffer. It should be mentioned that using the same procedure, we observed a similar, very strong correlation between the sub-cycling cell fraction and the apoptotic frequency determined separately by the Annexin V/PI assay, in a number of other treatments, using DOX/MD, DOX/quercetin or DOX/MD/quercetin combinations (not shown). In all these cases, the Pearson correlation coefficient was very high (>0.98).
Finally, we should stress on the fact that using the FS/FL3 data only, as shown in Supplementary Material ESM_2, Figure S2, without taking into account the SS/FL3 and FL1/FL3 data plots, we could finely reproduce the quantitative results on the cycling cell fraction described above. However, this would lower the upmost drug dose suitable for cell cycle analysis, but even so, the working dose range would still be wider than in a conventional analysis based on the apparent sub-diploidy (i.e., considering only the events with DNA content <2n). For example, the whole PI histograms shown in (A) present considerable distortions for DOX levels ≥100 nM, and can be no longer analyzed by standard means. Instead, by applying the FS/FL3-based selection as the sole discriminating criterion for DNA-loss events, the apoptotic cell fractions shown in (A) could be generally replicated for up to 500–1000 nM DOX. We have also verified whether additional information could be gained from data recorded on FL10 (450/40 nm emission; excitation at 405 nm), assuming that the PI contribution to the signal would be significantly reduced. However, the data were closely similar to those recorded on FL1, and no other peculiarities were observed.
Taken together, all these findings encourage further studies to validate this method by comparison with other standard techniques, and to verify whether other cell lines do show a similar response. First candidates for additional comparative tests are definitely the TUNEL [Citation38] and FLICA [Citation39] assays, which can successfully identify, since the very early stages of apoptosis, the presence of DNA strand breaks by direct dUTP labeling of their 3′-hydroxyl termini as originally proposed by Gorczyca et al. [Citation38], and the activation of caspases by staining with fluorochrome-labeled inhibitors of caspases as shown by Bedner et al. [Citation39], respectively. Furthermore, since the TUNEL assay requires, and the FLICA assay withstands cell fixation and subsequent cell permeabilization, both techniques can be combined with additional PI-labeling for concurrent evaluation of the DNA content by flow cytometry. By comparison, the single dye PI cell-cycle methodology discussed in our study has the practical advantage of simplicity and rapidity, as the corresponding PI loading technique is rather undemanding and there is no need for additional staining, so the whole preparation procedure is much quicker and skips a number of sensitive steps which, when multiple markers are used, such as in the TUNEL or FLICA assays, may inherently have an impact on the affinity, specificity and spectral characteristics of the fluorescence emitter molecules which bind to the probed molecular targets.
In conclusion, the method proposed here may provide a very accessible way to concurrently differentiate the sub-cycling cells and relate the apoptotic engagement to the position in the cell cycle, in the same PI single-labeled cell sample. The potential benefits of this simple approach could aid in clinical investigations that require accurate knowledge on DNA ploidy or cell cycle responses of various treatments.
Materials and methods
Cell cultures. Human leukemia Jurkat T cell lymphoblasts (clone E6.1, ATCC-TIB-152) were cultured in RPMI 1640 medium containing Glutamax-I and 25 mM HEPES (Invitrogen, https://www.thermofisher.com/order/catalog/product/61870036), supplemented with 10% fetal bovine serum, 100 units/ml penicillin and 100 μg/ml streptomycin, at 37ºC in a humidified incubator with a 5% CO2 atmosphere. Cellular viability and morphology were examined under a phase contrast microscope. Viability was assessed by the trypan-blue exclusion test. Stock solutions of doxorubicin (100 mM), menadione sodium bisulphite (100 mM), and digitonin (50 mM) were prepared in dimethyl sulfoxide and kept at −20ºC. Unless specified otherwise, chemicals were from Sigma-Aldrich. Control cells were always treated with the corresponding vehicle. A standard saline solution containing 140 mM NaCl, 5 mM KCl, 1 mM CaCl2, 1 mM MgCl2, 20 mM HEPES, 10 mM glucose, pH 7.4/NaOH, was used for washes and various incubation steps as indicated.
Flow cytometry
For apoptosis/necrosis assessment, ∼1 × 10⁶ cells were treated with DOX for 45 h ± 0.5 h (n = 4) or with MD for 18.3 h ± 0.5 h (n = 6), then washed twice in 1.3 ml phosphate buffer saline and double stained with fluorescein isothiocyanate (FITC) conjugated Annexin V (http://www.bdbiosciences.com/eu/applications/research/clinical-research/oncology-research/proliferation-cell-cycle-and-cell-death/surface-markers/human/fitc-annexin-v/p/556419) and PI (https://www.thermofisher.com/order/catalog/product/P3566), according to the manufacturer's instructions, with slight modifications (the detailed staining protocol is presented in Supplementary Material ESM_1). The samples were analyzed immediately on a Gallios flow-cytometer (Beckman Coulter Life Sciences Headquarters, 5350 Lakeview Pkwy S Drive Indianapolis, Indiana, 46268 United States). The excitation wavelength was 488 nm. Peak emission was recorded in FL1 (525 nm, bandpass 40 nm) for Annexin V-FITC, and FL3 (620 nm, bandpass 30 nm) for PI. Data analysis was performed using the software WinMDI 2.9. Cells negative for both Annexin V-FITC and PI were considered as living cells, those positive for Annexin V-FITC and negative for PI were considered as early apoptotic cells, and those positive for both dyes were considered as late apoptotic or necrotic cells. 25000 events were recorded per treatment. Cellular debris and multi-nucleate events were gated out by using forward scatter (FS)/side scatter (SS) data and the SS time of flight.
For cell cycle determinations, ∼1-1.5 × 10⁶ cells were treated with DOX for 45 h ± 2.0 h (n = 5) or with MD for 20.3 h ± 2.0 h (n = 6), then washed twice in standard saline, and incubated for an additional 20 min. in standard saline at 37ºC in order to allow for full dissociation of any residual DOX that may have remained bound to DNA, hence to ensure the full capacity of PI binding to DNA, and to circumvent potential artifacts on FL3 records originating from fluorescence emission of DOX. Cells were then harvested by centrifugation and incubated for 30 min. at 37ºC in the dark, in 0.5 ml PI/RNase buffer (http://www.bdbiosciences.com/eu/applications/research/apoptosis/buffers-and-ancillary-products/pirnase-staining-buffer/p/550825) supplemented with 0.1% Triton X-100 and 25 μM digitonin. For further details on the staining procedure, please see the full protocol provided in the Supplementary Material ESM_1. When inspected under a contrast-phase microscope, these permeabilized cells appeared as round „phantom” cells of somewhat smaller size than intact cells. The samples were then analyzed immediately on a Gallios flow-cytometer, with excitation at 488 nm. PI fluorescence was quantified as the integral FL3 emission. Peak FL1 and FL3 emission were also recorded and analyzed as indicated. The number of events recorded per sample (20000 in control), was progressively, dose-dependently increased as the sub-cycling cell fraction increased, reaching an upper limit of 80000 events for the samples treated with the highest dose of the drug. Data analysis was performed using the software WinMDI 2.9. Cellular debris and multi-nucleate events were gated out by defining 6 regions of interest (R1-R6), as exemplified in Supplementary Material ESM_2, Figures S3-S14. The G0/G1, S, and G2/M cell fractions were calculated for the non-apoptotic cell population only, by excluding the hypodiploid events as shown in the text, and using a Gaussian deconvolution algorithm as previously described [Citation21].
Data fitting was performed using the software Origin, version 7.5.
Statistics. Data are displayed as median ± s.e.m. of at least four different measurements. Statistically significant differences were determined using the Student's t-test. A level of P < 0.05 was considered significant.
Disclosure of potential conflicts of interest
No potential conflicts of interest were disclosed.
supplementary.rar
Download (2.7 MB)Acknowledgments
Work for R.G.S., O.E.B., V.C., M.T.I. and A.I.D. was supported by the Young Researchers Fellowships of the Romanian Ministry of Education, UEFISCDI, project numbers 6/2014, 8/2015, 6/2015, 7/2015, and 8/2016, respectively. The funders had no role in the study design, data collection and analysis, decision to publish, or preparation of the manuscript.
Related Research Data
References
- Pol J, Vacchelli E, Aranda F, et al. Trial Watch: immunogenic cell death inducers for anticancer chemotherapy. Oncoimmunology. 2015;4(4):e1008866. doi:10.1080/2162402X.2015.1008866. PMID:26137404
- Gewirtz DA. A critical evaluation of the mechanisms of action proposed for the antitumor effects of the anthracycline antibiotics adriamycin and daunorubicin. Biochem Pharmacol. 1999;57(7):727–741. doi:10.1016/S0006-2952(98)00307-4. PMID:10075079
- Sarvazyan N. Visualization of doxorubicin-induced oxidative stress in isolated cardiac myocytes. Am J Physiol. 1996;271(5 Pt 2):H2079–H2085. PMID:8945928
- Xu X, Persson HL, Richardson DR. Molecular pharmacology of the interaction of anthracyclines with iron. Mol Pharmacol. 2015;68(2):261–271. doi:10.1124/mol.105.013383. PMID:15883202
- Kalyanaraman B. Teaching the basics of redox biology to medical and graduate students: Oxidants, antioxidants and disease mechanisms. Redox Biol. 2013;1:244–257. doi:10.1016/j.redox.2013.01.014. PMID:24024158
- Wold LE, Aberle NS 2nd, Ren J. Doxorubicin induces cardiomyocyte dysfunction via a p38 MAP kinase-dependent oxidative stress mechanism. Cancer Detect Prev. 2005;29(3):294–299. doi:10.1016/j.cdp.2004.07.008. PMID:15936597
- Gamen S, Anel A, Pérez-Galán P, et al. Doxorubicin treatment activates a Z-VAD-sensitive caspase, which causes deltapsim loss, caspase-9 activity, and apoptosis in Jurkat cells. Exp Cell Res. 2000;258(1):223–235. doi:10.1006/excr.2000.4924. PMID:10912804
- Sugimoto K, Tamayose K, Sasaki M, et al. Low-dose doxorubicin-induced necrosis in Jurkat cells and its acceleration and conversion to apoptosis by antioxidants. Br J Haematol. 2002;118(1):229–238. doi:10.1046/j.1365-2141.2002.03577.x. PMID:12100152
- Hassan F, Islam S, Mu MM, et al. Lipopolysaccharide prevents doxorubicin-induced apoptosis in RAW 264.7 macrophage cells by inhibiting p53 activation. Mol Cancer Res. 2005;3(7):373–379. doi:10.1158/1541-7786.MCR-05-0046. PMID:16046548
- Sawyer DB, Fukazawa R, Arstall MA, et al. Daunorubicin-induced apoptosis in rat cardiac myocytes is inhibited by dexrazoxane. Circ Res. 1999;84(3):257–265. doi:10.1161/01.RES.84.3.257. PMID:10024299
- Kotamraju S, Konorev EA, Joseph J, et al. Doxorubicin-induced apoptosis in endothelial cells and cardiomyocytes is ameliorated by nitrone spin traps and ebselen. Role of reactive oxygen and nitrogen species. J Biol Chem. 2000;275(43):33585–33592. doi:10.1074/jbc.M003890200. PMID:10899161
- Efferth T, Giaisi M, Merling A, et al. Artesunate induces ROS-mediated apoptosis in doxorubicin-resistant T leukemia cells. PLoS ONE. 2007;2(8):e693. doi:10.1371/journal.pone.0000693. PMID:17668070
- Eom YW, Kim MA, Park SS, et al. Two distinct modes of cell death induced by doxorubicin: apoptosis and cell death through mitotic catastrophe accompanied by senescence-like phenotype. Oncogene. 2005;24(30):4765–4777. doi:10.1038/sj.onc.1208627. PMID:15870702
- Sugimoto K, Tamayose K, Takagi M, et al. Activation of an ataxia telangiectasia mutation-dependent intra-S-phase checkpoint by anti-tumour drugs in HL-60 and human lymphoblastoid cells. Br J Haematol. 2000;110:819–825. doi:10.1046/j.1365-2141.2000.02304.x. PMID:11054063
- Sugimoto K, Sasaki M, Isobe Y, et al. Hsp90-inhibitor geldanamycin abrogates G2 arrest in p53-negative leukemia cell lines through the depletion of Chk. Oncogene. 2008;27(22):3091–3101. doi:10.1038/sj.onc.1210978. PMID:18071310
- Ho CC, Siu WY, Chow JP, et al. The relative contribution of CHK1 and CHK2 to Adriamycin-induced checkpoint. Exp Cell Res .2005;304(1):1–15. doi:10.1016/j.yexcr.2004.10.016. PMID:15707569
- Chen G, Wang F, Trachootham D, et al. Preferential killing of cancer cells with mitochondrial dysfunction by natural compounds. Mitochondrion. 2010;10(6):614–625. doi:10.1016/j.mito.2010.08.001. PMID:20713185
- Matzno S, Yamaguchi Y, Akiyoshi T, et al. An attempt to evaluate the effect of vitamin K3 using as an enhancer of anticancer agents. Biol Pharm Bull. 2008;31(6):1270–1273. doi:10.1248/bpb.31.1270. PMID:18520067
- Laux I, Nel A. Evidence that oxidative stress-induced apoptosis by menadione involves Fas-dependent and Fas-independent pathways. Clin Immunol. 2001;101(3):335–344. doi:10.1006/clim.2001.5129. PMID:11726226
- Akman SA, Dietrich M, Chlebowski R, et al. Modulation of cytotoxicity of menadione sodium bisulfite versus leukemia L1210 by the acid-soluble thiol pool. Cancer Res. 1985;45(11 Pt 1):5257–5262. PMID:2996758
- Baran I, Ganea C, Scordino A, et al. Effects of menadione, hydrogen peroxide and quercetin on apoptosis and delayed luminescence of human leukemia Jurkat T-cells. Cell Biochem Biophys. 2010;58(3):169–179. doi:10.1007/s12013-010-9104-1. PMID:20697976
- Baran I, Ganea C, Privitera S, et al. Detailed analysis of apoptosis and delayed luminescence of human leukemia Jurkat T cells after proton irradiation and treatments with oxidant agents and flavonoids. Oxid Med Cell Longev. 2012;2012:498914. doi:10.1155/2012/498914. PMID:22829956
- Bonilla-Porras AR, Jimenez-Del-Rio M, Velez-Pardo C. Vitamin K3 and vitamin C alone or in combination induced apoptosis in leukemia cells by a similar oxidative stress signalling mechanism. Cancer Cell Int. 2011;11:19. doi:10.1186/1475-2867-11-19. PMID:21663679
- Lamson DW, Plaza SM. The anticancer effects of vitamin K. Altern Med Rev. 2003;8(3):303–318. PMID:12946240
- Nutter LM, Cheng AL, Hung HL, et al. Menadione: spectrum of anticancer activity and effects on nucleotide metabolism in human neoplastic cell lines. Biochem Pharmacol. 1991;41(9):1283–1292. doi:10.1016/0006-2952(91)90099-Q. PMID:2018560
- Parekh HK, Mansuri-Torshizi H, Srivastava TS, et al. Circumvention of adriamycin resistance: effect of 2-methyl-1,4-naphthoquinone (vitamin K3) on drug cytotoxicity in sensitive and MDR P388 leukemia cells. Cancer Lett. 1992;61(2):147–156. doi:10.1016/0304-3835(92)90173-S. PMID:1730138
- Baran I, Ionescu D, Filippi A, et al. Novel insights into the antiproliferative effects and synergism of quercetin and menadione in human leukemia Jurkat T cells. Leuk Res. 2014;38(7):836–849. doi:10.1016/j.leukres.2014.04.010. PMID:24862793
- Tofolean IT, Ganea C, Ionescu D, et al. Cellular determinants involving mitochondrial dysfunction, oxidative stress and apoptosis correlate with the synergic cytotoxicity ofepigallocatechin-3-gallate and menadione in human leukemia Jurkat T cells. Pharmacol Res. 2016;103:300–317. doi:10.1016/j.phrs.2015.12.013. PMID:26687095
- Koopman G, Reutelingsperger CP, Kuijten GA, et al. Annexin V for flow cytometric detection of phosphatidylserine expression on B cells undergoing apoptosis. Blood. 1994;84(5):1415–1420. PMID:8068938
- Vermes I, Haanen C, Steffens-Nakken H, et al. A novel assay for apoptosis. Flow cytometric detection of phosphatidylserine expression on early apoptotic cells using fluorescein labelled Annexin V. J Immunol Methods. 1995;184(1):39–51. doi: 10.1016/0022-1759(95)00072-I. PMID:7622868
- Riccardi C, Nicoletti I. Analysis of apoptosis by propidium iodide staining and flow cytometry. Nat Protoc. 2006;1(3):1458–1461. doi:10.1038/nprot.2006.238. PMID:17406435
- Darzynkiewicz Z. Critical Aspects in Analysis of Cellular DNA Content. Curr Protoc Cytom. 2010;52:7.2:7.2.1–7.2.8. doi:10.1002/0471142956.cy0702s56. PMID:21455968
- Wlodkowic D, Telford W, Skommer J, et al. Apoptosis and beyond: cytometry in studies of programmed cell death. Methods Cell Biol. 2011;103:55–98. doi:10.1016/B978-0-12-385493-3.00004-8. PMID:21722800
- Goodman MF, Lee G. Adriamycin interactions with T4 DNA Polymerase. J Biol Chem. 1977;252:2670–2674. PMID:323251
- Goormaghtigh E, Huart P, Praet M, et al. Structure of the adriamycin-cardiolipin complex. Role in mitochondrial toxicity. Biophys Chem. 1990;35(2-3):247–257. doi:10.1016/0301-4622(90)80012-V. PMID:2204444
- Nicolay K, de Kruijff B. Effects of adriamycin on respiratory chain activities in mitochondria from rat liver, rat heart and bovine heart. Evidence for a preferential inhibition of complex III and IV. Biochim Biophys Acta. 1987;892(3):320–330. doi:10.1016/0005-2728(87)90236-2. PMID:3036220
- Gao X, Dinkova-Kostova AT, Talalay P. Powerful and prolonged protection of human retinal pigment epithelial cells, keratinocytes, and mouse leukemia cells against oxidative damage: the indirect antioxidant effects of sulforaphane. Proc Natl Acad Sci USA. 2001;98(26):15221–15226. doi:10.1073/pnas.261572998. PMID:11752465
- Gorczyca W, Gong J, Ardelt B, et al. The cell cycle related differences in susceptibility of HL-60 cells to apoptosis induced by various antitumor agents. Cancer Res. 1993;53(13):3186–3192. PMID:8319228
- Bedner E, Smolewski P, Amstad P, et al. Activation of caspases measured in situ by binding of fluorochrome-labeled inhibitors of caspases (FLICA): correlation with DNA fragmentation. Exp Cell Res. 2000;259(1):308–313. doi: 10.1006/excr.2000.4955. PMID:10942603