
ABSTRACT
Metabolic reprogramming is a hallmark of many cancer types, including hepatocellular carcinoma (HCC). Identifying the critical players in this process might be crucial for the generation of novel and effective anti-neoplastic therapies. In the present investigation, we determined the importance of carbohydrate responsive element binding protein (ChREBP), a central player in the regulation of lipid and glucose metabolism in the liver, on the development of HCC in in vitro and in vivo models. We found that genetic deletion of ChREBP (that will be referred to as ChREBPKO mice) strongly delays or impairs hepatocarcinogenesis driven by AKT or AKT/c-Met overexpression in mice, respectively. In contrast, HCC development was found to be completely unaffected by ChREBP depletion in mice co-expressing AKT and N-Ras protooncogenes. In mouse and human HCC cell lines, suppression of ChREBP via specific small interfering RNAs (siRNAs) resulted in decreased proliferation and induction of apoptosis. Of note, these cellular events were strongly augmented by concomitant inhibition of the mitogen-activated protein kinase (MAPK) pathway. The present data indicate that ChREBP activity might be required or dispensable for HCC growth, depending on the oncogenes involved. In particular, the activation of Ras/MAPK signaling might represent a possible mechanism of resistance to ChREBP depletion in this tumor type. Additional studies are needed to unravel the molecular mechanisms rendering HCC cells insensitive to ChREBP suppression.
Introduction
Hepatocellular carcinoma (HCC) is one of the most frequent and lethal tumors worldwide [Citation1]. While surgical resection and liver transplantation are effective options in the treatment of early-stage disease, therapeutic approaches for advanced HCC are very limited. In particular, molecularly-based targeted therapies have been unsuccessful to date, with only the multikinase inhibitors Sorafenib and Regorafenib being approved by the Food and Drug Administration for late-stage HCC, yet possessing almost negligible benefits for the patients in terms of survival [Citation2,Citation3]. Thus, the elucidation of the molecular pathogenesis of HCC is imperative for the development of alternative therapeutic strategies with improved potency against this deadly disease.
Metabolic reprogramming has been established as one of the key features of cancer cells [Citation4–Citation7]. Specifically, changes in tumor bioenergetics, consisting of elevation of glycolysis, upregulation of lipid and amino acid metabolism, increased glutaminolysis, enhanced mitochondrial biogenesis, and induction of the pentose phosphate pathway, are almost universally detected in most cancer types, and often negatively correlated with the prognosis of the patients [Citation4–Citation7]. In particular, different from normal cells, tumor cells use glycolysis for their metabolic needs regardless of oxygen supply conditions (a phenomenon known as the “Warburg effect” or “aerobic glycolysis”) [Citation8]. Furthermore, while energy-providing lipids come almost exclusively from dietary lipids in adult organs, a considerable induction of lipid biosynthesis (“de novo lipogenesis”) occurs in cancer cells [Citation9–Citation11]. The aforementioned differences in bioenergetic features between normal and cancer cells might result in tumor cell dependence from these alterations and envisage the possibility to selectively target the related metabolic pathways in cancer.
In HCC, deregulation of de novo lipogenesis and glycolysis has been extensively investigated and recognized as an important pathogenetic player along experimental and human hepatocarcinogenesis [Citation12–Citation19]. In addition, levels of various glycolytic and lipogenic proteins have been shown to be directly correlated with HCC biological aggressiveness and inversely with the length of patient’s survival [Citation12–Citation18]. In light of these previous findings, considerable efforts should be devoted to identify key metabolic candidates whose inactivation might severely impair hepatocarcinogenesis while sparing normal cells. Previously, it has been demonstrated that alterations of glucose and lipid metabolism in HCC of humans and rodents are paralleled by the strong upregulation of carbohydrate-responsive element binding protein (ChREBP) transcription factor [Citation13,Citation19,Citation20]. Together with the sterol regulatory element binding protein-1c (SREBP-1c) gene, ChREBP is a major positive regulator of glucose and lipid metabolism in the liver [Citation21–Citation25]. Thus, due to this role, and in light of the finding of ChREBP upregulation in human HCC tissues, it can be hypothesized that ChREBP represents a promising candidate for targeted therapies against HCC.
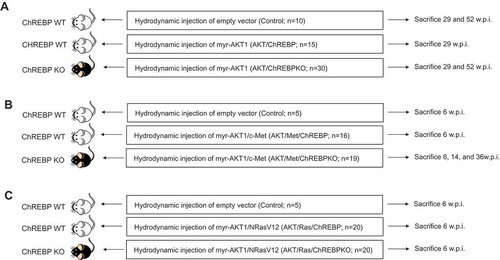
In the present investigation, using genetic approaches, we determined the functional importance of ChREBP in preclinical mouse models of HCC. For this purpose, an activated/myristoylated form of the AKT1 protooncogene (myr-AKT1) [Citation13] has been hydrodynamically injected, either alone or in combination with c-Met or a mutant form of NRas (NRasV12) in the livers of ChREBP wild-type and knockout mice (–)). Hepatocarcinogenesis was accurately monitored in these mice and liver lesions histopathologically characterized. In addition, we assessed the role of ChREBP on the growth of human and mouse cell lines in vitro. Finally, we evaluated the eventual prognostic role of ChREBP in a cohort of human HCC specimens.
Figure 1. Schematic representation of the in vivo experiments conducted. Specifically, ChREBP wild-type (ChREBPWT) and knockout (ChREBPKO) mice were transfected with a myristoylated/activated form of AKT1 (myr-AKT1), either alone (a) or in association with c-Met (b) or an oncogenic form of NRas (NRasV12; c), via hydrodynamic gene delivery. ChREBPWT were also injected with the empty vector (control). Mouse were monitored daily by abdominal palpation and sacrificed when palpable masses were appreciable. The number of mice used for the experiments is indicated. Abbreviation: w.p.i., weeks post injection.
Results
ChREBP depletion strongly delays AKT-dependent hepatocarcinogenesis in mice
Previously, we showed that myr-AKT1 alone suffices to induce HCC development when overexpressed in the mouse liver. At the molecular level, AKT preneoplastic and neoplastic liver lesions were characterized by ChREBP upregulation [Citation13]. To determine whether ChREBP is required for AKT induced hepatocarcinogenesis, we hydrodynamically transfected the myr-AKT1 construct into ChREBP wild-type (n = 15; they will be referred to as AKT/ChREBP mice) and ChREBP knockout (n = 30; they will be referred to as AKT/ChREBPKO mice) mouse livers. Ten additional ChREBP WT mice were injected with empty vector and used as control mice (control mice) ()). Fifteen AKT/ChREBP and AKT/ChREBPKO mice as well as five control mice were harvested 29 weeks after hydrodynamic injection, when AKT overexpression results in high tumor burden and mice require to be euthanized [Citation13]. In accordance with previous data, while control mice did not show any macroscopic and microscopic alteration (data not shown), overexpression of AKT resulted in high tumor burden ()) as well as increased body and liver weight and, consequently, liver/body weight ratio, in all AKT/ChREBP mice when compared to control mice (). In contrast, scattered liver preneoplastic lesions were detected in all AKT/ChREBPKO mice at this time point ()). Only two of 15 (13.3%) AKT/ChREBPKO mice developed small hepatocellular tumors (not shown). Histologically, preneoplastic lesions from AKT/ChREBP mice (in C57BL/6J genetic background) were indistinguishable from those previously induced by AKT overexpression in the FVB/N genetic background, consisting of lipid- and glycogen-rich, enlarged hepatocytes ()) [Citation13]. To determine whether hepatocarcinogenesis was impaired or delayed in AKT-transfected mice following depletion of ChREBP, the remaining fifteen AKT/ChREBPKO mice and five control mice were aged and sacrificed 52 weeks after hydrodynamic injection. At this time point, most of the liver parenchyma was occupied by preneoplastic lesions in all AKT/ChREBPKO mice (); left panels), whereas no alterations were appreciable in control mice (not shown). Preneoplastic lesions consisted of extremely large, ballooned hepatocytes (); left panels) and were identical to those induced by insulin in diabetic ChREBP KO mouse livers subjected to intraportal pancreatic islet transplantation [Citation20]. Furthermore, three of fifteen (20%) AKT/ChREBPKO mice displayed the presence of liver tumors (); right panels). At the cellular level, AKT/ChREBP mouse livers exhibited the highest rate of proliferation (as assessed by Ki67 index; ,,)), which was associated with strong upregulation of genes promoting cell cycle progression, such as polo-like kinase 1 (Plk1), S-phase kinase-associated protein 2 (Skp2), and Forkhead box protein M1 (Foxm1) (–)). At the metabolic level, as expected, AKT/ChREBP mouse livers showed the highest levels of ChREBP canonical targets involved in lipogenesis and glycolysis, such as fatty acid synthase (Fasn), acetyl-CoA carboxylase (Acac), stearoyl-CoA-desaturase 1 (Scd1), and pyruvate kinase L/R (Pklr) (Supplementary Figure 1A-E). In accordance with gene expression data, levels of triglycerides, free fatty acids, and glycolysis (that was assessed by lactic dehydrogenase and enolase activity), were most elevated in AKT/ChREBP mice (–)). Also, Oil Red O staining, which reveals neutral triglycerides and lipids, showed extensive positivity in AKT/ChREBP -but not- AKT/ChREBPKO lesions (Supplementary Figure 2A,B). In addition, the activity of glucose-6-phosphate dehydrogenase, a ChREBP specific target in the pentose phosphate shunt [Citation23,Citation24], was highest in AKT/ChREBP mice ()). Of note, the alterations in metabolism detected in AKT/ChREBP livers closely recapitulate the peculiar changes in bioenergetics detected in human and experimental carcinogenesis [Citation4–Citation7], including HCC [Citation12–Citation19].
Figure 2. Genetic depletion of ChREBP strongly delays hepatocarcinogenesis driven by AKT overexpression in the mouse. (a) Overexpression of myr-AKT1 promoted the development of multiple liver tumors by 29 weeks post hydrodynamic injection in ChREBP WT mice (indicated as AKT/ChREBP). Macroscopically, livers of AKT/ChREBP mice were enlarged, pale, and characterized by the presence of numerous nodules occupying the whole surface. Microscopically, the liver parenchyma of AKT/ChREBP mice was occupied by large hepatocellular tumors containing areas of necrosis (N). Importantly, tumors displayed a homogeneous immunoreactivity for HA-tagged AKT (insets), implying their origin from hydrodynamically transfected cells. (a; lower panel). (b) In striking contrast, overexpression of AKT in ChREBP KO mice (indicated as AKT/ChREBPKO) resulted in delayed hepatocarcinogenesis at the same time point. Livers of AKT/ChREBKO mice appeared normal macroscopically and displayed the presence of isolated or small clusters of altered cells at the microscopic level. As expected, the scattered altered hepatocytes exhibited immunolabeling for HA-Tagged AKT (inset). (c; left panels). Fifty-two weeks after hydrodynamic injection, a large fraction of AKT/ChREBPKO liver parenchyma was occupied by altered hepatocytes, characterized by a strikingly enlarged cytoplasm. (c; right panels). Furthermore, the liver of three of fifteen (20%) AKT/ChREBPKO mice displayed the presence of tumor nodules macroscopically appreciable (indicated by arrow). Microscopically, the nodular lesions consisted of clear-cell hepatocellular carcinomas. Original magnifications: 40x and 100x. Scale bar: 500µm for 40x, 100µm for 100x. Abbreviations: HE, hematoxylin and eosin; w.p.i., weeks post injection.
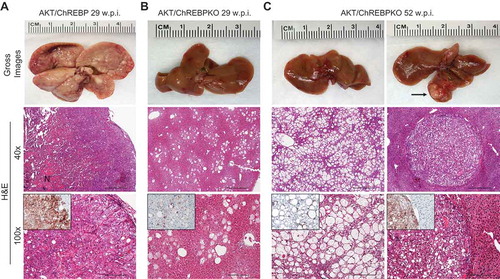
Figure 3. Effect of ChREBP gene knockout on body, liver, and metabolic parameters in mice subjected to AKT overexpression by hydrodynamic gene transfer. Control (injected with empty vector; n = 10) and AKT/ChREBP mice (n = 15) were sacrificed 29 weeks post injection (w.p.i.). AKT/ChREBPKO mice (n = 15 for each group) were sacrificed at two distinct time points: 29 w.p.i. (indicated as AKT/ChREBPKO I) and 52 w.p.i. (AKT/ChREBPKO II), respectively. Tukey–Kramer test: P < 0.001 a, vs control; b, vs AKT/ChREBP; c, vs AKT/ChREBPKO I mice. Abbreviations: FA, fatty acids; ENO, enolase activity; G6PDH, glucose 6-phosphate dehydrogenase activity; LDH, lactate dehydrogenase activity; TG, triglycerides.
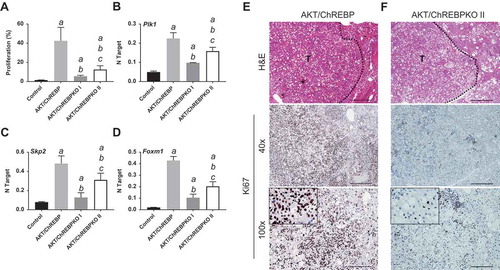
Figure 4. Depletion of ChREBP results in decreased proliferation rate of AKT-overexpressing lesions. AKT/ChREBP mice (n = 15) were sacrificed 29 weeks post injection (w.p.i.). AKT/ChREBPKO mice (n = 15 for each group) were sacrificed at two distinct time points: 29 w.p.i. (indicated as AKT/ChREBPKO I) and 52 w.p.i. (AKT/ChREBPKO II), respectively. (a) Differences in proliferation indices (as assessed by Ki67 index) between controls (injected with empty vector), AKT/ChREBP, AKT/ChREBPKO I, and AKT/ChREBPKO II mice. (b–d). Differences in the mRNA levels of proliferation promoting genes (Plk1, Skp2, and Foxm1; as determined by quantitative real-time RT-PCR) in the same mouse cohorts. Quantitative values for Plk1, Skp2, and Foxm1 mRNA were calculated by using the PE Biosystems Analysis software and expressed as Number target (NT). NT = 2−ΔCt, wherein ΔCt value of each sample was calculated by subtracting the average Ct value of the target gene from the average Ct value of the β-Actin gene (housekeeping gene). Tukey–Kramer test: P < 0.0005 a, vs control (mice injected with empty vector); b, vs AKT/ChREBP; c, vs AKT/ChREBPKO I mice. (e) Large AKT/ChREBP HCC (T) characterized by very high rate of proliferation. (f) Low proliferative activity in an AKT/ChREBPKO II HCC (T). The striking differences in proliferation degree can be better appreciated in insets. HCC are demarcated from the surrounding non-tumorous tissue with dotted lines. Original magnifications: 40x and 100x in the large pictures, 400x in insets. Scale bar: 500µm for 40x, 100µm for 100x. Abbreviations: HE, hematoxylin and eosin staining; T, tumor (HCC).
Altogether, the present data indicate that loss of ChREBP significantly delays liver tumor development in AKT-overexpressing livers.
Deletion of ChREBP impairs AKT/c-Met hepatocarcinogenesis
Next, we determined whether the simultaneous overexpression of another oncogene dependent on lipogenesis confers resistance to ChREBP inactivation in AKT mice. For this purpose, we co-injected hydrodynamically myr-AKT1 and c-Met into the livers of ChREBP WT and ChREBP KO mice (that will be referred to as AKT/Met/ChREBP and AKT/Met/ChREBPKO mice, respectively; n = 16 and n = 19, respectively) ()). Previously, we showed that AKT/c-Met co-injection in the mouse liver (AKT/Met mice) tremendously accelerates HCC development [Citation26], although hepatocarcinogenesis was found to be equally repressed in AKT and AKT/Met mice following Fasn deletion [Citation27]. While all sixteen AKT/Met/ChREBP mice required to be euthanized by 6 weeks after hydrodynamic injection due to high tumor burden ()), in accordance with previous data [Citation26], all AKT/Met/ChREBPKO mice looked healthy by physical examination at the same time point. Upon sacrifice, the liver of AKT/Met/ChREBP KO mice (n = 8) was completely normal (not shown). The same histological phenotype was detected in 8 additional AKT/Met/ChREBPKO mice, which were sacrificed 14 weeks post hydrodynamic injection ()). While AKT/Met/ChREBP mice displayed the highest liver and body weight as well as liver/body weight ratio, no significant differences were detected in these parameters between AKT/Met/ChREBPKO and control mice (–). Furthermore, three AKT/Met/ChREBPKO mice were aged and sacrificed 36 weeks post injection. Once again, AKT/Met/ChREBPKO livers did not show any macroscopic or histopathological alteration and were indistinguishable from those of control mice (not shown).
Figure 5. Genetic depletion of ChREBP abolishes AKT/Met-driven hepatocarcinogenesis in mice. (a) Overexpression of myr-AKT1 and c-Met protooncogenes promoted the development of multiple liver tumors within 6 weeks post hydrodynamic injection (w.p.i) in mice with wild-type ChREBP gene (indicated as AKT/Met/ChREBP). Macroscopically (gross images), livers of AKT/Met/ChREBP mice appeared pale, enlarged, and characterized by the presence of numerous nodules. Microscopically, the liver parenchyma of AKT/Met/ChREBP mice was occupied by numerous hepatocellular tumors (T) composed by clear cell neoplastic hepatocytes with an enlarged, clear cytoplasm due to lipid accumulation. (b) Remarkably, hepatocarcinogenesis was completely suppressed when overexpression of AKT/c-Met was conducted in CHREBP KO mice (indicated as AKT/Met/ChREBPKO). Indeed, livers of AKT/Met/ChREBPKO mice were normal both macroscopically and microscopically, indistinguishable from control livers also in terms of body (c) and liver (d) weight and, consequently, liver/body weight ratio (e). Original magnifications: 40x and 100x. Scale bar: 500µm for 40x, 100µm for 100x. Tukey–Kramer test: P < 0.0001 a, vs control (mice injected with empty vector); b, vs AKT/Met/ChREBP mice. Abbreviation: H&E, hematoxylin and eosin.
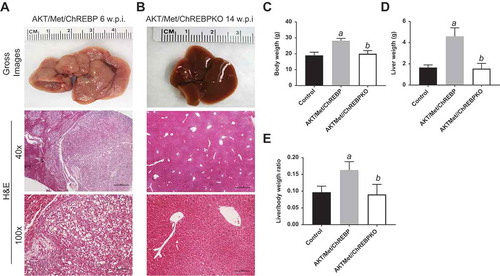
These findings indicate that ChREBP activity is required for AKT/Met mouse hepatocarcinogenesis.
ChREBP is dispensable for AKT/Ras induced liver cancer development
Subsequently, we investigated the functional importance of ChREBP in aggressive hepatocarcinogenesis driven by co-expression of myr-AKT1 and an activated form of NRas (NRasV12) [Citation28]. Our goal was to determine the effect of activation of the Ras/mitogen-activated protein kinase (MAPK) cascade, a signaling pathway almost ubiquitously induced in human HCC [Citation29], on the growth suppression induced by ChREBP in AKT-overexpressing livers. Thus, we hydrodynamically transfected the myr-AKT1/NRasV12 constructs into ChREBP WT (n = 20; they will be referred to as AKT/Ras/ChREBP mice) and ChREBP KO (n = 20; they will be referred to as AKT/Ras/ChREBPKO mice) mouse livers ()). Notably, in contrast to that described for AKT and AKT/Met mice, ChREBP depletion had no effect on AKT/Ras hepatocarcinogenesis. Indeed, both AKT/Ras/ChREBP and AKT/Ras/ChREBPKO mice developed lethal burden of liver tumors by ~6 weeks post injection (,)). Histologically, multiple HCC and cholangiocarcinomas were detected in the two mouse cohorts, with no evident differences (,)). In addition, no significant differences were observed in body and liver weight and, consequently, in liver/body weight ratio, between the two AKT/Ras cohorts. Furthermore, the proliferation rate of AKT/Ras/ChREBP and AKT/Ras/ChREBPKO livers was equivalent (48.5 ± 8.5 vs 46.0 ± 10.0; not significant).
Figure 6. Genetic ablation of ChREBP in the mouse liver does not affect tumor development driven by AKT/Ras co-expression. (a,b) Overexpression of AKT/Ras triggered the development of multiple hepatocellular carcinomas and cholangiocarcinomas both in ChREBP WT (AKT/Ras/ChREBP; n = 20) and ChREBP KO (AKT/Ras/ChREBPKO; n = 20) mice. Tumors in the two mouse cohorts developed with the same latency and were indistinguishable histopathologically (a,b) as well as in body weight (c), liver weight (d), and liver/body weight ratio (e). Original magnifications: 40x and 100x. Scale bar: 500µm for 40x, 100µm for 100x. Abbreviations: HE, hematoxylin and eosin staining; w.p.i, weeks post injection. Tukey–Kramer test: P < 0.0001 a, vs control (mice injected with empty vector).
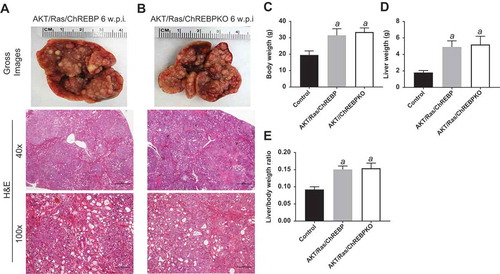
In summary, the present data indicate that, different from AKT-driven liver tumor development, ChREBP activity is not required for hepatocarcinogenesis induced by AKT/NRas co-expression. Activation of the Ras/MAPK signaling might be responsible for resistance to growth inhibition by ChREBP depletion in AKT-overexpressing liver lesions.
Concomitant suppression of ChREBP and MAPK cascade induces pronounced growth restraint in AKT/Ras and human HCC cells
Successively, we assessed the importance of ChREBP on the in vitro growth of HCC cell lines. For this purpose, the ChREBP gene was knocked-down in the murine AKT/Ras cell line [Citation30] via specific small interfering RNA (siRNA) ()). As expected, siRNA treatment led to a strong decrease of ChREBP protein ()) and mRNA ()) levels. Similar to the in vivo model, ChREBP silencing had very limited effects on proliferation ()) and apoptosis ()) of AKT/Ras cells. Decline in proliferation and increase in apoptosis were detected instead in the AKT/Ras cell line treated with the mitogen-activated protein kinase kinase (MEK) inhibitor U0126 (), in accordance with a previous study from our group [Citation31]. At the molecular level, downregulation of ChREBP targets, FASN and SCD1, was observed both at protein ()) and mRNA level (,)), while no changes occurred in phosphorylated/activated extracellular signal–regulated kinase (ERK1/2) proteins, confirming the lack of sensitivity of this pathway to ChREBP depletion ()). Strikingly, simultaneous inactivation of ChREBP and the MEK/ERK cascade achieved by the combination of ChREBP silencing and U0126 administration, resulted in a synergistic anti-growth effect, leading to strong decline of proliferation and massive apoptosis (,)). Of note, concomitant ChREBP silencing and U0126 triggered a strong reduction of glycolysis (as assessed by LDH activity) and the pentose phosphate pathway (as determined by G6PDH activity), whereas fatty acid synthesis was significantly reduced only in ChREBP-depleted cells, with no additional decline in fatty synthesis when U0126 was simultaneously administered with ChREBP siRNA (–). In addition, while the combination treatment did not show a more pronounced decrease of FASN and SCD1 protein ()) and mRNA levels (,)) when compared with silencing of ChREBP alone (, ), a marked reduction of Plk1, Skp2, and Foxm1 mRNA levels was observed by concomitant suppression of ChREBP and MEK/ERK axes (–)).
Figure 7. Suppression of ChREBP gene by specific siRNA for 48h induces downregulation of FASN and SCD1 targets, without effect on phosphorylated ERK1/2 proteins in the AKT/Ras mouse HCC cell line. (a) Effects on the levels of the selected proteins (as assessed by Western blot analysis) are shown. β-Actin was used as a loading control. (b,c) Knockdown of ChREBP in association with the MEK inhibitor U0126 for 48h triggers downregulation of proliferation and induction of apoptosis. Cell proliferation was analyzed using the BrdU Cell Proliferation Assay Kit (Cell Signaling Technology Inc.). Apoptosis was assessed with the Cell Death Detection Elisa Plus Kit (Roche Molecular Biochemicals). (d–f) Combined administration of ChREBP siRNA and U0126 synergistically downregulates glycolysis (as assessed by LDH activity; E) and the pentose phosphate shunt (as determined by glucose 6-phosphate dehydrogenase activity; F), but only ChREBP silencing negatively affects fatty acid synthesis (D). Fatty acid synthesis was measured in AKT/Ras HCC cells by incorporation of [U-[Citation14]C]acetate into lipids as described [Citation13]. Specifically, AKT/Ras cells were cultured in 96-well plates at 2.0 x 10[Citation3]/well and incubated overnight. After the addition of specific siRNAs, vehicle, or inhibitors as indicated, cells were pulse-labelled with [U-[Citation14]C]acetate, 1 μCi/well for 48 hours. Lipids were Folch extracted and counted for [Citation14]C. Experiments were conducted three times in triplicate. Tukey–Kramer test: at least P < 0.001 a, vs scrambled siRNA; b, vs DMSO (solvent); c, vs U0126; d, vs ChREBP siRNA. Abbreviations: FA, fatty acids; U0, U0126.
![Figure 7. Suppression of ChREBP gene by specific siRNA for 48h induces downregulation of FASN and SCD1 targets, without effect on phosphorylated ERK1/2 proteins in the AKT/Ras mouse HCC cell line. (a) Effects on the levels of the selected proteins (as assessed by Western blot analysis) are shown. β-Actin was used as a loading control. (b,c) Knockdown of ChREBP in association with the MEK inhibitor U0126 for 48h triggers downregulation of proliferation and induction of apoptosis. Cell proliferation was analyzed using the BrdU Cell Proliferation Assay Kit (Cell Signaling Technology Inc.). Apoptosis was assessed with the Cell Death Detection Elisa Plus Kit (Roche Molecular Biochemicals). (d–f) Combined administration of ChREBP siRNA and U0126 synergistically downregulates glycolysis (as assessed by LDH activity; E) and the pentose phosphate shunt (as determined by glucose 6-phosphate dehydrogenase activity; F), but only ChREBP silencing negatively affects fatty acid synthesis (D). Fatty acid synthesis was measured in AKT/Ras HCC cells by incorporation of [U-[Citation14]C]acetate into lipids as described [Citation13]. Specifically, AKT/Ras cells were cultured in 96-well plates at 2.0 x 10[Citation3]/well and incubated overnight. After the addition of specific siRNAs, vehicle, or inhibitors as indicated, cells were pulse-labelled with [U-[Citation14]C]acetate, 1 μCi/well for 48 hours. Lipids were Folch extracted and counted for [Citation14]C. Experiments were conducted three times in triplicate. Tukey–Kramer test: at least P < 0.001 a, vs scrambled siRNA; b, vs DMSO (solvent); c, vs U0126; d, vs ChREBP siRNA. Abbreviations: FA, fatty acids; U0, U0126.](/cms/asset/80e227b1-93a1-4636-9538-b18544a8d8d6/kccy_a_1489182_f0007_b.gif)
Figure 8. Chrebp silencing by specific siRNA for 48h induces downregulation of Fasn and Scd1 targets and cooperates with the MEK inhibitor U0126 to downregulated Plk1, Skp2, and Foxm1 genes (as determined by quantitative real-time RT-PCR) in the AKT/Ras mouse HCC cell line. Quantitative values for Chrebp, Fasn, Scd1, Plk1, Skp2, and Foxm1 mRNA levels were calculated by using the PE Biosystems Analysis software and expressed as Number target (NT). NT = 2−ΔCt, wherein ΔCt value of each sample was calculated by subtracting the average Ct value of the target gene from the average Ct value of the β-Actin gene (housekeeping gene). Experiments were conducted three times in triplicate. Tukey–Kramer test: at least P < 0.001 a, vs scrambled siRNA; b, vs DMSO (solvent); c, vs U0126; d, vs ChREBP siRNA.
In the human HLE cell line, effective silencing of ChREBP via siRNA (Supplementary Figure 3A) led to reduction of proliferation and increase of apoptosis (Supplementary Figure 3B,C), implying a role for ChREBP in the growth and survival of human HCC cells. At the molecular level, similar to AKT/Ras cells, no changes were detected in phosphorylated/activated ERK1/2 proteins. Once again, a much more pronounced decline of proliferation and rise of apoptosis as well as glycolysis, pentose phosphate shunt (Supplementary Figure 3B,C,E,F), and PLK1, SKP2, and FOXM1 gene expression levels (Supplementary Figure 4A-F) was obtained in the same cell line when ChREBP silencing was associated to treatment with the MEK inhibitor U0126. Furthermore, U0126 did not further augment the decline in fatty acid synthesis induced by ChREBP knockdown (Supplementary Figure 3D). Equivalent results were observed in human Hep3B and MHCC97H HCC cell lines (data not shown).
Altogether, the present data indicate that robust growth restraint can be achieved in HCC cells when subjected to concomitant inactivation of ChREBP and the MAPK/ERK pathway.
Levels of ChREBP are associated with poor prognosis of HCC patients
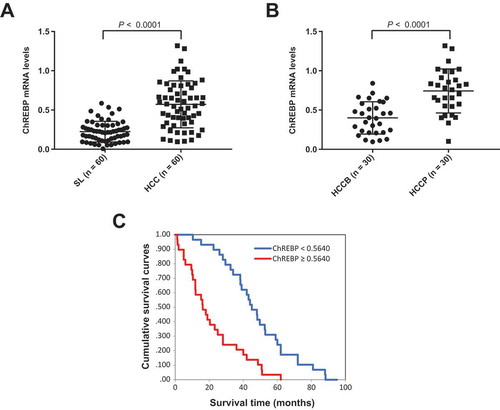
Finally, we evaluated the mRNA levels of ChREBP in a human HCC cohort whose clinicopathological data were available (n = 60; Supplementary Table 1). We found that ChREBP expression levels were significantly higher in HCC than in corresponding non-tumorous livers ()). Furthermore, ChREBP mRNA expression was significantly more elevated in HCC samples with poorer prognosis (HCCP) when compared with those with better prognosis (HCCB), in accordance with previous studies ()) [Citation13]. When assessing the relationship between ChREBP and patients’ clinicopathological data, we found that higher expression of the ChREBP gene correlates with lower HCC survival rate ()). This association remained strongly significant after multivariate Cox regression analysis (P < 0.0001; Supplementary Table 2), indicating that ChREBP is an independent prognostic factor for HCC. No relationship between the mRNA levels of ChREBP and other clinicopathological features of the patients, including age, gender, etiology, presence of cirrhosis, tumor size, and tumor grade were detected (Supplementary Table 2).
Figure 9. ChREBP is overexpressed in human hepatocellular carcinoma (HCC). (a) Levels of ChREBP mRNA were significantly more elevated in HCC (n = 60) than corresponding non-tumorous surrounding livers (SL; n = 60), as detected by quantitative reverse-transcription PCR. Number target (NT) = 2−ΔCt, wherein ΔCt value of each sample was calculated by subtracting the average Ct value of the ChREBP gene from the average Ct value of the β-actin gene. Mann–Whitney test: a, vs SL, P < 0.0001. (b) Levels of ChREBP mRNA are significantly higher in HCC with poorer outcome (HCCP) than in tumors with better prognosis (HCCB). Mann–Whitney test: a, vs HCCB, P < 0.0001. (c) Kaplan–Meier survival curves of human HCC with high and low ChREBP mRNA levels, showing the unfavorable outcome of patients with high ChREBP mRNA expression.
Discussion
Targeting specific metabolic pathways whose activity is required for tumor growth is an emerging therapeutic approach in experimental and clinical oncology. In particular, a mounting body of evidence implies aberrant lipogenesis, glycolysis, and the pentose phosphate shunt as critical supporters for malignant transformation as well as for tumor aggressiveness in many cancer types [Citation4–Citation11]. Thus, the identification of “metabolic oncogenes” or “metabolic supporting genes” (genes whose metabolic properties sustain cancer growth) is of prime importance for the development of novel, specific, and effective anti-neoplastic therapies. In this scenario, it is not surprising that cumulating data point to a possible role of the ChREBP transcription factor in cancer [Citation23,Citation24]. Indeed, ChREBP is a central regulator of metabolism in various cell types in response to environmental and hormonal stimuli, through its ability to modulate lipogenesis, glycolysis, and the pentose phosphate pathway [Citation23,Citation24]. In hepablastoma and colorectal cancer cells, for instance, it has been shown that ChREBP inactivation triggers a metabolic switch from aerobic glycolysis to mitochondrial respiration, reduces lipogenesis, and decreases growth in tumor xenografts [Citation32]. Also, increased immunoreactivity for ChREBP protein was detected in invasive ductal carcinoma of the breast, where positively associates with malignant progression [Citation33]. In prostate cancer, ChREBP contributes to the proliferation of tumor cells and favors androgen transcriptional activity [Citation34,Citation35]. In striking contrast, downregulation of ChREBP by the TGFβ/Snail axis was found to be a critical step in epithelial to mesenchymal transition along non-small-cell lung cancer metastasization [Citation36]. In addition, deletion of ChREBP promoted the blockade of differentiation of leukemia-initiating cells and markedly reduced survival in ChREBP-null leukemic mice, thus acting as a bona fide tumor suppressor [Citation37]. These contrasting and puzzling data suggest that ChREBP function in oncogenesis is complex. Presumably, as it has been hypothesized [Citation23,Citation24], its expression and role in malignant cells depend on the tissue type and specific metabolic needs as well as on ChREBP molecular interactors.
In the present study, we addressed the role of ChREBP in HCC. In accordance with previous findings from our group using a different HCC sample collection [Citation13], we showed here that ChREBP levels are upregulated in human HCC specimens, especially in tumors characterized by an unfavorable outcome. Furthermore, although the data should be validated in independent and larger HCC cohorts, the present observations suggest that ChREBP overexpression might be an important, negative prognostic marker in this tumor type. In addition, we investigated the functional role of ChREBP using in vitro and in vivo approaches. We found that ChREBP plays a pivotal function in supporting mouse hepatocarcinogenesis induced by AKT and c-Met, two proto-oncogenes frequently activated in human HCC. In particular, our results indicate that ChREBP genetic deletion strongly delays AKT driven hepatocarcinogenesis, whereas it completely abolishes AKT/c-Met dependent liver tumor development. It is noteworthy to underline that the antineoplastic effect was more remarkable in AKT/Met than AKT mice, despite the fact that hepatocarcinogenesis is significantly faster and more aggressive in the former group. Evidently, AKT and c-Met cooperation converges to signaling modules where the presence of ChREBP is strictly required. Previously, we found that deletion of Fasn, the master regulator of de novo lipogenesis, completely suppresses hepatocarcinogenesis in AKT and AKT/Met mice [Citation26,Citation27]. Although the FASN gene is a ChREBP specific target in the liver [Citation20,Citation21], the mechanisms responsible for tumor inhibition in Fasn- and ChREBP-deleted mice might be at least partly different. Indeed, while lipogenesis was totally impaired and no preneoplastic and neoplastic lesions developed in AKT and AKT/Met mice depleted of Fasn [Citation26,Citation27], preneoplastic lesions and HCC (although at a very low rate) eventually occurred in AKT mice under the ChREBP KO background. A possible explanation is that, although levels of Fasn gene were significantly lower in AKT/ChREBPKO than AKT/ChREBP mouse lesions, a progressive upregulation of Fasn was detected also in AKT/ChREBPKO lesions in a time-dependent manner (Supplementary Figure 1B), thus presumably allowing their slow growth. In addition, since we found that ChREBP ablation is also accompanied by decrease in glycolysis and pentose phosphate shunt activity in AKT-overexpressing livers as well as in mouse and human HCC cell lines, it is highly likely that other bioenergetic pathways might contribute to the antineoplastic effect induced by ChREBP loss. Further studies in vitro and in vivo are necessary to define the specific role of each metabolic pathway in AKT-driven hepatocarcinogenesis. Furthermore, silencing of selected members of the glycolytic cascade and the pentose phosphate pathway should be employed to precisely identify the ChREBP critical metabolic targets supporting liver tumor development induced by AKT overexpression. However, we cannot exclude that the anti-neoplastic effects exerted by ChREBP depletion on HCC growth depend also on mechanisms beyond bioenergetic reprogramming. In accordance with this hypothesis, it has been shown that, besides its metabolic targets, ChREBP associates with and regulates a plethora of genes involved in proliferation, transport, development, and cell motility [Citation38,Citation39]. In accordance with this hypothesis, we found that knockdown of ChREBP results in low proliferation rate of AKT-overexpressing tumors as well as limited upregulation of Plk1, Skp2, and Foxm1 pro-replication genes. Further investigation is required to unravel the exact mechanisms of ChREBP contribution to tumorigenesis in HCC through its metabolic and non-metabolic properties.
A major result of the present investigation is the finding that the simultaneous overexpression of AKT and mutant Ras in the liver results in tumor development that is fully resistant to ChREBP depletion. Indeed, AKT/Ras mice exhibited a high tumor burden by 6 weeks post hydrodynamic injection and required to be euthanized irrespective of ChREBP gene status. In addition, while deletion of the Fasn gene led to abolishment of hepatocellular (but not cholangiocellular) lesions in AKT/Ras mice, no effect on hepatocellular lesions incidence or development by ChREBP depletion was observed. These data further support the hypothesis that the anti-oncogenic properties triggered by ChREBP inactivation are, at least partly, lipogenesis independent. The molecular mechanisms underlying AKT/Ras driven unresponsiveness to growth inhibition by ChREBP depletion remain obscure. Nonetheless, we showed that activation of the Ras/MAPK/ERK pathway might represent an important mechanism of resistance to ChREBP suppression, at least in vitro. Indeed, we found that activation of ERK proteins is not affected by silencing of ChREBP in human and mouse HCC cell lines and that concomitant inactivation of ChREBP and Ras/MAPK/ERK in the same cells is highly detrimental for their in vitro growth. Furthermore, we showed that the combination treatment triggered a marked downregulation of PLK1, SKP2, and FOXM1 mRNA levels in mouse and human HCC cells. Even though additional in vivo approaches are necessary to substantiate the aforementioned hypothesis, these data might possess important clinical implications. Indeed, the findings from this study suggest that the selective inhibition of ChREBP in human HCC displaying activation of the Ras/MAPK/ERK cascade might be either limited or ineffective. Considering the almost ubiquitous activation of this pathway in human liver cancer [Citation29], it is conceivable that inhibitors of the Ras/MAPK/ERK cascade should be coupled to ChREBP inhibitors for the treatment of this deadly disease.
In summary, we showed the importance of ChREBP in hepatocarcinogenesis using in vivo and in vitro approaches. Importantly, hepatocellular preneoplastic and neoplastic lesions induced by different oncogenes are either dependent from or do not require ChREBP for their growth and malignant properties. Future studies are needed to evaluate the therapeutic potential of strategies aimed at concomitantly inhibiting ChREBP and the Ras/MAPK/ERK cascade in HCC.
Materials and methods
Constructs and reagents
The constructs used for mouse injection, including pT3-EF1α-myr-AKT1 (HA-tagged), pT3-EF1α-V5-c-Met, pT2-Caggs-NRasV12, and pCMV/sleeping beauty transposase (pCMV/SB), were described previously [Citation13,Citation28,Citation30]. Plasmids were purified using the Endotoxin-free Maxi prep kit (Sigma-Aldrich, St. Louis, MO) for in vivo experiments. The MEK inhibitor U0126 was purchased from Cell Signaling Technology Inc. (Danvers, MA).
Hydrodynamic tail vein injection and mouse monitoring
Highly inbred 6-weeks-old male C57BL/6J wild-type (ChREBPWT or ChREBP+/+) and ChREBP-knockout (ChREBPKO, ChREBP−/-; stock #: 010537) mice were purchased from Jackson Laboratory (Bar Harbor, ME), and mouse genotyping was conducted as previously reported [Citation25]. Hydrodynamic injection was performed as described [Citation13,Citation26,Citation30,Citation40]. In brief, to determine whether overexpression of AKT, either alone or in association with either c-Met or mutant NRas (NRasV12), can induce hepatocarcinogenesis in the liver of ChREBPWT and/or ChREBPKO mice, the plasmids encoding the gene(s) of interest along with sleeping beauty transposase (SB) in a ratio of 25:1 were diluted in 2 ml saline (0.9% NaCl), filtered through 0.22 μm filter, and injected into the lateral tail vein of ChREBPWT and ChREBPKO mice in 5 to 7 seconds. Mice were monitored weekly and harvested when they developed large liver tumor burden as palpable abdominal masses. Mice were housed, fed, and monitored in accordance with protocols approved by the Committee for Animal Research at the University of California, San Francisco.
Histology and Western blot analysis
Liver specimens were fixed overnight in zinc formalin (Anatech Ltd, Battle Creek, MI), embedded in paraffin, cut into 5-μm-thick sections, and placed on glass slides. Preneoplastic and neoplastic mouse liver lesions were evaluated by two expert liver pathologists (SR and FD) in accordance with the criteria described in detail previously [Citation13,Citation26,Citation27,Citation30,Citation31]. Briefly, in contrast to hepatocellular tumors that were usually already visible macroscopically as white/pale nodules, preneoplastic lesions showed no expansive growth. Preneoplastic lesions were composed of clusters of altered hepatocytes with massively enlarged cytoplasm that were mainly located in the zone 3 of the liver acinus. Hepatocellular carcinomas (HCCs) were diagnosed if the lesion showed in addition a pseudo-glandular or a macro-trabecular pattern with more than three cell layers of trabecular width in at least two different areas or frank signs of malignancy such as large areas of necrosis in combination with severe nuclear atypia, a high mitotic rate, and/or vascular invasion. Oil Red O staining was conducted on mouse frozen liver sections using standard methods. Frozen mouse liver specimens and HCC cell lines were homogenized in Mammalian Protein Extraction reagent (Thermo Scientific, Waltham, MA) containing the Complete Protease Inhibitor Cocktail (Sigma-Aldrich) and sonicated. Protein concentrations were determined with the Bio-Rad Protein Assay Kit (Bio-Rad, Hercules, CA) using bovine serum albumin as standard. For Western blot analysis, aliquots of 100 µg were denatured by boiling in Tris-Glycine SDS Sample Buffer (Thermo Scientific), separated by SDS-PAGE, and transferred onto nitrocellulose membranes (Thermo Scientific) by electroblotting. Membranes were blocked in 5% non-fat dry milk in Tris-buffered saline containing 0.1% Tween 20 for 1 h and probed with the following primary antibodies in a 1:3000 dilution: rabbit polyclonal anti-ChREBP (Origene Technologies, Rockville, MD), rabbit monoclonal anti-ERK1/2, anti-phosphorylated ERK1/2, ant-SCD1 (Cell Signaling Technology Inc.), mouse monoclonal anti-FASN (San Jose, CA). Equal loading was assessed with reversible Red Ponceau staining and by probing the membranes with the mouse monoclonal anti-β-actin antibody (Sigma-Aldrich; 1:20,000 dilution).
Immunohistochemistry and evaluation of proliferation rate in mouse livers
Antigen retrieval was performed in 1mM ethylenediaminetetraacetic acid (EDTA; pH 8.5) by placement in a microwave oven on high for 10 min, followed by a 20-min cool down at room temperature. After a blocking step with the 5% goat serum and Avidin-Biotin blocking kit (Vector Laboratories, Burlingame, CA), the slides were incubated with primary antibodies overnight at 4°C. Slides were then subjected to 3% hydrogen peroxide for 10 min to quench endogenous peroxidase activity and subsequently the biotin conjugated secondary antibody was applied at a 1:500 dilution for 30 min at room temperature. The primary antibodies against HA-tag (Cell Signaling Technology Inc.; dilution 1:500) and Ki-67 (Thermo Fisher Scientific; dilution 1:1000) were used. The immunoreactivity was visualized with the Vectastain Elite ABC kit (Vector Laboratories, Burlingame, CA) and 3,3′-diaminobenzidine (DAB) as the chromogen. Slides were counterstained with hematoxylin. Proliferation index was determined in mouse livers (normal liver in control mice, preneoplastic and neoplastic lesions in AKT- and AKT/Ras-overexpressing livers) by counting Ki-67 positive cells on at least 2000 cells per mouse sample.
In vitro studies
The human HLE HCC cell line, after validation (Genetica DNA Laboratories, Burlington, NC), and the mouse AKT/Ras HCC cell line, were used in this study. The AKT/Ras cell line was generated from an HCC developed in an AKT/Ras mouse [Citation30,Citation31]. Cells were grown in a 5% CO2 atmosphere, at 37°C, in RPMI Medium supplemented with 10% fetal bovine serum (FBS; Gibco, Grand Island, NY) and penicillin/streptomycin (Gibco). The MEK inhibitor, U0126 (final concentration 25 μM), was administered to HLE and AKT/Ras cell lines for 48 h after 24 h serum deprivation. Cell proliferation was analyzed using the BrdU Cell Proliferation Assay Kit (Cell Signaling Technology Inc.). Apoptosis was assessed with the Cell Death Detection Elisa Plus Kit (Roche Molecular Biochemicals).
Knockdown of ChREBP gene
For silencing studies, HLE and AKT/Ras cells were transfected with 50 nM siRNA targeting either human (ID # SR309520; Origene Technologies) or mouse (ID # s81679; Life Technologies, Grand Island, NY) ChREBP gene. A scrambled small interfering RNA (siRNA; ID # 4,390,846; Life Technologies) was used as negative control. Experiments were repeated at least three times in triplicate.
Quantitative reverse transcription real-time polymerase chain reaction (qRT-PCR)
Validated Gene Expression Assays for human ChREBP (Hs00975714_m1), PLK1 (Hs00983227_m1), SKP2 (Hs01021864_m1), FOXM1 (Hs01073585_m1), FASN (Hs01005622_m1), SCD (Hs01682761_m1), and β-Actin (ID: 4333762T) genes as well as for mouse Chrebp (Mm02342723_m1), Plk1 (Mm00440924_g1), Skp2 (Mm00449925_m1), Foxm1 (Mm00514924_m1), Fasn (Mm00662319_m1), Acac (Mm01304257_m1), Scd1 (Mm01197142_m1), Pklr (Mm00443090_m1), and β-actin (Mm00607939_s1), were purchased from Applied Biosystems (Foster City, CA). PCR reactions were performed with 100 ng of cDNA of the collected samples or cell lines, using an ABI Prism 7000 Sequence Detection System with TaqMan Universal PCR Master Mix (Applied Biosystems). Cycling conditions were: denaturation at 95°C for 10 min, 40 cycles at 95°C for 15 s, and then extension at 60°C for 1 min. Quantitative values were calculated by using the PE Biosystems Analysis software and expressed as Number target (NT). NT = 2−ΔCt, wherein ΔCt value of each sample was calculated by subtracting the average Ct value of the target gene from the average Ct value of the β- Actin gene (housekeeping gene). The results obtained in human and mouse samples were also confirmed by normalizing the data to the 18s rRNA (Hs99999901_s1) gene (data not shown).
Assessment of triglycerides levels, free fatty acids, fatty acid synthesis, enolase, lactate dehydrogenase, and glucose-6-phosphate dehydrogenase activities
Triglyceride levels were determined using the Triglyceride Quantification Kit (BioVision Inc., Mountain View, CA), following the manufacturer’s protocol. Levels of free fatty acids were measured in mouse liver tissues using the Free Fatty Acid Quantification Colorimetric/Fluorometric Kit (Biovision Inc.). Fatty acid synthesis was measured in HLE and AKT/Ras HCC cell lines by incorporation of [U-[Citation14]C]acetate into lipids as described [Citation13]. Specifically, mouse and human HCC cell lines were cultured in 96-well plates at 2.0 x 10 [Citation3]/well and incubated overnight. After the addition of specific siRNAs, vehicle, or inhibitors as indicated, cells were pulse-labelled with [U-[Citation14]C]acetate, 1 μCi/well for 48 hours. Each condition was run in triplicate. Lipids were Folch extracted and counted for [Citation14]C. Enolase, lactate dehydrogenase, and glucose-6-phosphate dehydrogenase activities were assessed using the Enolase, LDH, and G6PD activity assays (BioVision Inc.), respectively, according to the manufacturer’s instructions.
Human tissue samples
A collection of sixty frozen HCC and corresponding non-tumorous surrounding livers was used. Tumors were divided in HCC with shorter/poorer (HCCP; n = 30) and longer/better (HCCB; n = 30) survival, characterized by < 3 and ≥ 3 years’ survival following partial liver resection, respectively. The clinicopathological features of liver cancer patients are summarized in Supplementary Table 1. HCC specimens were collected at the Medical Universities of Greifswald (Greifswald, Germany) and Sassari (Sassari, Italy). Institutional Review Board approval was obtained at the local Ethical Committee of the Medical Universities of Greifswald and Sassari. Informed consent was obtained from all individuals.
Statistical analysis
Data analysis was performed with Prism 6 Software (GraphPad, San Diego, CA). Differences between two groups were analyzed with unpaired t test. Kaplan–Meier method and log-rank test were used for survival analysis. P values < 0.05 were considered as statistically significant.
Abbreviations
| ACAC | = | acetyl-CoA carboxylase |
| ChREBP | = | carbohydrate-responsive element binding protein |
| ERK | = | extracellular signal–regulated kinase |
| FASN | = | fatty acid synthase |
| FoxM1 | = | forkhead box protein M1 |
| G6PDH | = | glucose 6-phospate dehydrogenase |
| HCC | = | hepatocellular carcinoma |
| HCCB | = | hepatocellular carcinoma with better prognosis/longer survival |
| HCCP | = | hepatocellular carcinoma with poorer prognosis/shorter survival |
| MAPK | = | mitogen-activated protein kinase |
| MEK | = | mitogen-activated protein kinase kinase |
| PKLR | = | pyruvate kinase L/R |
| PLK1 | = | polo-like kinase 1 |
| SCD1 | = | stearoyl-CoA desaturase 1 |
| siRNA | = | small interfering RNA |
| SKP2 | = | S-phase kinase-associated protein 2 |
Supplemental Material
Download Zip (4 MB)Disclosure statement
No potential conflict of interest was reported by the authors.
Supplemental material
Supplemental data for this article can be accessed here.
Additional information
Funding
Related Research Data
References
- Torre LA, Bray F, Siegel RL, et al. Global cancer statistics, 2012. CA Cancer J Clin. 2015;65(2):87–108.
- Llovet JM, Ricci S, Mazzaferro V, et al. Sorafenib in advanced hepatocellular carcinoma. N Engl J Med. 2008;359(4):378–390.
- Bruix J, Qin S, Merle P, et al. Regorafenib for patients with hepatocellular carcinoma who progressed on sorafenib treatment (RESORCE): a randomised, double-blind, placebo-controlled, phase 3 trial. Lancet. 2017;389(10064):56–66.
- Hanahan D, Weinberg RA. Hallmarks of cancer: the next generation. Cell. 2011;144(5):646–674.
- Phan LM, Yeung SC, Lee MH. Cancer metabolic reprogramming: importance, main features, and potentials for precise targeted anti-cancer therapies. Cancer Biol Med. 2014;11(1):1–19.
- Ward PS, Thompson CB. Metabolic reprogramming: a cancer hallmark even warburg did not anticipate. Cancer Cell. 2012;21(3):297–308.
- Kato Y, Maeda T, Suzuki A, et al. Cancer metabolism: new insights into classic characteristics. Jpn Dent Sci Rev. 2018;54(1):8–21.
- Warburg O. On the origin of cancer cells. Science. 1956;123(3191):309–314.
- Menendez JA, Lupu R. Fatty acid synthase and the lipogenic phenotype in cancer pathogenesis. Nat Rev Cancer. 2007;7(10):763–777.
- Swinnen JV, Brusselmans K, Verhoeven G. Increased lipogenesis in cancer cells: new players, novel targets. Curr Opin Clin Nutr Metab Care. 2006;9(4):358–365.
- Rohrig F, Schulze A. The multifaceted roles of fatty acid synthesis in cancer. Nat Rev Cancer. 2016;16(11):732–749.
- Yamashita T, Honda M, Takatori H, et al. Activation of lipogenic pathway correlates with cell proliferation and poor prognosis in hepatocellular carcinoma. J Hepatol. 2009;50(1):100–110.
- Calvisi DF, Wang C, Ho C, et al. Increased lipogenesis, induced by AKT-mTORC1-RPS6 signaling, promotes development of human hepatocellular carcinoma. Gastroenterology. 2011;140(3):1071–1083.
- Bhalla K, Hwang BJ, Dewi RE, et al. Metformin prevents liver tumorigenesis by inhibiting pathways driving hepatic lipogenesis. Cancer Prev Res (Phila). 2012;5(4):544–552.
- Cao D, Song X, Che L, et al. Both de novo synthetized and exogenous fatty acids support the growth of hepatocellular carcinoma cells. Liver Int. 2017;37(1):80–89.
- Hamaguchi T, Iizuka N, Tsunedomi R, et al. Glycolysis module activated by hypoxia-inducible factor 1alpha is related to the aggressive phenotype of hepatocellular carcinoma. Int J Oncol. 2008;33(4):725–731.
- Amann T, Maegdefrau U, Hartmann A, et al. GLUT1 expression is increased in hepatocellular carcinoma and promotes tumorigenesis. Am J Pathol. 2009;174(4):1544–1552.
- Beyoglu D, Imbeaud S, Maurhofer O, et al. Tissue metabolomics of hepatocellular carcinoma: tumor energy metabolism and the role of transcriptomic classification. Hepatology. 2013;58(1):229–238.
- Evert M, Calvisi DF, Evert K, et al. V-AKT murine thymoma viral oncogene homolog/mammalian target of rapamycin activation induces a module of metabolic changes contributing to growth in insulin-induced hepatocarcinogenesis. Hepatology. 2012;55(5):1473–1484.
- Ribback S, Sonke J, Lohr A, et al. Hepatocellular glycogenotic foci after combined intraportal pancreatic islet transplantation and knockout of the carbohydrate responsive element binding protein in diabetic mice. Oncotarget. 2017;8(61):104315–104329.
- Xu X, So JS, Park JG, et al. Transcriptional control of hepatic lipid metabolism by SREBP and ChREBP. Semin Liver Dis. 2013;33(4):301–311.
- Wang Y, Viscarra J, Kim SJ, et al. Transcriptional regulation of hepatic lipogenesis. Nat Rev Mol Cell Biol. 2015;16(11):678–689.
- Iizuka K. The transcription factor carbohydrate-response element-binding protein (ChREBP): a possible link between metabolic disease and cancer. Biochim Biophys Acta. 2017;1863(2):474–485.
- Abdul-Wahed A, Guilmeau S, Postic C. Sweet sixteenth for ChREBP: established roles and future goals. Cell Metab. 2017;26(2):324–341.
- Iizuka K, Bruick RK, Liang G, et al. Deficiency of carbohydrate response element-binding protein (ChREBP) reduces lipogenesis as well as glycolysis. Proc Natl Acad Sci U S A. 2004;101(19):7281–7286.
- Hu J, Che L, Li L, et al. Co-activation of AKT and c-Met triggers rapid hepatocellular carcinoma development via the mTORC1/FASN pathway in mice. Sci Rep. 2016;6:20484.
- Li L, Pilo GM, Li X, et al. Inactivation of fatty acid synthase impairs hepatocarcinogenesis driven by AKT in mice and humans. J Hepatol. 2016;64(2):333–341.
- Tward AD, Jones KD, Yant S, et al. Distinct pathways of genomic progression to benign and malignant tumors of the liver. Proc Natl Acad Sci U S A. 2007;104(37):14771–14776.
- Calvisi DF, Ladu S, Gorden A, et al. Ubiquitous activation of Ras and Jak/Stat pathways in human HCC. Gastroenterology. 2006;130(4):1117–1128.
- Ho C, Wang C, Mattu S, et al. AKT (v-akt murine thymoma viral oncogene homolog 1) and N-Ras (neuroblastoma ras viral oncogene homolog) coactivation in the mouse liver promotes rapid carcinogenesis by way of mTOR (mammalian target of rapamycin complex 1), FOXM1 (forkhead box M1)/SKP2, and c-Myc pathways. Hepatology. 2012;55(3):833–845.
- Wang C, Cigliano A, Delogu S, et al. Functional crosstalk between AKT/mTOR and Ras/MAPK pathways in hepatocarcinogenesis: implications for the treatment of human liver cancer. Cell Cycle. 2013;12(13):1999–2010.
- Tong X, Zhao F, Mancuso A, et al. The glucose-responsive transcription factor ChREBP contributes to glucose-dependent anabolic synthesis and cell proliferation. Proc Natl Acad Sci U S A. 2009;106(51):21660–21665.
- Airley RE, McHugh P, Evans AR, et al. Role of carbohydrate response element-binding protein (ChREBP) in generating an aerobic metabolic phenotype and in breast cancer progression. Br J Cancer. 2014;110(3):715–723.
- Kaushik AK, Shojaie A, Panzitt K, et al. Inhibition of the hexosamine biosynthetic pathway promotes castration-resistant prostate cancer. Nat Commun. 2016;7:11612.
- Wang XL, Wen XF, Li RB, et al. Chrebp regulates the transcriptional activity of androgen receptor in prostate cancer. Tumour Biol. 2014;35(8):8143–8148.
- Jiang L, Xiao L, Sugiura H, et al. Metabolic reprogramming during TGFbeta1-induced epithelial-to-mesenchymal transition. Oncogene. 2015;34(30):3908–3916.
- Zeng H, Gu H, Chen C, et al. ChREBP promotes the differentiation of leukemia-initiating cells to inhibit leukemogenesis through the TXNIP/RUNX1 pathways. Oncotarget. 2016;7(25):38347–38358.
- Berger E, Vega N, Weiss-Gayet M, et al. Gene network analysis of glucose linked signaling pathways and their role in human hepatocellular carcinoma cell growth and survival in HuH7 and HepG2 cell lines. Biomed Res Int. 2015;2015:821761.
- Jeong YS, Kim D, Lee YS, et al. Integrated expression profiling and genome-wide analysis of ChREBP targets reveals the dual role for ChREBP in glucose-regulated gene expression. PLoS One. 2011;6(7):e22544.
- Chen X, Calvisi DF. Hydrodynamic transfection for generation of novel mouse models for liver cancer research. Am J Pathol. 2014;184(4):912–923.