
ABSTRACT
One of the first structural changes in diabetic nephropathy (DN) is the renal enlargement. These changes resulted in renal hypertrophy in both glomerular and tubular cells. Shrink in the kidney size, which described as kidney atrophy resulted from the loss of nephrons or abnormal nephron function and lead to loss of the kidney function. On the other hand, increase in kidney size, which described as hypertrophy resulted from increase in proximal tubular epithelial and glomerular cells size. However overtime, tubular atrophy and tubulointerstitial fibrosis occurs as subsequent changes in tubular cell hypertrophy, which is associated with the infiltration of fibroblast cells into the tubulointerstitial space. The rate of deterioration of kidney function shows a strong correlation with the degree of tubulointerstitial fibrosis. A consequence of long-standing diabetes/hyperglycemia may lead to major changes in renal structure that occur but not specific only to nephropathy. Identifying type of cells that involves in renal atrophy and hypertrophy may help to find a therapeutic target to treat diabetic nephropathy. In summary, the early changes in diabetic kidney are mainly includes the increase in tubular basement membrane thickening which lead to renal hypertrophy. On the other hand, only renal tubule is subjected to apoptosis, which is one of the characteristic morphologic changes in diabetic kidney to form tubular atrophy at the late stage of diabetes.
KEYWORDS:
Introduction
Renal hypertrophy in diabetes
The balance between new protein accumulation and degradation of existing proteins determines cell size. Increase in renal size is predominantly due to proximal tubular epithelial cell hypertrophy. In addition, renal hypertrophy has been resulted from stimulated protein synthesis that contribute to cell enlargement and increased total cellular protein content, which define cellular hypertrophy. Tubular cells are primary targets of hyperglycemia, and chronic exposure to elevated blood glucose levels contribute to the tubulointerstitial changes seen in overt diabetic nephropathy [Citation1–Citation5]. Diabetic nephropathy is characterized by morphologic changes include glomerular and tubular hypertrophy as well as the accumulation in protein matrix [Citation6]. In diabetes, the renal tubule is subject to both direct and indirect insults. In addition, tubular and interstitial lesions are prominent in diabetic patients. An increase in tubular basement membrane thickening that accompanies the development of renal hypertrophy is considered one of the earliest renal pathological changes in diabetes [Citation6–Citation8]. The changes in the tubular occur are independent on the pathological changes that associated with progressive of diabetic nephropathy and strongly correlated with glycemic control.
The process of epithelial-to-mesenchymal transition (EMT) defined whereas the fibroblasts migrate through the tubular basement membrane into the interstitium [Citation9,Citation10]. Mature tubular epithelial cells in adult kidney can undergo EMT, a phenotypic conversion that is fundamentally linked to the pathogenesis of renal interstitial fibrosis [Citation9]. Renal fibrosis is a process that leads to generate of interstitial myofibroblasts in several diseases including diabetes [Citation11]. Vimentin is the cytoskeletal component responsible for maintaining cell integrity that often used as a marker of mesenchymally derived cells or cells undergoing an EMT [Citation12]. The majority of vimentin staining was significantly localized within the proximal tubular cells in the kidney section of diabetic subjects while non-detectable staining found in kidney of control subjects [Citation6].
Tuberin and renal hypertrophy in diabetes
Tuberin is the key molecule intimately involved in the translation and transcriptional regulation of fibrosis protein [Citation13]. Our previous published data showed that decrease in tuberin is associated with enhanced renal hypertrophy in normal-glycemic rats. In addition, significant increased in renal hypertrophy was observed in diabetic rats express low tuberin compare to wild type rats at the age of 1 month from same sex and strain-matched [Citation14]. Our new data show that mice express low tuberin is associated with significant increase in kidney hypertrophy (16%) compared to WT mice at age of 3 months from same sex and strain-matched (data not shown). We found also that less tuberin expression is associated with accumulation significant levels of fibronectin and collagen IV in kidney cortex of diabetic rats [Citation14]. Furthermore, mRNA expression of fibronectin is increased in mouse cells deficient in tuberin compared to wild type cells [Citation14]. We showed also that the majority of fibronectin and collagen IV staining was more prominent within tubular cell membranes, tubulointerstitial cells and less in glomerulus compartment of kidney sections of diabetic patients [Citation6]. Moreover, tubular thickening and tubular hypertrophy is associated with decrease in tuberin in kidney section of diabetic patients compared with normal structure of tubular in normal kidney of healthy subjects [Citation6]. These data suggest the specificity of renal tubular cells to express tuberin where are the majority of fibrosis proteins accumulated within the kidney cortex.
One critical downstream target of tuberin is S6 kinase (S6K) that affects cell and organ size in Drosophila [Citation15]. The important role of S6K and ribosomal protein S6 has been studied using rapamycin as a direct inhibitor of the mammalian target of rapamycin (mTOR) [Citation16,Citation17]. Our recent published data show a new evidence that the tuberin/mTOR pathway is also involved in transcriptional regulation of cell matrix protein through CREB [Citation8]. It is likely that matrix proteins are regulated at both transcription as well as translation under hyperglycemia. Inactivation of tuberin and activation of mTOR in diabetes is due, at least in part, to the effects of hyperglycemia. In addition, mTOR increases the expression of profibrotic cytokines, such connective tissue growth factor, which play an important role in mediating the tubulointerstitial changes that associated with diabetic nephropathy [Citation18].
Type of cells involves in renal hypertrophy during diabetes
1. Tubular cells
Tubular epithelial cells, in particular those of the proximal tubule, are direct targets for enhanced glucose levels under hyperglycemia. A major action of high intracellular glucose is the increased synthesis and release of growth factors, which then stimulate the growth of renal cells. Exposure of proximal tubular epithelial cells to high glucose contributes to the tubulointerstitial and matrix proteins accumulation in diabetic nephropathy. Our previous published data show that high staining of tuberin phosphorylation at Thr1462 (inactive form of tuberin) and 70S6K phosphorylation at Thr389. Both staining are more prominent in the majority of the tubular cells while very weak staining was found for both phosphor-proteins in normal kidney (Normal) sections from healthy subjects. The increase in tuberin and p70S6K phosphorylation is associated with increase in fibrosis proteins including fibronectin and collagen IV [Citation6]. The majority of fibronectin and collagen IV staining was more prominent within tubular cell membranes, tubulointerstitial cells and less in glomerulus compartment of human diabetic kidney sections [Citation6]. These data suggest that tuberin/mTOR pathway may involve in the regulation of interstitial myofibroblasts, which is principal mediator of the fibrotic process in diabetic nephropathy.
The alterations in tubular cells structure including tubular thickening and hypertrophy are major players in orchestrating events in the tubulointerstitial changes in diabetic nephropathy. Renal tubular and mesangial cells show increased in diameter and increased nuclear size during diabetes. Hypertrophy of both cells is accompanied by an increase in cellular DNA content (polyploidy) with corresponding nuclear enlargement and change from an oval to a rectangular configuration [Citation19]. Cell hypertrophy is characterized by cell cycle arrest in the G1 phase and is often followed by increased deposition of extracellular matrix proteins [Citation20,Citation21]. Hypertrophy of renal cells contributes to glomerulosclerosis and tubulointerstitial that may lead to the end-stage diabetic kidneys [Citation21]. Several intracellular proteases are decreased in their activity in the diabetic state. Some of these growth factors such as Ang II and/or TGF-β are partly responsible for inhibition these proteinase [Citation22] may explain that inhibition of proteolytic enzymes can decrease protein turnover, which contribute to renal hypertrophy in diabetes.
2. Mesangial cells
Several cell culture studies have provided considerable evidences about the role of high glucose in alterations of mesangial cells. Our recent published data showed that no discernible apoptosis in glomerular compartment, while the majority of apoptotic cells shown in tubular [Citation23]. On the other hand, the early proliferation of mesangial and tubular cells with subsequent cellular hypertrophy, which remains prominent and sustained. In diabetic patients kidneys grow larger and glomerular filtration rate (GFR) becomes upnormal, which are the risk factors for developing diabetic nephropathy later in life [Citation24]. Proximal tubular epithelial cells in the adult animal primarily undergo hypertrophy, with occasional tendency to apoptotic stress, although they seem to be protected against apoptosis. Principally, high glucose is a major stimulus for growth of renal cells in diabetic renal disease [Citation25,Citation26]. It is possible that membrane glucose transporters enhance the uptake of glucose and increase its availability for intracellular metabolism.
Hypertrophy is more than passive cell swelling in masangial cells exposed to high glucose where the changes in cellular metabolism and growth regulation can be continuously active. Reduce protein degradation due to inhibition of various proteases is cell cycle independent and may lead to hypertrophy [Citation21]. Mesangial cell has different character than tubular cell when they exposed to high glucose whereas mesangial cell have active cell cycle–dependent process [Citation22]. The increasing in blood glucose concentrations from 100 to 450 mg/dl has a biphasic effect on cell proliferation. Different effect of shorter or longer exposure to high glucose demonstrated on cell proliferation, whereas 24 hrs stimulates an early limit proliferation while prolonged exposure inhibits mesangial cell proliferation and induces hypertrophy [Citation22].
Renal atrophy in diabetes
Kidney atrophy is shrinking in kidney size because of the loss or inadequate circulation of nephrons. The loss of nephrons could also cause the renal arteries and veins to shrink. Increase apoptosis in renal proximal tubular cells may lead to tubular atrophy and increase cells fibrosis. A recent study from our laboratory showed a significant increase in apoptosis only in renal proximal tubular cells while no apoptotic cells showed in glomeruli compartment in type I diabetic rats [Citation23].
The conditions that negatively impact the nephron function including renal diseases, urinary tract obstruction, acute pyelonephritis could initiate renal atrophy [Citation24]. In addition, decrease in oxygen supply (Ischemia) and nutrients due to inadequate blood flow to the kidneys could have a major negative effect on kidney function [Citation25]. Major causes of ischemia are atherosclerosis (narrowing of renal arteries due to accumulation of fatty deposits inside the arterial walls) or renal cysts formation [Citation26–Citation28]. Blockage of the major arteries that supply blood to the kidneys resulted in renal artery occlusion and may lead to atrophy [Citation27]. In addition, kidney damage due to the backflow of urine into the kidney, which described as reflux nephropathy, could also contribute to renal atrophy [Citation29].
Type of cells involves in renal atrophy during diabetes
Atrophic cells typically have diminished amounts of specialized organelles within their cytoplasm and are less functionally capable than normal cells. Atrophy of some cell types occurs as a consequence of normal aging and decreases in trophic hormone [Citation30]. Atrophy may also result from some forms of injury that diminish or block neural or hormonal stimulation of a tissue such as a marked skeletal muscle atrophy occurs if neural stimulation is interrupted for a prolonged period of time [Citation31]. In addition, thinning of renal parenchyma, which is the functional tissue of kidney, may result from renal atrophy. The increase in the pressure on the tissues or compression of the intra-renal veins and arteries may cause to obstruction of the urinary tract [Citation32]. The urinary tract infection is one of the most likely to experience symptoms in people afflicted [Citation33]. The symptoms of urinary tract infection are painful urination, blood in urine and frequent urge to urinate [Citation33]. In addition, kidney atrophy is most likely cause kidney pain too. Moreover, the interference with the normal urine flow leads to back pressure within the kidneys, which described as obstructive nephropathy, can also cause damage to the nephrons and causes pain [Citation32]. Loss of nephrons will result in the chronic loss of kidney function and may cause the kidneys to shrink in size. In addition, the accumulation of abnormal materials can compress parenchymal cells that displace organelles and cytoskeletal components may also lead to renal atrophy [Citation33].
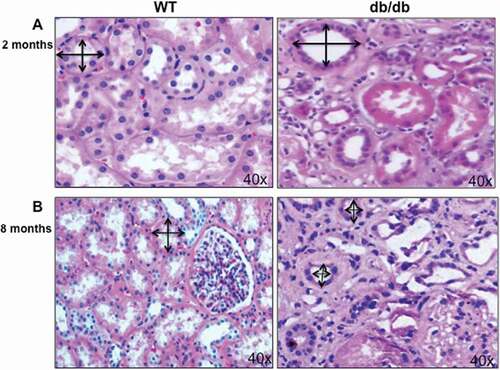
The pathological changes at the early and late stages of diabetes described in kidney sections of diabetic mice (db/db) at 2 and 8 months of diabetes compared to wild type mice (). These early changes in diabetic mice are mainly include the increase in tubular basement membrane thickening which lead to renal hypertrophy at age of 2 months ()). In addition, renal enlargement as one of the first structural changes in diabetes contributes in increase the tubulointerstitial cells ()). On the other hands, only renal tubule is subjected to apoptosis, which is one of the characteristic morphologic changes in diabetic kidney to form tubular atrophy in the late stage of diabetes (diabetic mice at age 8 months). These changes in tubular cells lead to atrophy and appear to be a better indicator of disease progression than glomerular pathology ()). These changes are mainly occurs in both proximal tubular cells as well as in glomerular compartment and associated with progressive diabetic nephropathy. Wild type mice and db/db mice (Strain B6.BKC-Leprdb/J) were purchased from Jackson Laboratory. The study approved by Institutional Animal Care and Use Committee, University of Texas Health Science Center, San Antonio, TX.
Figure 1. Hypertrophy and atrophy during different stages of diabetes. (A) H&E staining of kidney section showed increase in the proximal tubular cells size as well as basement membrane thickness in 2 months old of diabetic mice (db/db) compared to kidney from wild type (WT) mice. (B) On the other hand, decrease in proximal tubular cells size showed in kidney of 8 months old of diabetic mice (db/db) compared to WT mice at the same age. Double arrowheads marked the size of proximal tubular cells in kidney of WT and diabetic mice (db/db). Photographs were taken under same magnification (40X).
Disclosure statement
No potential conflict of interest was reported by the author.
Additional information
Funding
References
- Gilbert RE, Cooper ME. The tubulointerstitium in progressive diabetic kidney disease: more than an aftermath of glomerular injury? Kidney Int. 1999;56:1627–1637.
- Jones SC, Saunders HC, Qi W. Pollock CA: intermittent high glucose enhances cell growth and collagen synthesis in cultured human tubulointerstitial cells. Diabetologia. 1999;42:1113–1119.
- Jones SC, Saunders HJ. Pollock CA: high glucose increases cell growth and collagen synthesis in cultured human tubulointerstitial cells. Diabet Med. 1999;16:932–938.
- Ziyadeh FN, Snipes ER, Watanabe M, et al. Haverty TP: high glucose induces cell hypertrophy and stimulates collagen gene transcription in proximal tubule. Am J Physiol Renal Fluid Electrolyte Physiol. 1990;259:F704–F714.
- Tsao T, Fawcett J, Fervenza FC, et al. Rabkin R: expression of insulin-like growth factor-I and transforming growth factor-beta in hypokalemic nephropathy in the rat. Kidney Int. 2001;59:96–105.
- Habib SL. Alterations in tubular epithelial cells in diabetic nephropathy. J Nephrol. 2013;26:865–869.
- Marchant V, Droguett A, Valderrama G, et al. Tubular overexpression of Gremlin in transgenic mice aggravates renal damage in diabetic nephropathy. Am J Physiol Renal Physiol. 2015;309:F559–68.
- Habib SL, Mohan S, Liang S, et al. Novel mechanism of transcriptional regulation of cell matrix protein through CREB. Cell Cycle. 2015;14:2598–2608.
- Robertson H, Ali S, McDonnell BJ, et al. Chronic renal allograft dysfunction: the role of T cell-mediated tubular epithelial to mesenchymal cell transition. J Am Soc Nephrol. 2004;15:390–397.
- Ziyadeh FN, Wolf G. Pathogenesis of the podocytopathy and proteinuria in diabetic glomerulopathy. Curr Diabetes Rev. 2008;4:39–45.
- Djamali A. Oxidative stress as a common pathway to chronic tubulointerstitial injury in kidney allografts. Am J Physiol Renal Physiol. 2007;293:F445–55.
- Liang S, Salas T, Gencaslan E, et al. Tuberin-deficiency downregulates N-cadherin and upregulates vimentin in kidney tumor of TSC patients. Oncotarget. 2014;5:6936–6946.
- Habib SL. Tuberin in renal cell hypertrophy. Cell Cycle. 2014;13:869–870.
- Habib SL, Yadav M, Tizani S, et al. Tuberin inhibits production of the matrix protein fibronectin in diabetes. J Am Soc Nephrol. 2012;23:1652–1662.
- Potter CJ, Huang H, Xu T. Drosophila Tsc1 functions with Tsc2 to antagonize insulin signaling in regulating cell growth, cell proliferation, and organ size. Cell. 2001;105:357–368.
- Inoki K, Li Y, Zhu T, et al. TSC2 is phosphorylated and inhibited by Akt and suppresses mTOR signaling. Nat Cell Biol. 2002;4:648–657.
- Lieberthal W, Levine JS. The role of the mammalian target of rapamycin (mTOR) in renal disease. J Am Soc Nephrol. 2009;12:2493–2502.
- Yang X, Xu T. Molecular mechanism of size control in development and human diseases. Cell Res. 2011;21:715–729.
- Wolf G. Cell cycle regulation in diabetic nephropathy. Kidney Int Suppl. 2000;77:S59–6.
- Alsaad KO, Herzenberg AM. Distinguishing diabetic nephropathy from other causes of glomerulosclerosis: an update. J Clin Pathol. 2007;60:18–26.
- Wolf G, Ziyadeh FN. Molecular mechanisms of diabetic renal hypertrophy. Kidney Int. 1999;56:393–405.
- Gruden G, Perin PC, Camussi G. Insight on the pathogenesis of diabetic nephropathy from the study of podocyte and mesangial cell biology. Curr Diabetes Rev. 2005;1:27–40.
- Velagapudi C, Bhandari BS, Abboud-Werner S, et al. The tuberin/mTOR pathway promotes apoptosis of tubular epithelial cells in diabetes. J Am Soc Nephrol. 2011;22:262–273.
- Vallon V, Thomson SC. Renal function in diabetic disease models: the tubular system in the pathophysiology of the diabetic kidney. Annu Rev Physiol. 2012;74:351–357.
- Gnudi L. Molecular mechanisms of proteinuria in diabetes. Biochem Soc Trans. 2008;36:946–949.
- Cui R, Chen X, Peng L, et al. Multiple mechanisms in renal artery stenosis-induced renal interstitial fibrosis. Nephron Exp Nephrol. 2014;128:57–66.
- Bonventre JV, Yang L. Cellular pathophysiology of ischemic acute kidney injury. J Clin Invest. 2011;121:4210–4221.
- Meyrier A, Hill GS, Simon P. Ischemic renal diseases: new insights into old entities. Kidney Int. 1998;54:2–13.
- Dillon MJ, Goonasekera CD. Reflux nephropathy. J Am Soc Nephrol. 1998;9:2377–2383.
- Biaggioni I, Garcia F, Inagami T, et al. Hyporeninemic normoaldosteronism in severe autonomic failure. J Clin Endocrinol Metab. 1993;76:580–586.
- Klahr S. Mechanisms of progression of chronic renal damage. J Nephrol. 1999;(Suppl 2):S53–62.
- Lucarelli G, Mancini V, Galleggiante V, et al. Emerging urinary markers of renal injury in obstructive nephropathy. Biomed Res Int. 2014;2014:1–7.
- Cohen S, Nathan JA, Goldberg AL. Muscle wasting in disease: molecular mechanisms and promising therapies. Nat Rev Drug Discovery. 2015;14:58–74.