
ABSTRACT
Senescent cells constitutively secrete inflammatory cytokines, known as the senescence-associated secretory phenotype (SASP). Previous work has implicated SASP in immune-mediated clearance of senescent cells; however, its regulation remains unknown. Our recent transcriptome profiling study has shown that human senescent human stem and progenitors (s-HSPCs) robustly express genomic transposable elements (TEs) and pathways of inflammation. Furthermore, hypomethylating agents have been previously shown to induce expression of TEs and activate the dsRNA recognition pathway and downstream interferon-stimulated genes, leading to immune mediated cell death. Therefore, to examine whether activation of TEs occurred universally, independent of their modality of senescence induction, we performed transcriptomic analysis in artificially-induced senescent cell-lines and observed a robust activation of TEs. Hence we propose that the expression of TEs might play a role in immune mediated clearance of senescent cells.
Introduction
A complex cellular process contributes to the aging phenotype, characterized by progressive loss of organ function [Citation1–Citation3]. Cellular senescence, defined as a state of permanent cell cycle arrest, plays an important role in aging [Citation4–Citation6]. Stressors such as telomere shortening, mitochondrial dysfunction, oxidative stress, and DNA damage induce senescence [Citation7]. Senescent cells are known to be actively cleared by the immune system [Citation8–Citation11]. Furthermore, they constitutively secrete cytokines to generate a SASP (senescence associated secretory phenotype) wherein, components of SASP in turn, enable the clearance of damaged senescent cells (“senescence surveillance”) [Citation12], indicative of an important link between immunity, senescence clearance and longevity. In addition, SASP is known to exhibit several pleiotropic effects in tumorigenesis [Citation13] – dependent on a cell growth arrest or pro-oncogenic milieu- based secretome [Citation14–Citation16]. In this regard, although the role of SASP and its implication in senescence surveillance are well studied, the regulation of SASP – specifically its upstream activators, are yet to be identified.
Approximately 50% of the genome comprises of TEs [Citation17]. In steady state, DNA methylation, chromatin modification, RNA editing and other mechanisms repress their activation [Citation18]. Recent works demonstrating derepression of TEs with hypomethylating agents (HMA), resulted in activation of the ds-RNA recognition pathway, leading to tumor clearance by immune cells (“viral mimicry”)[Citation19,Citation20]. Furthermore, we have shown that human s-HSPCs in vivo show activated expression of TEs along with immune pathways [Citation21]. Thus, it is plausible that the expression of TEs in senescent cells foretell the immune system for their orderly clearance in order to maintain homeostasis.
Recent studies investigating the functional consequences of senescent cell clearance, demonstrated: rejuvenation of aging hematopoietic and muscle stem cells [Citation22], improvement in renal function and frailty [Citation23] and an increase in life span [Citation24–Citation26]. Similar growing interests in the development of therapeutics targeting senescent cells (senolytics) to improve organ function, underscores the importance to further our understanding of the molecular determinants/underpinnings/basis of senescence and its homoeostasis.
We therefore hypothesized that senescence induction led to activation of TEs and immunity related genes. Furthermore, we queried whether various modalities of senescence induction activated similar TE profiles. For this we characterized the transcriptome of cultured cells [Citation27] induced to senescence states by higher cell-passages and chemotherapy agent, oxidative stress, HMA.
Materials and methods
The RNA-seq experimental data was obtained from Purcell et. al [Citation27]., and the published dataset were obtained from GEO (Accession No.: GSE60340). RNA-seq and gene expression array data for oncogene induced senescence (OIS) was obtained from Pawlikowski et. al [Citation28]. Transcript abundance was quantified by pseudoalignment using Kallisto [Citation29]. Sequenced reads were mapped to a reference transcriptome prepared using Arkas [Citation30], comprised of ENSEMBL human (GRCh38-build 81) coding and non-coding transcripts, repetitive elements (RepBase issue 21-03). Arkas managed the preparation of indices, quantification of transcript abundance, and annotation of Kallisto results by leveraging S4-summarized experiment structure.
TE transcript expression for each experimental group using upper-quartile normalization was used for principal component analysis (PCA) [Citation31]. The relative log-expression of all TE transcript expression relative to each corresponding experimental group was depicted in a bar-plot. The original manuscript [Citation27] labeled the lowest low passage samples as ‘LLP’, and in this manuscript please note that the ‘LLP’ experimental group was labeled as ‘Low Passage’.
TE expression counts less than 2 across samples were filtered from differential expression analysis. Differential expression used upper-quartile normalized counts comparing expression between treatment and control determined using ‘edgeR’[Citation32]. The linear model contrasted Adriamycin, 5-Azacitidine, Oxidative (H202 treated), and natural, replicative, senescence against lowest low passage (original nomenclature ‘LLP’). The statistically significant differences in normalized log2 (CPM) (likelihood ratio test, adjusted p-value <0.05, FDR adjustment method: Benjamini-Hochberg procedure) were reported as differentially expressed. The statistically significantly dysregulated TE were subset, and their log2 transcript-per-million (TPM) values were depicted in each figure. The differential expressed (FDR < 0.05, adjustment method: Benjamini-Hochberg) TE transcript biotypes were tabulated, and the linear model coefficients as log-fold change were used to determine the estimated dysregulation. The expected TE expression was estimated by compounding the linear model coefficients with the corresponding significant differential expression of TE (DE TEs) normalized observed expression values.
The negative binomial GLM (‘edgeR’) was constructed using a design matrix, which identified all the experimental groups. For each experimental group, the fitted negative binomial GLM was contrasted and tested using the likelihood ratio test (LRT), and differentially expressed TEs were identified using FDR filtering alpha threshold of 0.05. After each LRT identified significantly DE TEs per experimental group, a set-analysis was performed. The Venn diagram identified 33 common significantly DE TEs activated by the 4 different induced senescent experiments.
The viral recognition pathway gene set analysis used canonical interferon stimulated genes (ISGs) involved with viral pathogenesis [Citation33]. The enrichment of the ISGs were calculated using QuSAGE [Citation34] and a FDR cutoff of 0.05 using Benjamini-Hochberg adjusted p-values. The QuSAGE estimated 95% confidence intervals were used to identify genes that had significant pathway enrichment activity with a p-value alpha threshold of 0.05.
Results
Induction of senescence activates TE expression
Senescence can be induced by various stimuli including genotoxic agents and oxidative, replicative, and oncogenic stresses [Citation5]. We have previously reported that primary senescent hematopoietic progenitors exhibited elevated expression of TEs [Citation21]. In order to examine if the activation of TE expression was a universal consequence of senescence induction, we analyzed transcriptome data generated from fibroblasts with Li-Fraumeni syndrome (LFS fibroblasts; heterozygous for p53), in which senescence was induced through replicative stress, 5-azacytidine, oxidative stress, or Adriamycin [Citation27]. This data-set was previously published, analyzing only the coding regions, which revealed activation of various inflammatory genes, including those involved in SASP.
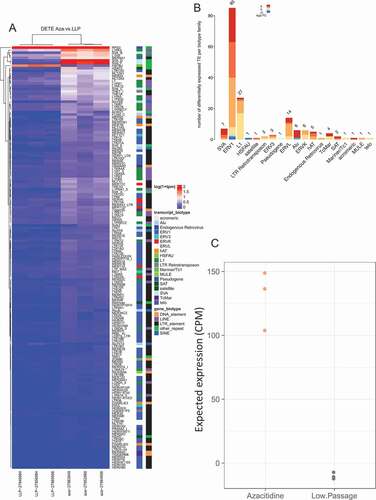
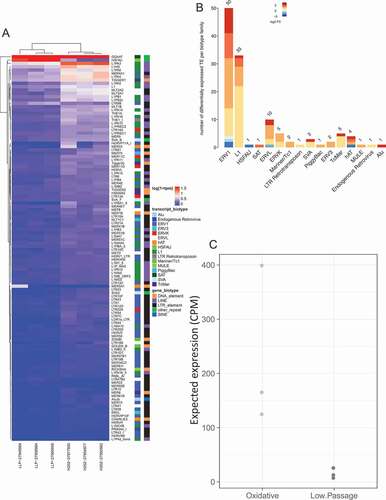
Prior studies have shown that HMA induces TE expression in cell lines [Citation19,Citation20,Citation35]. We analyzed differential expression of TEs in LFS fibroblasts with and without HMA treatment and observed significant upregulation of TEs in HMA treated cells (, Supplement data 1); thereby confirming findings from previous studies implicating the role of HMA in activating TE expression, as well as support the possibility of an interplay between senescence and TE- this could prove beneficial in cancer therapeutics.
Figure 1. Differential expression of transposable elements following 5-Azacitidine treatment. (a) Differential expression of TE following senescence induced by 5-Azacitidine. The x-axis is the experimental groups, and the y-axis are the significantly dysregulated TE. (b) Differentially expressed TE biotype dysregulation following 5-Azacitidine treatment. The significantly DE TEs biotypes were identified and the modeled expression estimates are summarized for each TE transcript biotype. (c) 5-Azacitidine expected TE expression group summary. The two groups expected expression was determined by compounding the dysregulation coefficients of significantly DE TEs with the observed normalized corresponding DETE expression. The y-axis denotes the expected expression predicted by the linear model constructed in A.
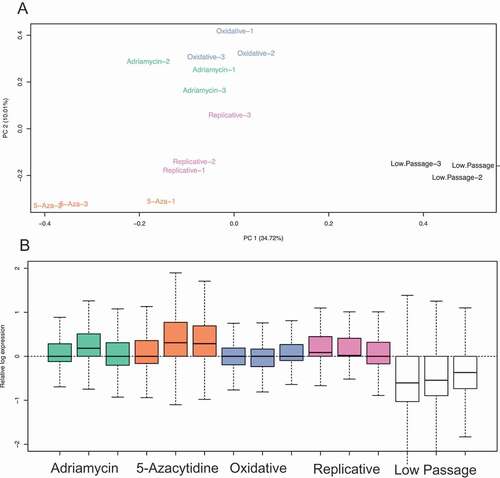
We next analyzed the transcriptome of LFS fibroblast cells treated with other inducers of senescence and consistently observed a similar pattern of significant upregulation of TEs, in all models of senescence, compared to actively dividing cells () and ), Supplement Figure 1 and Supplement data 1).
Figure 2. Transposable element overall expression of senescence induction groups. (a) Principal component analysis (PCA) of TE expression following treatment of 5-Azacitidine, Replicative senescence, oxidative (H202) treatment, and Adriamycin. (b) Relative log-expression of TE expression following treatments that induce senescence.
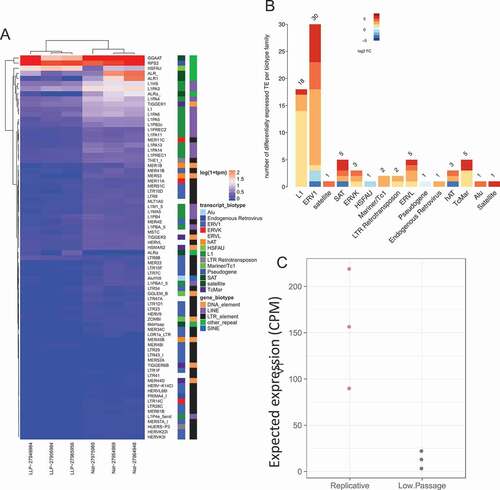
Replicative senescence significantly dysregulated 79 TEs, of which 72 (~91.1%) were up-regulated (), Supplement Data 2) and 58 (~80.6%) had a minimum log fold change of at least 1. The predominant TE biotypes significantly differentially expresses were ERV1 (30 dysregulated, 27 up-regulated, 3 down-regulated) and L1 with 18 up-regulated ()) (Supplement Data 2).
Figure 3. Differential expression of transposable elements following replicative senescence. (a) Differential expression of TE following senescence induced by replicative cell passages. Labeling is similar to ). (b) Differentially expressed TE biotype dysregulation following replicative senescence. Labeling is similar to . (c) Replicative senescent expected TE expression group summary. Labeling is similar to ).
5-Azacitidine treated LFS had the most differentially expressed TEs (DE TEs), with 169 significantly differentially expressed repeats (q-value <0.05, adjusted method: BH), of which 163 (~96.5%) transcripts were upregulated ()) (Supplemental Data 1). The predominant dysregulated TE biotypes were ERV1 (85 TEs dysregulated, 82 up-regulated, 3 down-regulated), and L1 with 27 TEs significantly up-regulated ()).
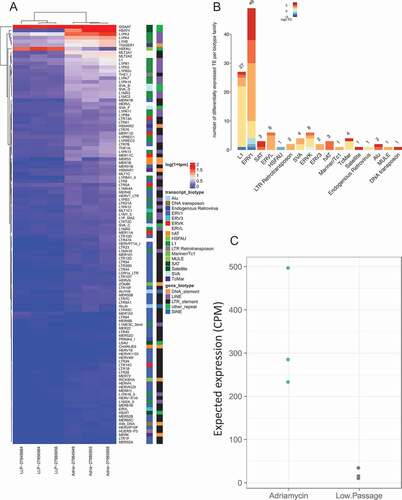
Adriamycin induced senescence and activated 114 TE transcripts, 107 (93.9%) were up-regulated (), Supplement Data 3). The 114 DE TEs consisted of predominantly ERV1 (49 dysregulated, 45 up-regulated, 4 down-regulated) and L1 (27 dysregulated, 26 up-regulated, and 1 down-regulated) ()).
Figure 4. Differential expression of transposable elements following Adriamycin treatment. (a) Differential expression of TE following senescence induced by Adriamycin. Labeling is similar to ). (b) Differentially expressed TE biotype dysregulation following Adriamycin chemotherapy induced senescence. Labeling is similar to ). (c) Chemotherapy induced senescent expected TE expression group summary. Labeling is similar to ).
Oxidative stress induced senescence activated 121 TEs, 114 (~94.2%) (), Supplement Data 4). The predominantly dysregulated TE biotypes included ERV1 (50 dysregulated, 47 up-regulated, 3 down-regulated) and L1 (33 up-regulated) ()).
Figure 5. Differential expression of transposable elements following senescence induction by oxidative stress (H202 treatment). (a) Differential expression of TE following senescence induced by oxidative stress. Labeling is similar to ). (b) Differentially expressed TE biotype dysregulation following oxidative stress induced senescence. Labeling is similar to ). (c) Stress induced senescent expected TE expression group summary. Labeling is similar to ).
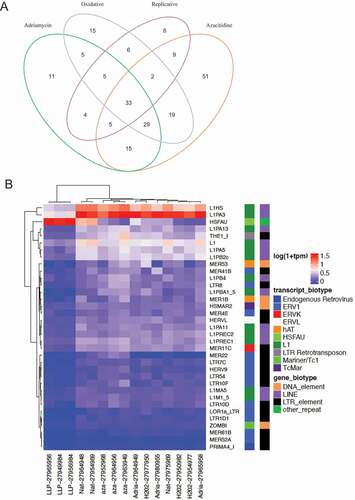
In addition to ERV1 and L1, which were the predominant up-regulated biotypes in all models of senescence induction, ERVK and ERVL were also up-regulated; although to a lesser degree. We also identified 33 differentially expressed TEs that were commonly dysregulated in all 4 experimental models ()) and they consistently comprised of ERV1 and L1 ()). Collectively, these data suggest that, this model system of senescence induction leads to the upregulation of TEs.
Figure 6. Senescence induced differentially expressed TE transcript per each experimental modality. (a) Set analysis of the DETE identified from the 4 modeled groups. The overlaps in the Venn Diagram indicate the number of DETE significantly dysregulated in the corresponding experimental group. (b) The differential expression of the 33 commonly TE dysregulated across all senescent modalities. The x-axis depicts the 4 experimental groups. The y-axis depicts the 33 DETE shared across groups.
Senescence induction co activates genes within the viral recognition pathway
Previous studies demonstrating derepression of TEs in the presence of HMAs, have shown induction of dsRNA with downstream activation of a suicidal interferon response [Citation19,Citation20,Citation35]. Although we observed a similar TE dysregulation profile within each model of senescence induction, downstream activation of interferon stimulated genes (ISGs) involved in regulation of viral pathogenesis, demonstrated variability (, Supplemental Data 5).
Figure 7. Viral recognition gene set analysis in senescence model. (a) Viral recognition gene pathway enrichment following 5-Azacitidine treatment. The x-axis depicts, in order, genes involved in viral recognition such as sensors, adaptors, signal transducers, transcription factors, interferon genes, and downstream interferon stimulated genes. For each gene in this pathway, there exists a 95% confidence interval also depicted. The global pathway activation is depicted as a dashed blue line, and the corresponding confidence interval is a gray solid bar. The y-axis depicts the log-fold change enrichment score. (b) Viral recognition gene pathway following replicative senescence. The x-axis and y-axis are identical to (a). (c) Viral recognition gene pathway following adriamycin chemotherapy induced senescence. The x-axis and y-axis are identical to (a). Viral recognition gene pathway following oxidative stress. The x-axis and y-axis are identical to (a).
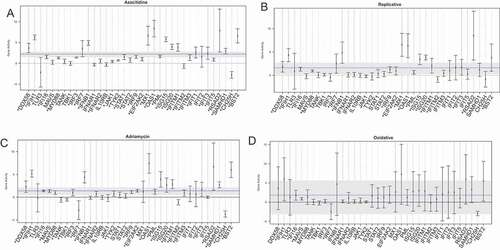
Upstream of ISG activation, the general innate immune response to viral infection includes replicating viral genome pattern recognition sensors (RIG-1/DDX58, MDA5, IFIH1, TLR3, IFI16), adaptor protein initiators of cascade signaling (MAVS, MYD88), and signal transducers involved with the activation of transcription factors (TANK, TBK1). The activated transcription factors such as IRF3, IRF7 lead to the activation of IFNB1, where IFNB1 drives the production of Type I/III IFNs and subsequent downstream ISGs [Citation33]. The pattern recognition pathway was up-regulated significantly in Azacitidine (log-fold change 2.2159, adjusted p-value: 2.29e-04), replicative senescence (log-fold change: 1.6080, adjusted p-value: 0.0211), and Adriamycin chemotherapy treatment (log-fold change: 1.4116, adjusted p-value: 0.0038). However oxidative stress did not show any significantly dysregulated the pattern recognition response despite the significant up-regulation of TE (log-fold change: 1.8198, adjusted p-value: 0.5623) (, Supplemental Data 5).
Similarly, pattern recognition sensors (RIG-1/DDX58, MDA5/IFIH1) and IFNB1 were significantly up-regulated in Azacitidine, replicative and Adriamycin mediated senescence. Consistent with a prior report [Citation27], we too observed significant up-regulation of IRF7 with Azacitidine and replicative senescence. Next, further downstream, interferon stimulated genes such as ISG15, ISG20, IFITM1/2, RSAD2, BST2, OAS1, and IFIT3 were all significantly enriched in Azacitidine, replicative senescence and Adriamycin (p-value <0.05) (). Thus, different modalities of senescence induction depict similarities in dysregulated TE profiles and downstream activation of the innate immune pathway in all modalities of senescence except for senescence induced by oxidative stress.
Since oncogenes are known to induce senescence in cancer, we used RNA sequencing data from BRAF600VE oncogene induced senescence (OIS) melanocyte cells from Pawlikowski et. al [Citation28]. and observed a similar upregulation of TE along with genes in the viral recognition pathway (Supplemental Figure 2(a) and 2(b)). Gene expression array showed a statistically significant upregulation of the viral recognition pathway upon OIS in melanocytes compared with uninfected melanocytes (Supplemental Figure 2(c)).
Discussion
Prior studies have shown increased expression of repetitive elements and inflammatory response genes with aging[Citation21,Citation36–Citation38]. This hitherto, is the first comprehensive analysis looking at the landscape of TE expression across various senescence models, demonstrating significant overlap in their TE expression profiles.
Elimination of senescent cells have previously shown increase in longevity[Citation24–Citation26]- partly mediated by immune cells [Citation8–Citation11]. In this regard, evidence suggests that TEs mediated activation of innate immune response facilitate clearance of cancer cells [Citation19,Citation20]. More directly, we recently showed that leukemic stem cells have repressed expression of TEs along with immune pathways [Citation39], indicative of a survival mechanism to evade an innate immune response. Identification and targeting of similar oncogenic-addictions could prove essential therapeutic strategies, as recently shown [Citation40].
Cytosolic DNA sensor has been shown to play a major in immune mediated clearance of senescent cells [Citation41] and is being extensively investigated for cancer therapy. In contrast, TE-activated dsRNA recognition pathway, is known to mediate tumor clearance [Citation14,Citation17,Citation19–Citation21], although its role in senescence clearance, remains unexplored. This highlights the importance of intracellular DNA and RNA sensing pathways in benefitting organismal health by promoting clearance of cancerous and senescent cells. Our study adds to this knowledge by highlighting the role of TE expression in senescent cells, as a cellular adaptation to mediate clearance. Though MAVS is well recognized in the dsRNA recognition pathway, it has also been shown to be activated upon dsDNA recognition [Citation39], hence the contribution of dsDNA in senescence clearance cannot be ruled out and warrants further investigation. A limitation to our analysis was the preparation of cDNA library using poly (A) selection, thus failing to capture most of SINEs and other classes of repeat elements.
Although, TE expression has previously been thought of as a deleterious pro oncogenic event, caused by re-integration and genomic instability [Citation42], recent evidence suggests beneficial effects of TE expression. DNA methyltransferase inhibitors- activate TE and viral recognition pathway, thereby promoting cancer immunogenicity and tumor clearance [Citation12,Citation19,Citation20,Citation32]. Interestingly, expression of TE was recently shown to predict responses to immune checkpoint inhibitor in various cancer [Citation43]. Here we present evidence for evolutionarily conserved non-coding elements, which are active in senescent cells, including in OIS, triggering an interferon-apoptotic cascade. Understanding these pathways and nodes, which regulate the expression of TE in senescence would lead to therapeutic targets to potentiate tissue rejuvenation and arrest oncogenic progression. The orderly execution of these cellular programs in healthy individuals suggests that viral elements in the genome have been co-opted by the mammalian immune system to balance regenerative capacity against tumorigenic risk.
Author contributions
AC performed the bioinformatics analysis of the RNA sequencing and wrote the manuscript. HKE analyzed the data and wrote the manuscript. GR designed and supervised the study, analyzed the data and wrote the manuscript.
Consent for publication
All authors have read the manuscript and consented for publication. Availability of data and material: The data was generated using RNA sequencing from publicly available data.
Supplemental Material
Download Zip (673.9 KB)Disclosure statement
No potential conflict of interest was reported by the authors.
Additional information
Funding
Related Research Data
References
- Beerman I, Bock C, Garrison BS, et al. Proliferation-dependent alterations of the DNA methylation landscape underlie hematopoietic stem cell aging. Cell Stem Cell. 2013 Apr 4;12(4):413–425. PubMed PMID: 23415915.
- Dykstra B, Olthof S, Schreuder J, et al. Clonal analysis reveals multiple functional defects of aged murine hematopoietic stem cells. J Exp Med. 2011 Dec 19;208(13):2691–2703. PubMed PMID: 22110168; PubMed Central PMCID: PMCPMC3244040.
- Roobrouck VD, Ulloa-Montoya F, Verfaillie CM. Self-renewal and differentiation capacity of young and aged stem cells. Exp Cell Res. 2008 Jun 10;314(9):1937–1944. PubMed PMID: 18439579.
- Bhatia-Dey N, Kanherkar RR, Stair SE, et al. Cellular senescence as the causal nexus of aging. Front Genet. 2016;7:13. PubMed PMID: 26904101; PubMed Central PMCID: PMCPMC4751276.
- Campisi J, d’Adda Di Fagagna F. Cellular senescence: when bad things happen to good cells. Nat Rev Mol Cell Biol. 2007 Sep;8(9):729–740. PubMed PMID: 17667954.
- Hayflick L, Moorhead PS. The serial cultivation of human diploid cell strains. Exp Cell Res. 1961 Dec;25:585–621. PubMed PMID: 13905658
- Ben-Porath I, Weinberg RA. The signals and pathways activating cellular senescence. Int J Biochem Cell Biol. 2005 May;37(5):961–976. PubMed PMID: 15743671.
- Hoenicke L, Zender L. Immune surveillance of senescent cells–biological significance in cancer- and non-cancer pathologies. Carcinogenesis. 2012 Jun;33(6):1123–1126. PubMed PMID: 22470164.
- Kang TW, Yevsa T, Woller N, et al. Senescence surveillance of pre-malignant hepatocytes limits liver cancer development. Nature. 2011 Nov 9;479(7374):547–551. PubMed PMID: 22080947.
- Sagiv A, Biran A, Yon M, et al. Granule exocytosis mediates immune surveillance of senescent cells. Oncogene. 2013 Apr 11;32(15):1971–1977. PubMed PMID: 22751116; PubMed Central PMCID: PMCPMC3630483.
- Sagiv A, Burton DG, Moshayev Z, et al. NKG2D ligands mediate immunosurveillance of senescent cells. Aging (Albany NY). 2016 Feb;8(2):328–344. PubMed PMID: 26878797; PubMed Central PMCID: PMCPMC4789586.
- Brighton PJ, Maruyama Y, Fishwick K, et al. Clearance of senescent decidual cells by uterine natural killer cells in cycling human endometrium. Elife. 2017 Dec 11;6. PubMed PMID: 29227245; PubMed Central PMCID: PMCPMC5724991.
- Hinds P, Pietruska J. Senescence and tumor suppression. F1000Res. 2017;6:2121. PubMed PMID: 29263785; PubMed Central PMCID: PMCPMC5730862.
- Davalos AR, Coppe JP, Campisi J, et al. Senescent cells as a source of inflammatory factors for tumor progression. Cancer Metastasis Rev. 2010 Jun;29(2):273–283. PubMed PMID: 20390322; PubMed Central PMCID: PMCPMC2865636.
- Hoare M, Ito Y, Kang TW, et al. NOTCH1 mediates a switch between two distinct secretomes during senescence. Nat Cell Biol. 2016 Sep;18(9):979–992. PubMed PMID: 27525720; PubMed Central PMCID: PMCPMC5008465.
- De Visser KE, Eichten A, Coussens LM. Paradoxical roles of the immune system during cancer development. Nat Rev Cancer. 2006 Jan;6(1):24–37. . PubMed PMID: 16397525.
- Padeken J, Zeller P, Gasser SM. Repeat DNA in genome organization and stability. Curr Opin Genet Dev. 2015 Apr;31:12–19. PubMed PMID: 25917896.
- Ryu SH, Kang K, Yoo T, et al. Transcriptional repression of repeat-derived transcripts correlates with histone hypoacetylation at repetitive DNA elements in aged mice brain. Exp Gerontol. 2011 Oct;46(10):811–818. PubMed PMID: 21782924.
- Chiappinelli KB, Strissel PL, Desrichard A, et al. Inhibiting DNA methylation causes an interferon response in cancer via dsRNA including endogenous retroviruses. Cell. 2015 Aug 27;162(5):974–986. PubMed PMID: 26317466; PubMed Central PMCID: PMCPMC4556003.
- Roulois D, Loo Yau H, Singhania R, et al. DNA-demethylating agents target colorectal cancer cells by inducing viral mimicry by endogenous transcripts. Cell. 2015 Aug 27;162(5):961–973. PubMed PMID: 26317465; PubMed Central PMCID: PMCPMC4843502.
- Capone S, Connor KM, Colombo A, et al. Senescent human hematopoietic progenitors show elevated expression of transposable elements and inflammatory genes. Exp Hematol. 2018 Mar 13. PubMed PMID: 29549053. DOI:10.1016/j.exphem.2018.03.003.
- Chang J, Wang Y, Shao L, et al. Clearance of senescent cells by ABT263 rejuvenates aged hematopoietic stem cells in mice. Nat Med. 2016 Jan;22(1):78–83. PubMed PMID: 26657143; PubMed Central PMCID: PMCPMC4762215.
- Baar MP, Brandt RMC, Putavet DA, et al. Targeted apoptosis of senescent cells restores tissue homeostasis in response to chemotoxicity and aging. Cell. 2017 Mar 23;169(1):132–147.e16. PubMed PMID: 28340339; PubMed Central PMCID: PMCPMC5556182.
- Baker DJ, Childs BG, Durik M, et al. Naturally occurring p16(Ink4a)-positive cells shorten healthy lifespan. Nature. 2016 Feb 11;530(7589):184–189. PubMed PMID: 26840489; PubMed Central PMCID: PMCPMC4845101.
- Baker DJ, Wijshake T, Tchkonia T, et al. Clearance of p16Ink4a-positive senescent cells delays ageing-associated disorders. Nature. 2011 Nov 2;479(7372):232–236. PubMed PMID: 22048312; PubMed Central PMCID: PMCPMC3468323.
- Zhu Y, Tchkonia T, Fuhrmann-Stroissnigg H, et al. Identification of a novel senolytic agent, navitoclax, targeting the Bcl-2 family of anti-apoptotic factors. Aging Cell. 2016 Jun;15(3):428–435. PubMed PMID: 26711051; PubMed Central PMCID: PMCPMC4854923.
- Purcell M, Kruger A, Tainsky MA. Gene expression profiling of replicative and induced senescence. Cell Cycle. 2014;1324:3927–3937. PubMed PMID: 25483067; PubMed Central PMCID: PMCPMC4615143.
- Pawlikowski JS, McBryan T, Van Tuyn J, et al. Wnt signaling potentiates nevogenesis. Proc Natl Acad Sci USA. 2013 Oct 1;110(40):16009–16014. PubMed PMID: 24043806; PubMed Central PMCID: PMCPMC3791768.
- Bray NL, Pimentel H, Melsted P, et al. Near-optimal probabilistic RNA-seq quantification. Nat Biotechnol. 2016 May;34(5):525–527. PubMed PMID: 27043002.
- Colombo AR, Triche TJ, G R. Arkas: rapid reproducible RNAseq analysis. F1000Res. 2017;6:586. PubMed PMID: 28868134; PubMed Central PMCID: PMCPMC5553089.
- Risso D, Schwartz K, Sherlock G, et al. GC-content normalization for RNA-Seq data. BMC Bioinformatics. 2011 Dec 17;12:480. PubMed PMID: 22177264; PubMed Central PMCID: PMCPMC3315510.
- Robinson MD, McCarthy DJ, Smyth GK. edgeR: a Bioconductor package for differential expression analysis of digital gene expression data. Bioinformatics. 2010 Jan 1;26(1):139–140. PubMed PMID: 19910308; PubMed Central PMCID: PMCPMC2796818.
- Schoggins JW. Interferon-stimulated genes: roles in viral pathogenesis. Curr Opin Virol. 2014 Jun;6:40–46. PubMed PMID: 24713352; PubMed Central PMCID: PMCPMC4077717.
- Yaari G, Bolen CR, Thakar J, et al. Quantitative set analysis for gene expression: a method to quantify gene set differential expression including gene-gene correlations. Nucleic Acids Res. 2013 Oct;41(18):e170. PubMed PMID: 23921631; PubMed Central PMCID: PMCPMC3794608.
- Leonova KI, Brodsky L, Lipchick B, et al. p53 cooperates with DNA methylation and a suicidal interferon response to maintain epigenetic silencing of repeats and noncoding RNAs. Proc Natl Acad Sci USA. 2013 Jan 2;110(1):E89–98. PubMed PMID: 23236145; PubMed Central PMCID: PMCPMC3538199.
- Cho YH, Woo HD, Jang Y, et al. The association of LINE-1 hypomethylation with age and centromere positive micronuclei in human lymphocytes. PLoS One. 2015;10(7):e0133909. PubMed PMID: 26196382; PubMed Central PMCID: PMCPMC4510364.
- Sun D, Luo M, Jeong M, et al. Epigenomic profiling of young and aged HSCs reveals concerted changes during aging that reinforce self-renewal. Cell Stem Cell. 2014 May 1;14(5):673–688. PubMed PMID: 24792119; PubMed Central PMCID: PMCPMC4070311.
- Wang J, Geesman GJ, Hostikka SL, et al. Inhibition of activated pericentromeric SINE/Alu repeat transcription in senescent human adult stem cells reinstates self-renewal. Cell Cycle. 2011 Sep 1;10(17):3016–3030. PubMed PMID: 21862875; PubMed Central PMCID: PMCPMC3218602.
- Colombo AR, Zubair A, Thiagarajan D, et al. Suppression of transposable elements in leukemic stem cells. Sci Rep. 2017 Aug 1;7(1):7029. 10.1038/s41598-017-07356-9. PubMed PMID: 28765607; PubMed Central PMCID: PMCPMC5539300.
- Wang L, Leite De Oliveira R, Wang C, et al. High-throughput functional genetic and compound screens identify targets for senescence induction in cancer. Cell Rep. 2017 Oct 17;21(3):773–783. PubMed PMID: 29045843.
- Yang H, Wang H, Ren J, et al. cGAS is essential for cellular senescence. Proc Natl Acad Sci USA. 2017 Jun 6;114(23):E4612–E4620. PubMed PMID: 28533362; PubMed Central PMCID: PMCPMC5468617.
- Konkel MK, Batzer MA. A mobile threat to genome stability: the impact of non-LTR retrotransposons upon the human genome. Semin Cancer Biol. 2010 Aug;20(4):211–221. . PubMed PMID: 20307669; PubMed Central PMCID: PMCPMC2925057.
- Solovyov A, Vabret N, Arora KS, et al. Global cancer transcriptome quantifies repeat element polarization between immunotherapy responsive and T cell suppressive classes. Cell Rep. 2018 Apr 10;23(2):512–521. PubMed PMID: 29642008.