
 ?Mathematical formulae have been encoded as MathML and are displayed in this HTML version using MathJax in order to improve their display. Uncheck the box to turn MathJax off. This feature requires Javascript. Click on a formula to zoom.
ABSTRACT
Functional p53 signaling is essential for appropriate responses to diverse stimuli. P53 dynamics employs the information from the stimulus leading to selective gene expression and cell fate decision. However, the decoding mechanism of p53 dynamics under DNA damage challenge remains poorly understood. Here we mathematically modeled the recently dual-phase p53 dynamics under doxorubicin treatment. We found that p53 could perform sequential pulses followed by a high-amplitude terminal pulse at relatively low doxorubicin treatment, whereas p53 became steadily accumulated when damage level was high. The effective p53 integral above a threshold but not the absolute accumulation of p53 precisely discriminated survival and death. Silencing negative regulators in p53 network might promote the occurrence of terminal pulse. Furthermore, lower binding affinity and degradation rate of p53 target genes could favorably discriminate high and low dose doxorubicin treatment. Grouping by temporal profiles suggested that the p53 dynamics rather than the doxorubicin doses could better discriminate cellular outcomes and confer less variation for effective p53 integral reemphasizing the importance of p53 level regulation. Our model has established a theoretical framework that p53 dynamics can work cooperatively with its binding affinity to target genes leading to cell fate choice, providing new clues of optimized clinical design by manipulating p53 dynamics.
Introduction
Many transcription factors can respond to external or internal signals and initiate specific downstream programs. The specificity between the input and output may be obtained through multiple strategies such as regulations at transcriptional, translational and posttranslational levels and spatial locations [Citation1–Citation3]. Another layer of regulation derives from the temporal dynamics of transcription factors in which signaling molecules may decode response specificity into rich dynamic features [Citation1]. A notable example is the tumor suppressor p53, which can manifest itself in pulsatile or sustained activation to dictate cell fate [Citation4]. The encoding mechanisms of the complex dynamic features can be ascribed to intricate coordination of feedback loops [Citation5]. Understanding the underlying mechanisms which detect the time evolution of transcription factors and decode them into differential gene expression patterns and cell fate remains a daunting task.
The tumor suppressor p53 acts as a central node in sensing various stimuli and initiates appropriate responses ranging from cell cycle arrest, senescence and apoptosis [Citation6]. The DNA double strand breaks (DSBs) elicited by either irradiation or DNA damaging drugs (e.g. doxorubicin, etoposide) represent a lethal type of signals which can faithfully activate p53 through several checkpoint kinases (e.g. ataxia-telangiectasia-mutated, ATM) [Citation7]. There are a number of positive and negative auto-regulatory feedback loops which actively participate in the regulation of p53 network [Citation8–Citation10]. Consequently, the p53 dynamics at single cell levels under DNA damage exhibit complex patterns ranging from spontaneous or synchronized pulses to sustained elevation [Citation4,Citation11–Citation14]. In a recently report, Wu et al. identified a novel p53 dynamics in response to DNA damage in which a prolonged and mild challenge using genotoxic drugs can evoke sequential p53 pulses followed by a terminal pulse with high amplitude to enact apoptosis [Citation13]. Moreover, an acute and high-dose treatment will trigger a monotonic increase of p53 with similar rate of apoptosis and decreased lifespan [Citation13]. They argued that p53 should exceed a threshold with sufficient accumulation to trigger apoptotic programs and they termed this novel pattern as effective cumulative p53 [Citation13]. However, the exact mechanism underlying how effective cumulative p53 is dynamically generated and manipulates cell fate specifically through theoretical perspectives still remains elusive.
In current work, we investigated how p53 dynamics determines cell fate by constructing a simplified p53 model using ordinary differential equations (ODEs). We first faithfully reproduced the complex patterns of p53 responses with doxorubicin (Dox) treatment under either wild type or genetically manipulated conditions using stochastic simulations. Generally, p53 can either display a finite number of pulses with or without the occurrence of a terminal pulse or a sustained activation depending on the doses of genetic drugs. Then, we identified a potential mechanism which unified p53 dynamics, binding affinity and turnover rates of target genes to dictate cell fate. We further postulated that dynamic features of p53 signaling rather than the amount of applied genetic drugs can encode phenotypic responses (e.g. survival and death). In addition, p53 dynamic features per se can dictate cell fate with markedly reduced variation. Our findings characterized the intricate interplay between effective accumulative p53 and cell fate using mechanistic models and may provide clues to optimized clinical strategies for chemotherapeutic drugs.
Results
Construction of a dynamic p53 model identifies the terminal pulses
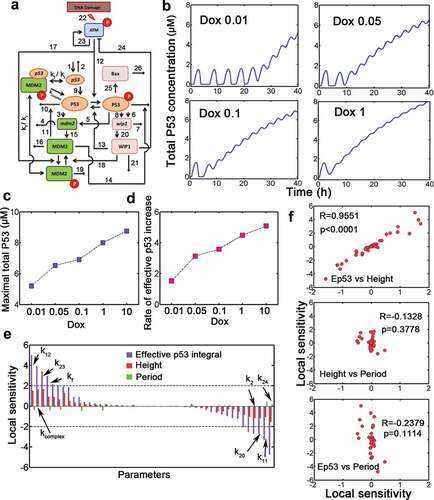
To investigate the dynamic p53 responses under doxorubicin (Dox) treatment, we constructed a mathematical model which primarily incorporated two negative p53 feedback loops and one implicit positive feedback loop [Citation15] (, Table S1 and S2). To match our model to experimental data, we varied the stimulus strength by changing the parameter Dox in silico, we found that cells performed sequential pulses and followed by a terminal pulse (as defined in Wu et al.’s work [Citation13]) with markedly high amplitude (). The elevation of total p53 was increased with higher Dox levels (). Notably, the amplitude and duration of pulses did not vary significantly under relatively low Dox treatment (, we in silico set Dox = 0.01, 0.05 or 0.1, the same doses as exemplified in Wu et al.’s work [Citation13]). Note that in current work, “Dox treatment” corresponds to the situation where we in silico changed the Dox parameter. For example, Dox = 0.01 in our model corresponds to 0.01 μM doxorubicin treatment). However, the maximal p53 level and accumulation rate of effective p53 integral (defined as effective p53 integral divided by time duration) increased monotonically with all Dox doses during the simulation within 40 hrs (). We next performed local sensitivity analysis and found that all kinetic parameters affected effective p53 integral more profoundly (). Moreover, pulse period was more robust to parametric change than amplitude (, compare green and red bars). Specifically, p53 phosphorylation by activated ATM (k12) and translation rate of MDM2p-bound p53 mRNA (kcomplex) positively influenced signaling amplitude and effective p53 accumulation, whereas MDM2-mediated p53 degradation (k11) and Wip1-induced ATM* deactivation (k24) may efficiently terminate p53 activation (, only relatively sensitive parameters were labeled). We compared the correlation among all sensitivity measures and found that only the local sensitivity of effective p53 integral and pulse height was highly correlated (). These deterministic data identified the sensitive parameters and terminal pulses in p53 signaling.
Figure 1. A mathematical p53 model identifies p53 terminal pulses. (a) Schematic representation of p53 regulatory network for our model. The numbers correspond to kinetic parameters in Table S2. The parameters kf and kr represent association and dissociation respectively between p53 mRNA and phosphorylated MDM2. (b) Concentration of total p53 level at various doxorubicin doses (Dox, from 0.01 to 1). (c) Maximal p53 levels under increasing Dox levels. (d) Time-averaged effective p53 integral (i.e. rate of effective p53 increase in units of μM) against increasing Dox levels was plotted. The end of the simulation is 40 h. (e) (Relative) local sensitivity coefficient of kinetic parameters for effective p53 integral (violet), p53 pulse height (red) and period (green). The most sensitive parameters were marked. The local sensitivity is in units of 1. (f) Correlation between sensitivity measures was shown. R denotes Spearman correlation coefficient. ‘Ep53ʹ denotes effective p53 integral.
Simulation of dynamic behavior mediated by effective p53 integral
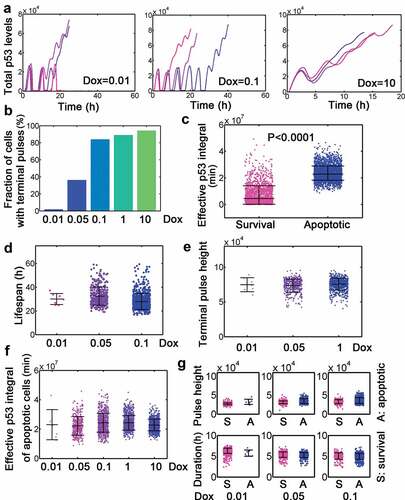
The deterministic model did not consider the process of doxorubicin clearance as well as the biological noises, therefore we performed stochastic simulations. Simulation results showed that a fraction of cells only showed discrete number of pulses suggesting that Dox might be totally removed or cleared below the threshold when Dox was set to 0.1 (, left). However, cells (‘cells’ in in silico simulation indicated a stochastic representation during simulation thereafter) may display sequential pulses accompanied by a high-amplitude terminal pulse at low or medium Dox challenge (, left and middle, FigureS1). Acute high dose Dox could even lead to sustained activation of p53 (, right, FigureS1). The fraction of cells with terminal pulses also increased with elevated Dox stimulation (). By sorting cells by cell fate, we noticed that the effective p53 integral in apoptotic cells was significantly higher than that in survival cells ( and Fig. S2). Instead, the lifespan and terminal pulse height were not varied markedly across different doses of Dox (). The effective p53 integral of apoptotic cells, however, was not significantly changed with varying Dox values (). The pulse height and duration were conserved when cells were challenged with relatively low doses of Dox (). Furthermore, the dynamic properties above (i.e. statistical comparison) were not affected by locally changing the minimum effective level (data not shown). These results were qualitatively consistent with experimental findings [Citation13] and validated our stochastic model.
Figure 2. Dynamic features of dual-phase p53 under stimulation by different Dox dosage. (a) Selected total p53 trajectories when Dox = 0.01, 0.1 and 10. Note that the unit of ‘p53 levels’ in stochastic simulation is 1. (b) Fraction of terminal pulses at different Dox levels. (c) Comparison of effective p53 integral between survival and apoptotic cells. The unit for effective p53 integral during stochastic simulation is ‘min’ thereafter. (d-e) Lifespan (d) and terminal pulse height (e) treated by relatively low levels (0.01, 0.05 and 0.1) of Dox. Data were represented as mean±SD. (f) Effective p53 integral of apoptotic cells under different Dox levels. (g) Pulse height (top) and duration (bottom) for cells with Dox = 0.01, 0.05 and 0.1.
Silencing negative regulators in p53 pathway enhances apoptosis without altering effective p53 integral
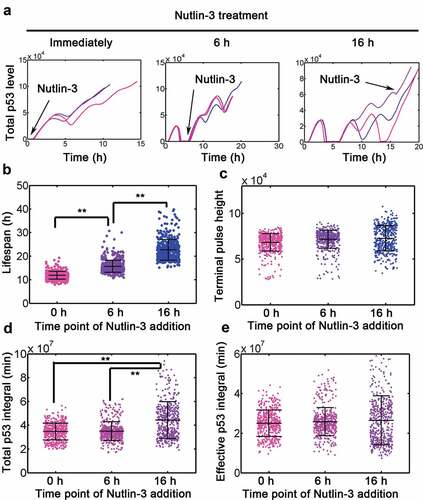
To further validate the concept of effective p53 integral, we simulated the effect of manipulating MDM2 expression. We first knocked down MDM2 by in silico lowering MDM2 expression. We found that MDM2 silence promoted steady accumulation of p53 and generally induced an earlier onset of terminal pulses (Fig. S3A). In addition, the average lifespan was consistently shortened by decreasing MDM2 (Fig. S3B). However, the effective p53 integral did not vary significantly in apoptotic cells (Fig. S3C). We also simulated the effect of Nutlin-3 treatment at 0, 6 and 16 h with Dox = 0.1. Simulating Nutlin-3 treatment in silico accelerated the accumulation of p53 (Figure 3(a)). The earlier addition of Nutlin-3 induced significantly shortened lifespan in cells (). However, the terminal pulses held constant across different regimes (). The total accumulative p53 (i.e. total p53 integral) steadily increased with different treatments (), the effective p53 integral was conserved irrespective of the time for Nutlin-3 addition (). We also silenced another negative regulator Wip1 in p53 signaling and found that lowering Wip1 in silico profoundly increased p53 accumulation and earlier onset of terminal pulses (FigureS4A). The lifespan was significantly lowered with reduced Wip1 expression (Fig. S4B). Not surprisingly, the effective p53 integral was not changed significantly with or without in silico si-Wip1 (FigureS4C). These results supported that repression of negative regulators in p53 pathway could promote apoptosis without changing the effective p53 integral. Altogether, our mathematical model faithfully recapitulated key experimental findings and could be used to further unravel the dynamic implications of dual-phase p53 patterns.
Figure 3. Simulation of effect Nutlin-3 treatment. (a) Representative traces of p53 treated with Dox = 0.1 combined with Nutlin-3 added immediately or at 6 and 16 h, following Dox treatment. To simulated the effect of Nutlin-3 treatment, k11 and k14 were simultaneously lowed by 5 fold. (b-e) Lifespan (b), terminal pulse height (c), total p53 integral (d) and effective p53 integral in apoptotic cells (e) for 500 simulations with nutlin-3 addministration immediately or at 6 and 16 h (Dox = 0.1), respectively. ANOVA was used to detect the statistical significance. **: P < 0.01.
Gene expression specificity determined by effective p53 integral
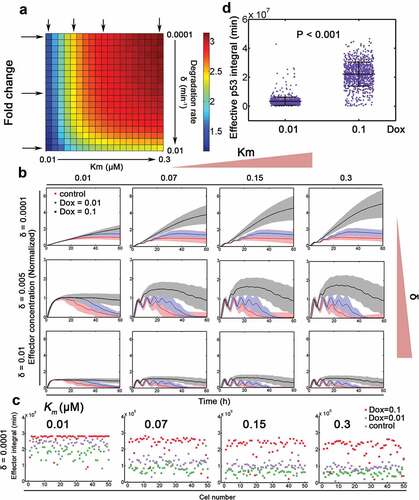
Wu et al. proposed that effective p53 integral cooperates with binding affinity to regulate downstream gene expression [Citation13]. We then modeled this scenario by sampling two parameters (Km and δ) associated with gene expression (see notes in Table S1 and Table S2). Then, stochastic simulation was performed for each parametric combination for three Dox doses (Dox = 0.00005 as control, Dox = 0.01 and 0.1 as stressed condition, ). The integrated relative fold change of downstream effector with Dox = 0.1 compared with that with Dox = 0.01 was shown (, colormap was normalized to the maximum expression under control condition). We found that higher Km (i.e. lower binding affinity) and lower degradation rate could facilitate the fold change in gene expression between Dox = 0.1 and Dox = 0.01 (). The temporal dynamics of downstream effector induction further showed that slowly degraded effector with moderate or high Km could discriminate between relatively high and low Dox (). Moreover, downstream effector with higher binding affinity (low Km) failed to differentiate between Dox = 0.1 and Dox = 0.01 especially at early time points (). The scatter plot further supported that genes with lower binding affinity and degradation could enlarge the differences in gene expression between Dox = 0.1 and Dox = 0.01 (n = 50 for each dose, and Fig. S5). The effective p53 integral was also significantly larger in cells under 0.1 μM Dox treatment (). These results were qualitatively consistent with Wu et al.’s data [Citation13] and further argued that gene expression specificity might be conferred via binding affinity of transcription factor and effector degradation rates.
Figure 4. Gene expression specificity by p53 binding affinity and target gene stability. (a) Relative fold change of target gene expression under 0.1 and 0.01 Dox treatment with varying binding affinity (Km in μM, equivalent to k11 in Table S1) and target gene degradation rates (δ, min−1). Arrows represent exemplified situations in (B). (b) Stochastic simulations of target gene expression with varying transcription factor binding affinity and target gene stability. The mean trajectories (solid) for control (Dox = 0.00005, red), 0.01 (blue) and 0.1 (black) Dox were shown. Shaded areas represent 95% confidence intervals. (c) The integral of putative downstream effector (i.e. p53 target gene) under control, 0.01 and 0.1 Dox treatment was depicted with δ = 0.0001 (min−1). N = 50 cases of stochastic simulations in (B) were shown. Km values (from left to right: 0.01, 0.07, 0.15 and 0.3 μM) were displayed on top. (d) Effective p53 integral under 0.01 and 0.1 Dox treatment, respectively. Mann-Whitney test was used.
P53 overexpression facilitates terminal pulses and promotes apoptosis
We have simulated the threshold effect in p53 activation, we next argued that overexpressing p53 may also increase the effective p53 integral and favor apoptosis induction. By gradually increasing the production rate of p53 mRNA, we found that the system could ease the occurrence of p53 terminal pulses even at Dox = 0.1 (Fig. S6A). The fraction of cells with apoptosis was also increased with enhanced p53 overexpression (Fig. S6B). These data supported that manipulating p53 levels per se can also favor p53 terminal pulses and promote apoptosis.
Dynamic features of p53 signaling determines phenotypic responses
In stochastic simulation, we have found pronounced cell-to-cell viability with varying Dox levels (Fig. S7A). For example, dynamic responses when Dox = 1 either showed transient responses with sequential number of pulses or terminal pulses resembling those typically observed upon stimulation with Dox = 0.1 ( and S7A). Therefore, dynamic responses were overlapping markedly between input levels and only partially determined by stimulus strength. To identify the encoded information despite the strong heterogeneity, we hypothesized that phenotypic responses were determined by p53 activation patterns rather than the amount of Dox applied to the system. We used k-mean clustering to group all signaling p53 dynamics into five classes (). The median time courses of five signaling clusters showed distinct dynamic patterns compared with corresponding cells defined by Dox levels ( and S7. Note that to allow clustering, all temporal courses of p53 within 60 h were retained irrespective of apoptotic status). Cluster 1 showed on average a pulsatile behavior (low responder) while the other clusters (clusters 2–5) revealed significantly elevated p53 responses with varying duration (high responder, ). However, grouping dynamics by Dox levels displayed a gradual evolution from pulsatile to high-amplitude elevation of p53 (). As expected, increasing Dox concentrations may induce a shift from low responder to high responders (). The shift is gradual implying that cells in a given dose could contain cells in several signaling clusters. Meanwhile, cells with the same Dox stimulation were more different in their dynamic behavior than cells grouped into a signaling cluster (). There were more positive silhouette scores in signaling classification by dynamic clusters than those in classification by Dox levels ()). The phenotypic responses, such as lifespan and effective p53 integral showed in general a gradual dependence on Dox levels (), top panels). However, these phenotypic responses exhibited a clear-cut pattern if p53 dynamics were clustered by signaling dynamics (, bottom panels). Therefore, signaling clusters may provide a better separation of phenotypic responses compared with Dox doses. These results suggested that signaling dynamics rather than the stimulus doses encode for cellular behavior and could determine phenotypic outcomes.
Figure 5. P53 dynamics decompose into distinct signaling classes. (a) Time-resolved analysis of p53 dynamics for varying stimulus levels as indicated (Dox = 0.01–10). 20 representative cases were shown as well as the population median (red). (b) P53 dynamics were clustered into 5 signaling classes according to their time-resolved data. The population median values were shown (red). (c) Distributions of signaling classes depending on Dox levels. (D-E) Silhouette plots of cells sorted according to signaling classes (d) and Dox levels (e). Positive silhouette scores indicate that P53 dynamics are more similar to the own group, whereas negative scores indicate that the trajectory is closer to any of the other groups. (f) The lifespan distribution of cells treated with different Dox levels (top) or dynamic clusters (top). Note that if cell survived during the whole simulation period (60 h), the lifespan was recorded as 60 h. (g) Effective p53 integral for cells with varying Dox (top) and different clusters (bottom).
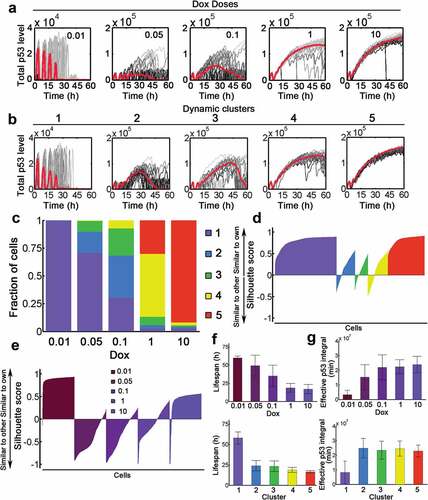
Decomposition into dynamic clusters confers sharp transition and less variability to effective p53 integral
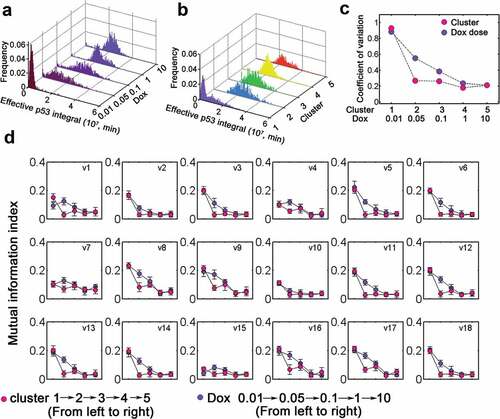
Since the effective p53 integral can determine cell fate [Citation13], we then investigated how variability of effective p53 integral evolves with distinct Dox doses or dynamic clusters. The distribution under low dose Dox treatment was skewed while it became more concentrated with increasing Dox doses (). However, there was a sharp transition of effective p53 integral from high to low variability between cluster 1 and 2–5 (). Notably, the variation gradually decayed with increasing Dox (). Instead, dynamic clusters clearly differentiate low (cluster 2–5) from high (cluster 1) variation in effective p53 integral (). Meanwhile, the distribution and variability were comparable among clusters 2–5 (). Next, we used information theoretical metrics to calculate the mutual dependence between effective p53 integral and dynamic processes (the rates v1-v18 were defined in Table S3). In most cases, the mutual dependence gradually decreased with increasing Dox (, violet) whereas in principle a swift decline occurred from cluster 1 to clusters 2–5 (, rose carmine). This was primarily due to the reduced variability (i.e. enhanced robustness) in effective p53 integral at higher Dox or cluster 2–5 (). Notably, the reduced mutual information for basal p53 (v7) and Wip1 turnover (v4 and v15) with Dox = 0.01 or at cluster 1 indicated that Wip1 and p53 were kept at low levels with relatively less variation (). These data suggested that decomposition into dynamic clusters induced sharp transition of effective p53 integral.
Figure 6. Classification into dynamic clusters produces switch-like transition. (a) Distribution of effective p53 integral for varying Dox levels (0.01–10). (b) Distribution of effective p53 integral for five dynamic clusters. (c) The coefficient of variation for cells stimulated with various Dox (violet) or in distinct clusters (rose carmine). (d) Mutual information index with increasing Dox (violet) and different clusters (rose carmine). The details for kinetic processes (v1-v18) were listed in Table S3.
Discussion
Efficient information processing by the p53 pathway is crucial during stress response. Our current model qualitatively replicated the dual-phase dynamics of p53 in response to chemotherapeutic drugs. We modeled the observation that the occurrence of p53 terminal pulses correlated with cell death and manipulating p53 regulators could affect the terminal pulses without significant changes in effective p53 integral of apoptotic cells. Furthermore, we argued that it was the dynamic patterns could determine effective p53 accumulation. Dynamic clusters may provide less variability and more faithful discrimination for effective p53 integral and cell fate.
The occurrence of terminal pulses relied heavily on positive feedback loops. In current study, we considered the effect of MDM2-p53 mRNA binding to enhance p53 mRNA translation [Citation15]. Notably, the p53 system is pervaded with positive feedback loops [Citation8–Citation10]. Incorporating any positive feedback loop in our model may support the p53 terminal pulses although the detailed mechanisms and kinetic parameters may differ (data not shown). Previous studies have shown that p53 may be activated in either pulsatile or sustained mode in response to DNA damage depending on stimulus type [Citation4,Citation11,Citation12,Citation16,Citation17]. An intriguing hypothesis would be that multiple feedback loops in p53 network may display cell-specific activities and contribute to the diversity of p53 dynamics similar to the observation in MAPK signaling [Citation18,Citation19]. Furthermore, Purvis et al. found that sustained p53 activation induces senescence whereas pulsed p53 allows recovery and growth although pulsed and sustained p53 signaling show equivalent cumulative p53 levels [Citation4]. Since the effective p53 integral under high doxorubicin treatment or sustained p53 activation might be significantly higher than that under pulsatile condition, the conceptual framework of effective p53 integral can also explain the observation in Purvis et al.’s work [Citation4].
An earlier model developed by Zhang et al. also described a ‘two-phase’ p53 dynamics in response to DNA damage [Citation20]. In their model, p53 only performs sequential pulses if low levels of DNA damage are applied. Moreover, when DNA damage is high, p53 always shows fixed number of pulses before the onset of sustained p53 activation [Citation20]. However, a mild challenge by doxorubicin triggers sequential p53 pulses and occasionally results in terminal pulses. Applying a high dose doxorubicin treatment will abruptly lead to sustained p53 activation without the appearance of sequential pulses in Wu et al.’s experiments [Citation13]. Therefore, Zhang et al.’s model at best is only valid under low dose doxorubicin treatment and cannot be used to characterize the sustained elevation of p53 in response to high doxorubicin doses.
The p53 dynamics can work cooperatively with binding affinity to differentiate the transactivation of target genes in Wu et al.’s work [Citation13]. It is the effective p53 integral above the threshold rather than the absolute level of p53 integral that orchestrates gene expression and cell fate. Under mild doxorubicin challenge, although p53 pulses consecutively exceed the threshold, the cumulative integral above the threshold is insufficient to ignite apoptosis. When the DNA damage persists at high level, the accumulation of effective p53 then becomes competent to markedly transactivate proapoptotic genes and trigger apoptosis. The competence could be ascribed to the disruption of the balance between positive and negative feedback loops in p53 signaling to induce high-amplitude terminal pulses. Notably, we only focus on the dynamic aspects of p53-mediated cell fate decision. Other mechanisms such as post-translational modification, molecular interaction or subcellular translocation may provide additional complexity.
Our model suggested that lower binding affinity and degradation could better differentiate gene expression between high and low DNA damage (). We noted that some key downstream factors such as MDM2 and PPM1D can mirror p53 dynamics indicative of short half-life [Citation4,Citation21]. However, factors involved in terminal fate (e.g. Bax, APAF-1 and PUMA) are relatively stable and show steady accumulation when p53 network becomes highly activated [Citation22,Citation23]. Therefore, the increased stability for p53 downstream regulators involved in apoptosis (at least for those mentioned in Wu et al.’s work [Citation13]) could help differentiate the transactivation of different target genes and promote cell fate decision. Furthermore, previous study indicates that common p53 ‘binding affinity’ (Km) for downstream targets is primarily distributed within 0.04 ~ 0.58 μM similar to the settings in our model () whereas apoptotic genes generally showed lower binding affinity [Citation24]. Therefore, individual or combinatorial effect of stability and binding affinity may facilitate gene expression specificity and promote cell fate decision.
The signaling clusters represent mathematically identifiable classes for time series and provide more homogeneous grouping compared to stimulus concentrations. The definition of five clusters remains a heuristic choice [Citation25]. Notably, p53 dynamics vary abruptly from cluster 1 to cluster 2–5 and provide clear-cut response patterns (e.g. lifespan, effective p53 integral), whereas grouping by doxorubicin doses represents a continuum of dynamic patterns. Noticeably, p53 temporal profiles will terminate when cells undergo apoptosis and therefore, most temporal p53 trajectories in cluster 2–5 will not persist for the entire 60 h (i.e. profiles in cluster 2–5 become more homogeneous). As a result, grouping by temporal profiles may better discriminate cell fate. In cluster 1, we found that on average cells performed consecutive pulses with occasionally terminal pulses. Profiles in cluster 1 indicated low effective p53 integral and longer lifespan, implying that these dynamic patterns favored survival (survival cluster). Instead, nearly all profiles in cluster 2–5 ended in p53 terminal pulses with significantly reduced lifespan and high effective p53 integral (dead cluster). Therefore, the dynamic clustering suggested that pulsed p53 may favor survival until the occurrence of high-amplitude terminal pulses. The stimulus strength will determine the fraction of cells in each cluster and the fraction in dead cluster was gradually elevated with increasing stimulus. Collectively, manipulating wild type p53 levels (i.e. effective p53 integral) might be an effective strategy to tip the balance between survival and death.
There are also limitations in our current work. We did not consider the subcellular localization of specific proteins although this may possibly confer enhanced ultrasensitivity/nonlinearity in p53 signaling. ATM-independent effect on DSB repair was also not considered as it only affected the repairing rate but not the feedback architecture in p53 signaling [Citation26]. Previous studies showed that MDMX and c-Abl also affect p53 levels [Citation27,Citation28]. However, these regulatory mechanisms do not function through feedback mechanisms and therefore do not exert significant influence on dual-phase nature of p53 under doxorubicin treatment. We only emphasized the effect of interlocked negative and positive feedback loops in p53 network and other detailed regulatory effects were not considered for simplicity.
In conclusion, we have modeled the dual-phase p53 dynamics under doxorubicin treatment and elucidated the putative determinant for p53-mediated cell fate decision. As aberrant p53 signaling is usually linked to tumor progression, our current model may help ignite new clues to optimized clinical design for chemotherapeutic drugs.
Materials and methods
Model construction
We modeled the p53 regulatory network containing 11 species and 30 reactions (). For p53, MDM2 and Wip1, we incorporated both mRNA and protein representation. The conventional genotoxic drug doxorubicin (Dox) was shown to induce DNA double strand breaks (DSBs) with a half-life around 11.7 h [Citation29] corresponding to an approximate clearance rate of 0.001 min−1. Therefore, we assumed that Dox clearance underwent an exponential decay with a clearance rate of 0.001 min−1 in stochastic simulation. The DNA damage can phosphorylate and activate the checkpoint kinase Ataxia-telangiectasia mutated (ATM) [Citation30]. Total ATM levels were considered as a constant because data have shown that total ATM does not change significantly within 72 hours post stimulation [Citation31]. Activated ATM (ATM*) can phosphorylate p53 and MDM2, which become stabilized or destabilized, respectively [Citation32,Citation33]. We incorporated two negative feedback loops (P53-MDM2 and P53-Wip1-ATM) as suggested by Lahav et al [Citation34]. In response to DNA damage, p53 can be phosphorylated, activated and induce MDM2 expression, which in turn targets p53 for proteasome degradation. The second negative feedback loop involves p53 induced Wip1 upregulation and ATM deactivation [Citation35]. The levels of Dox denote model input and affect the DNA damage induced ATM activation as previously [Citation36] (Table S1 and S2).
Gajjar et al. have found that under doxorubicin treatment, ATM can phosphorylate MDM2 at Ser395 and allosterically altered MDM2 can bind p53 mRNA [Citation15]. The phosphorylated MDM2 at Ser 395 can further enhance p53 mRNA translation [Citation15]. We incorporated this interaction in our model and assumed that p53 mRNA can bind phosphorylated MDM2 (MDM2p) and form a p53 mRNA-MDM2p complex. We also assume that this complex can promote p53 protein translation with higher efficiency (Table S1 and S2). We did not consider the subcellular localization not only for simplicity but also owing to the fact that the detailed mechanism by which MDM2-dependent nucleolar targeting of p53 mRNA enhances its translation and its detailed subcellular trafficking events remain elusive [Citation15]. All the dynamic reactions were formulated using ordinary differential equations (ODEs) (Table S1) with parameter description listed in Table S2.
Model parameterization
p53 mRNA has a long half-life from 10 to 22–23hours in different cells [Citation37]. We assigned 0.001 min−1 (k2) corresponding to a half-life ~11.6 h. The half-life of MDM2 mRNA is reported to be within 1 to 2 hours [Citation38,Citation39] implying a degradation rate from 0.005775 to 0.01155 min−1. Therefore, we set this parameter to be 0.006 (k4). Basal mdm2 induction rate (k3), MDM2 dependent P53p degradation rate (k14), mdm2 translation rate (k15), basal MDM2 degradation rate (k16), the threshold concentration of MDM2 dependent p53 (K3) and P53p degradation (K6) were set according to Ma et al’s model [Citation40]. The turnover rate of p53 (k10) and MDM2 dependent p53 degradation (k11) were assigned according to Cai et al [Citation37]. MDM2 undergoes phosphorylation and accelerated degradation in DNA damage response and we therefore assigned a roughly 10-fold increase in MDM2p degradation rate (k19) [Citation41]. Wip1 dependent dephosphorylation rate (k13) of phosphorylated p53 (P53p), basal Wip1 degradation rate (k21) and Wip1 mediated ATM deactivation rates (k24 and K10) were derived from Zhang et al within the same order of magnitude [Citation20]. The dissociation constant kr/kf was set to be 100 nM qualitatively similar to Gajjar et al.’s measurement [Citation15]. The basal p53 production rate (k1), ATM* induced MDM2 activation (k17), the threshold concentration of p53 induced mdm2 (K1) and wip1 (K2) transcription were determined according to Chong et al’s data [Citation42]. All other parameters were estimated from our previous work [Citation43] to reproduce the dual-phase dynamics of p53.
Local parameter sensitivity
Local parameter sensitivity analysis provides dynamic responses to an infinitesimal disturbance in kinetic parameters. A dynamic system can be formulated by x’ = F(x, p), where x and p donate state vector and parameter vector for the system, respectively. Pulse amplitude and width sensitivity capture the variations of relative amplitude and duration in response to parametric changes. Relative amplitude sensitivity SA and width sensitivity SW are defined as
where A and W denote relative pulse amplitude and width, respectively. Note that normalized sensitivities are only locally valid in parameter space.
Mutual information index (MII)
A general measure of input-output associations can be provided by mutual information regardless of the shape of underlying distributions. Randomized perturbations of input parameters (X1, X2,…, XN) in parameter space within predefined range create a random output Y with a probability density p(y) . The entropy associated with Y is defined as
Conditional entropy can further be defined with one fixed Xi
The mutual information is defined as the difference between total entropy H(Y) and one preferred conditional entropy H(Y | Xi) to characterize the impact Xi exerts on Y.
Mutual information index (MII) can be defined as [Citation44]:
Metrics for terminal pulse, lifespan and effective p53 integral
Prolonged low-dose or acute high-dose doxorubicin treatment initiated a series of p53 pulses followed by an abrupt increase to high p53 amplitude (defined as ‘terminal pulse’) [Citation13]. The lifespan denotes the time duration from initial Dox treatment to the time point when apoptotic effector (e.g. Bax) reaches a pre-defined threshold (see below). According to Wu et al’s reports, p53 accumulation below a certain threshold may not activate proapoptotic genes [Citation13]. This threshold is defined as ‘minimal effective level’ (MEL) and the p53 accumulations (i.e. temporal integral) above the threshold are termed as ‘effective cumulative p53ʹ.
T denotes the time when apoptosis occurs. Note that in our simulation, the ‘MEL’ was assigned 1.8 × 10⁴). The time-averaged Ep53 is defined as follows:
In current study, ‘effective p53 integral’ refers to ‘effective cumulative p53ʹ and is sometimes abbreviated as Ep53.
Stochastic simulation
Since the maximum level of dynamic species was >105, we performed stochastic simulations by binomial τ-leap method according to Chatterjee et al and Leier et al’s work [Citation45,Citation46]. The kinetic delays were varied by 10% around the reference values during the simulation. We further assumed that the transcription is burst-like and the burst size positively correlated with the amount of transcription factors [Citation47]. In stochastic simulation, we assumed that Dox obeys an exponential decay with clearance rate 0.001. Meanwhile, p53 can transactivate the expression of an apoptotic effector (e.g. Bax in our model). If the Bax level reaches the threshold (2.1 × 10⁴), cells will immediately trigger apoptosis owing to the ‘Bax activation switch’ described in previous work [Citation48]. Therefore, the p53 trajectories may terminate at different time.
Model simulation
The ordinary differential equations were numerically integrated using the ode23s solver. Both stochastic and deterministic simulations were performed using MATLAB (MathWork, Version 8.1, R2013a).
Supplemental Material
Download MS Word (2.1 MB)Acknowledgments
This work is supported by National Natural Science Foundation of China (31400714, 31800316), Key Project of Natural Science Foundation of Anhui Provincial Education Department (KJ2017A359).
Disclosure statement
No potential conflict of interest was reported by the authors.
Supplementary material
Supplemental data for this article can be accessed here
Additional information
Funding
Related Research Data
References
- Purvis JE, Lahav G. Encoding and decoding cellular information through signaling dynamics. Cell. 2013;152(5):945–956.
- Sims RJ 3rd, Reinberg D. Is there a code embedded in proteins that is based on post-translational modifications? Nat Rev Mol Cell Biol. 2008;9(10):815–820.
- Vishwanath S, Sukhwal A, Sowdhamini R, et al. Specificity and stability of transient protein-protein interactions. Curr Opin Struct Biol. 2017;44:77–86.
- Purvis JE, Karhohs KW, Mock C, et al. p53 dynamics control cell fate. Science. 2012;336(6087):1440–1444.
- Legewie S, Herzel H, Westerhoff HV, et al. Recurrent design patterns in the feedback regulation of the mammalian signalling network. Mol Syst Biol. 2008;4:190.
- Zlotorynski E. Cancer biology: A neat target of p53. Nat Rev Mol Cell Biol. 2017;18(9):532.
- Joerger AC, Fersht AR. The p53 pathway: origins, inactivation in cancer, and emerging therapeutic approaches. Annu Rev Biochem. 2016;85:375–404.
- Harris SL, Levine AJ. The p53 pathway: positive and negative feedback loops. Oncogene. 2005;24(17):2899–2908.
- Park JH, Yang SW, Park JM, et al. Positive feedback regulation of p53 transactivity by DNA damage-induced ISG15 modification. Nat Commun. 2016;7:12513.
- Tu R, Kang W, Yang X, et al. USP49 participates in the DNA damage response by forming a positive feedback loop with p53. Cell Death Dis. 2018;9(5):553.
- Chen X, Chen J, Gan S, et al. DNA damage strength modulates a bimodal switch of p53 dynamics for cell-fate control. BMC Biol. 2013;11:73.
- Loewer A, Karanam K, Mock C, et al. The p53 response in single cells is linearly correlated to the number of DNA breaks without a distinct threshold. BMC Biol. 2013;11:114.
- Wu M, Ye H, Tang Z, et al. p53 dynamics orchestrates with binding affinity to target genes for cell fate decision. Cell Death Dis. 2017;8(10):e3130.
- Loewer A, Batchelor E, Gaglia G, et al. Basal dynamics of p53 reveal transcriptionally attenuated pulses in cycling cells. Cell. 2010;142(1):89–100.
- Gajjar M, Candeias MM, Malbert-Colas L, et al. The p53 mRNA-Mdm2 interaction controls Mdm2 nuclear trafficking and is required for p53 activation following DNA damage. Cancer Cell. 2012;21(1):25–35.
- Geva-Zatorsky N, Rosenfeld N, Itzkovitz S, et al. Oscillations and variability in the p53 system. Mol Syst Biol. 2006;2:0033.
- Batchelor E, Loewer A, Mock C, et al. Stimulus-dependent dynamics of p53 in single cells. Mol Syst Biol. 2011;7:488.
- Kiel C, Serrano L. Cell type-specific importance of ras-c-raf complex association rate constants for MAPK signaling. Sci Signal. 2009;2(81):ra38.
- Colman-Lerner A, Gordon A, Serra E, et al. Regulated cell-to-cell variation in a cell-fate decision system. Nature. 2005;437(7059):699–706.
- Zhang XP, Liu F, Wang W. Two-phase dynamics of p53 in the DNA damage response. Proc Natl Acad Sci U S A. 2011;108(22):8990–8995.
- Hafner A, Stewart-Ornstein J, Purvis JE, et al. p53 pulses lead to distinct patterns of gene expression albeit similar DNA-binding dynamics. Nat Struct Mol Biol. 2017;24(10):840–847.
- Robles AI, Bemmels NA, Foraker AB, et al. APAF-1 is a transcriptional target of p53 in DNA damage-induced apoptosis. Cancer Res. 2001;61(18):6660–6664.
- Cao X, Deng X, May WS. Cleavage of Bax to p18 Bax accelerates stress-induced apoptosis, and a cathepsin-like protease may rapidly degrade p18 Bax. Blood. 2003;102(7):2605–2614.
- Veprintsev DB, Fersht AR. Algorithm for prediction of tumour suppressor p53 affinity for binding sites in DNA. Nucleic Acids Res. 2008;36(5):1589–1598.
- Strasen J, Sarma U, Jentsch M, et al. Cell-specific responses to the cytokine TGFbeta are determined by variability in protein levels. Mol Syst Biol. 2018;14(1):e7733.
- Bensimon A, Schmidt A, Ziv Y, et al. ATM-dependent and -independent dynamics of the nuclear phosphoproteome after DNA damage. Sci Signal. 2010;3(151):rs3.
- Sionov RV, Coen S, Goldberg Z, et al. c-Abl regulates p53 levels under normal and stress conditions by preventing its nuclear export and ubiquitination. Mol Cell Biol. 2001;21(17):5869–5878.
- Wade M, Wang YV, Wahl GM. The p53 orchestra: mdm2 and Mdmx set the tone. Trends Cell Biol. 2010;20(5):299–309.
- Theon AP, Pusterla N, Magdesian KG, et al. A pilot phase II study of the efficacy and biosafety of doxorubicin chemotherapy in tumor-bearing equidae. J Vet Intern Med. 2013;27(6):1581–1588.
- Tanaka T, Halicka HD, Traganos F, et al. Induction of ATM activation, histone H2AX phosphorylation and apoptosis by etoposide: relation to cell cycle phase. Cell Cycle. 2007;6(3):371–376.
- Hirai Y, Hayashi T, Kubo Y, et al. X-irradiation induces up-regulation of ATM gene expression in wild-type lymphoblastoid cell lines, but not in their heterozygous or homozygous ataxia-telangiectasia counterparts. Jpn J Cancer Res. 2001;92(6):710–717.
- Meek DW, Knippschild U. Posttransiational modification of MDM2. Mol Cancer Res. 2003;1(14):1017–1026.
- Gu B, Zhu WG. Surf the post-translational modification network of p53 regulation. Int J Biol Sci. 2012;8(5):672–684.
- Lahav G. Oscillations by the p53-Mdm2 feedback loop. Adv Exp Med Biol. 2008;641:28–38.
- Batchelor E, Mock CS, Bhan I, et al. Recurrent initiation: a mechanism for triggering p53 pulses in response to DNA damage. Mol Cell. 2008;30(3):277–289.
- Sun T, Cui J. A plausible model for bimodal p53 switch in DNA damage response. FEBS Lett. 2014;588(5):815–821.
- Cai X, Yuan ZM. Stochastic modeling and simulation of the p53-MDM2/MDMX loop. J Comput Biol. 2009;16(7):917–933.
- Hsing A, Faller DV, Vaziri C. DNA-damaging aryl hydrocarbons induce Mdm2 expression via p53-independent post-transcriptional mechanisms. J Biol Chem. 2000;275(34):26024–26031.
- Mendrysa SM, McElwee MK, Perry ME. Characterization of the 5ʹ and 3ʹ untranslated regions in murine mdm2 mRNAs. Gene. 2001;264(1):139–146.
- Ma L, Wagner J, Rice JJ, et al. A plausible model for the digital response of p53 to DNA damage. Proc Natl Acad Sci U S A. 2005;102(40):14266–14271.
- Stommel JM, Wahl GM. Accelerated MDM2 auto-degradation induced by DNA-damage kinases is required for p53 activation. Embo J. 2004;23(7):1547–1556.
- Chong KH, Samarasinghe S, Kulasiri D. Mathematical modelling of p53 basal dynamics and DNA damage response. Math Biosci. 2015;259:27–42.
- Sun T, Li X, Shen P. Modeling amplified p53 responses under DNA-PK inhibition in DNA damage response. Oncotarget. 2017;8(10):17105–17114.
- Ludtke N, Panzeri S, Brown M, et al. Information-theoretic sensitivity analysis: a general method for credit assignment in complex networks. J R Soc Interface. 2008;5(19):223–235.
- Chatterjee A, Vlachos DG, Katsoulakis MA. Binomial distribution based tau-leap accelerated stochastic simulation. J Chem Phys. 2005;122(2):403.
- Leier A, Marquez-Lago TT, Burrage K. Generalized binomial tau-leap method for biochemical kinetics incorporating both delay and intrinsic noise. J Chem Phys. 2008;128(20):05B623–E.
- Raj A, Peskin CS, Tranchina D, et al. Stochastic mRNA synthesis in mammalian cells. Plos Biol. 2006;4(10):1707–1719.
- Sun T, Lin X, Wei Y, et al. Evaluating bistability of bax activation switch. FEBS Lett. 2010;584(5):954–960.