
ABSTRACT
Multi-fluorescent imaging of cell cycle progression is essential for the study of cell proliferation in vitro and in vivo. However, there remain challenges, particularly to image cell cycle progression in living cell with available imaging techniques due to lacking the suitable probe. Here, we design a triple fluorescent sensors system making the cell cycle progression visible. Multi-fluorescent sensor shows the proliferating or proliferated cells with different colors. We thus generate the construct and adenovirus to probe cell cycle progression in living cell lines and primary cardiomyocytes. Furthermore, we create the knock-in transgenic mouse to monitor cell cycle progression in vivo. Together, the system can be applied to investigate cell proliferation or cell cycle progression in living cells and animals.
Introduction
In eukaryotes, cell division is essential for tissue growth and maintenance. It is a series of events that take place in a cell and lead to its duplication and division into two daughter cells. Cell cycle consists of two discrete periods: interphase and mitotic phase. The interphase can be divided into G1, S, and G2 phases, which are making cells ready for mitosis by accumulating nutrients and duplicating DNA. Whereas mitosis can be divided into prophase, prometaphase, metaphase, anaphase, telophase, and cytokinesis, the chromosomes are separated into two identical sets to two daughter nuclei during the mitotic phase[Citation1]. To understand the complexity of cell cycle, the intensive study throughout past several decades have been made [Citation2], and the knowledge of cell cycle have advanced to a stage that can figure out a regulatory mechanism map [Citation3,Citation4]. However, the available imaging cell cycle progression techniques in living cell are limited. A few new developed methods are suitable in specific model or the specific cell cycle phase transition [Citation5–Citation7]. A fluorescence ubiquitination cell cycle indicator (FUCCI) system developed by Miyawaki and colleagues. The (FUCCI) system enables fluorescence imaging of the various populations of cell cycle phases. The green fluorescent protein (mAG) was fused to hGem(1/110) and the orange fluorescent protein (mKO2) was fused to hCdt1(30/120). The green fluorescent protein was expressed in S, G2, or M phase and degraded in the G0 or G1 phase, while the orange fluorescent protein is expressed in the G0 or G1 phase and degraded in the S, G2, or M phase [Citation4,Citation8]. It is required to establish a new system that could probe the cell cycle progression and the population of proliferating and proliferated cells in living cells and animals.
The regulation of cell cycle is crucial to the survival of a cell, including detecting and repairing DNA damage as well as preventing the uncontrolled cell division [Citation9,Citation10]. Cell cycle events are controlled by the activation of cyclin-dependent kinases (CDKs), which are regulated by CDK inhibitors and CDK-associated cyclins. The protein levels of CDK inhibitors and CDK-associated cyclins are regulated via transcription, ubiquitination, and degradation [Citation11]. Cyclins as the regulatory subunits and CDKs as the catalytic subunits readily form activated heterodimers. CDKs are constitutively expressed in various phases of cell cycle whereas cyclins are synthesized at specific stages of the cell cycle in response to various molecular signals [Citation9]. In general, under the pro-mitotic stimuli, G1 phase cyclin-CDK complexes formed and activated to prepare the cell for S phase, by promoting the expression of S phase cyclins and the enzymes for DNA synthesis [Citation12]. As the cyclin-CDK complexes of G1, S, G2, and M phase have been activated in order, the every step of cell cycle is strictly regulated by several checkpoints [Citation13]. Cell cycle progress is controlled by several checkpoints, depending on internal and external conditions. The restriction checkpoint ensures that a cell cannot advance from G1 into S phase if the genomic DNA is damaged [Citation14]. The G2/M checkpoint approves that a cell has a chance to repair damaged DNA during replication before initiating mitosis [Citation15]. The spindle checkpoint is responsible for ensuring the each chromosome is attached to the spindle apparatus before separating to the daughter cells [Citation16]. The function of cell cycle checkpoints was achieved by the precise regulation of cyclin-CDK and CDKI.
While entry and exit of mitosis have been regulated by some protein complexes, cyclin B1 is a key regulatory protein involved in these processes [Citation17]. Entry of mitosis is initiated from the activation of a protein kinase known as maturation-promoting factor (MPF) or M-phase kinase, which is formed by cyclin B1 and p34 cdc2. Cyclin B1 associates with inactivated p34 cdc2 and facilitates its phosphorylation at amino acids Thr14 and Tyr15 thus to maintains the inactive state of p34 cdc2 until the end of G2 phase. Cdc25 could dephosphorylate p34 cdc2 at amino acids Thr14 and Tyr15 and activate this mitotic kinase complex. Cyclin B1 can be phosphorylated by Polo-like kinase (PLK1) preferentially at Ser133 and possibly at Ser 147, and by MPF itself at Ser126 and Ser128. After the phosphorylation of cyclin B1, the cell enters the mitotic phase [Citation18]. It remains active until the metaphase/anaphase transition when cyclin B1 is degraded [Citation19]. Cyclin B1 is degraded at the end of mitosis and accumulates again during the next cell cycle. The degradation of cyclin B1 is ubiquitin-dependent proteolysis and is necessary for mitosis exit [Citation20].
Under normal physiological condition, many types of differentiated somatic cells are no longer capable of proliferation such as cardiomyocytes and neural cells in mammal species. However, the differentiated somatic cells might restart DNA synthesis or cell dividing under specific conditions [Citation21]. Moreover, the cells remain proliferating state during carcinogenesis. Therefore, a multi-fluorescent sensoring system is very useful for imaging of cell cycle progression in a variety of research fields. In this study, we established an inter/intra cellular Cre-loxp/Flp-frt regulating triple fluorescent sensors system. The system can be applied to monitoring the cell cycle progression in vitro by triple fluorescence. Furthermore, a cell cycle G2/M phases EGFP sensor driven by human cyclin B1 promoter was generated to investigate the detailed events of mitosis in vitro and in vivo. EGFP sensor was transfected into HEK, C2C12 and HeLa cells to illuminate the cell cycle progression. In addition, EGFP sensor was packaged into adenovirus and infected the primary neonatal rat cardiomyocytes to illustrate the cell division. Furthermore, EGFP sensor was constructed into transgenic mice to illustrate the cell cycle in a variety of tissues in vivo. We thus provide a powerful tool to monitor specific cell cycle progression under physiological or pathological conditions such as cancer development and cardiac repair.
Results
Human cyclin B1 promoter drives cyclin B1 fused EGFP as cell cycle sensor of G2/M phases in vitro
Cyclin B1 accumulates throughout the interphase until mitosis and would be activated by phosphorylation. There are four phosphorylation sites (Ser126, 128, 133, and 147) located in the cytoplasmic retention signal (CRS) domain of cyclin B1. The phosphorylation modification is responsible for regulating the translocation of cyclin B1 to the nucleus at the G2/M checkpoint. The expression level of cyclin B1 is diverse in the different cell cycle phases. Cyclin B1 is difficult to be detected in G1 phase and starts to increase in S phase (). Cyclin B1 is highly expressed and localized in the cytoplasm in this period and reaches the peak of its expression in the mitosis phases while translocating into nucleus (). Cyclin B1 protein will be degraded abruptly accompanying with the ending of mitosis and reenter G1 or G0 phase.
Figure 1. Characteristics and generation of cell cycle G2/M phase fluorescent sensor. (a), The expression pattern and localization of cyclin B1 were showed by graph in the different phases of cell cycle. (b), Schematic of the cyclin B1 fused EGFP as a fluorescent probe illuminated various phases of cell cycle. (c), The structure of human cyclin B1 promoter drove cyclin B1 fused EGFP construct, destruction and subcellular localization of sensor are controlled by destruction box (D-box), cytoplasmic retention sequences (CRS) localized in the N-terminal portion of cyclin B1. (d), HEK293, c2c12 and HeLa cells were transfected with plasmid, the different localizations and intensity of EGFP signal showing the cells in different phases of cell cycle. G1/S phases EGFP signal is very low and localized in cytoplasm. The EGFP signal is increased and localized in cytoplasm in G2 phase. The EGFP signal is high and localized from cytoplasm to nucleus in prophase phase. Nuclear envelope is broken down in metaphase and the EGFP signal is very high and full of whole cell. (e), The quantification of EGFP density of HEK293, c2c12 and HeLa cells in the various cell cycle phases has been performed, the EGFP is significantly increased in the G2, prophase and metaphase compare to the G1 and S phases. (f), The expression levels of cyclin B1 and EGFP in transfected HEK293, c2c12 and HeLa cells and control non-transfected cells were detected by western-blot.
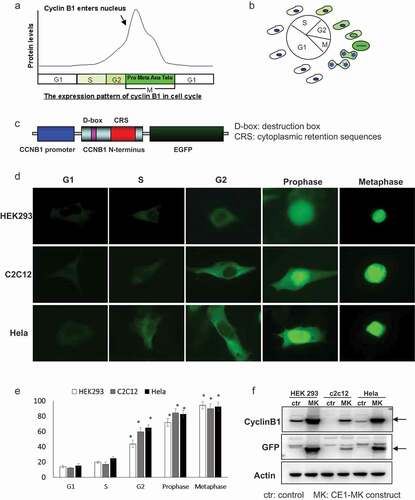
To illustrate the detailed process of mitosis, we shuttled the human cyclin B1 promoter with cyclin B1 fusing EGFP fragment from pCORON4004-CCEGFP. The fusion sequence has been shuttled into a modified mammalian cell expression plasmid MK. The construct was named as CE1-MK. The expression fragment of construct CE1-MK is composed of human cyclin B1 promoter, the N-terminal portion of cyclin B1 coding sequence fused EGFP. The N-terminal portion of cyclin B1 coding sequence contains the D-box (destruction box) sequence and CRS (cytoplasmic retention sequence) domain (). The D-box sequence is a common domain of cyclin molecules, which is response to the degradation signal. The CRS domain controls the subcellular localization of cyclin B1 fused protein. The diverse cell lines have been applied for CE1-MK transfection that includes HEK293, C2C12 and HeLa (). The green fluorescence signal shows the cell in various phases of cell cycle by the different localization and intensity. At G1/S phase, the signal of EGFP is very low, but detectable when the exposure time is prolonged. The fluorescence signal is increased and localized in cytoplasm at G2 phase. The protein level of cyclin B1 fused EGFP is rising and translocated from cytoplasm to nucleus at prophase. At metaphase, the expression of cyclin B1 fused EGFP reaches peak and the nuclear envelope breaks down ().
By the way, the expression levels of cyclin B1 in various phases have been measured by quantification of the ten individual cells (). The expression of endogenous cyclin B1 and cyclin B1 fused EGFP has been detected by western-blot using cyclin B1 and EGFP antibodies. In the tested cell lines, the expression of cyclin B1 fused EGFP in CE1-MK plasmid transfected group was higher than that endogenous cyclin B1 in control group transfected with empty vector (). The expression of actin has been detected in the samples as the internal control.
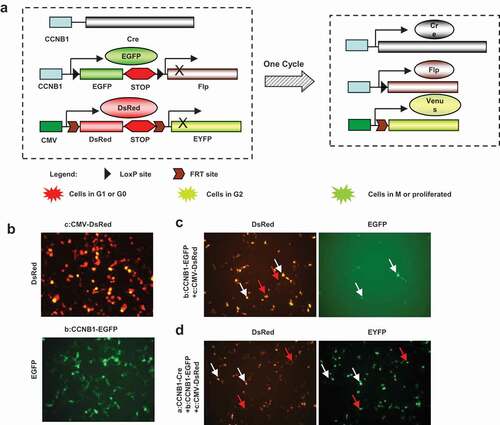
Figure 2. Construct strategy of multi-fluorescent sensors and expression in vitro. Construct strategy of the three fluorescent sensors of cell cycle progress was designed as diagram. The constructs were transfected into HEK293 cells to confirm the function of expression. (a), Cyclin B1 promoter drove cre recombinase initiates the cascade reaction of the fluorescent sensors. Cyclin B1 promoter drove cyclin B1 fused EGFP with double loxP sites and Flp is a key plasmid to show proliferating cells. CMV promoter drove DsRed and EYFP fragment with double Frt sites is indicating the proliferated cell transition from red to yellow fluorescence. Cotransfected of triple plasmids would be possible to recognize the cell population with variety fluorescence. (b), CMV-DsRed–EYFP and Cyclin B1-EGFP-Flp plasmids were transfected into HEK293 cells respectively. (c), CMV-DsRed-EYFP and Cyclin B1-EGFP-Flp plasmids were cotransfected into HEK293 cells together showing G1 phase cells (red arrows) and G2 phase cells (white arrows). (d), Cyclin B1-cre, CMV-DsRed-EYFP and Cyclin B1-EGFP-Flp plasmids were cotransfected into HEK293 cells together showing the cells passed one cell cycle (red arrows) and the cells in the first cell cycle (white arrows).
We also performed a time lapse to address the detailed process of mitosis. C2C12 cells were transfected with CE1-MK plasmid and transported to the time-lapse microscopy after 48 h. The time-lapse images demonstrated the detailed process of mitosis from prophase to cytokinesis (Fig.S1).
Monitoring cell cycle progression in vitro by three fluorescent sensors
The Cre-Lox and Flp-Frt systems are site-specific recombination technologies that have been widely used to manipulate gene expression under controlled conditions in vivo [Citation22]. Here, we built a construct with fluorescent sensor DsRed and EYFP fragments driven by CMV promoter, followed by the DsRed coding cassette inserted a stop sequence. In addition, Frt sites were inserted into up or down stream of the DsRed-stop cassette followed by the EYFP coding sequence (). Cells transfected with this construct are labeled with red fluorescence (). Another construct with fluorescent sensor EGFP fragment is driven by cyclin B1 promoter, and a stop sequence following the EGFP coding cassette. The up/down stream of the EGFP-stop cassette is inserted with two LoxP sites and following the Flp recombinase coding sequence (). Cells transfected with this construct are labeled with green fluorescence. Moreover, the densities and localizations are diverse in the various cell cycle phases (). An additional construct with the Cre recombinase coding sequence is driven by cyclin B1 promoter (). Transfected with the construct, the proliferating cells will produce Cre recombinase to delete the targeting sequence. The triple constructs transfected cell will express the Cre recombinase when the cell cycle is in transition through the G2/M phases. The Cre recombinase will delete the EGFP-stop cassette and the Flp recombinase coding sequence will be driven by cyclin B1 promoter. The proliferated cell will express the Flp recombinase that will delete the DsRed-stop cassette and thereby the EYFP coding sequence will be driven by CMV promoter (). The triple construct design is possible to provide a tool of the temporal progression of cell cycle monitoring. G1 or G0 phase cells will be the red fluorescence because of expressing only the DsRed cassette under CMV promoter ( red arrows). G2 phase cells indicate green and red double fluorescence due to expressing the DsRed cassette under CMV promoter and the EGFP cassette by cyclin B1 promoter ( white arrows). The populations of cells passed the first cell cycle or the cells in the first cell cycle can be distinguished by the EYFP or the double EYFP and DsRed ( the cells passed one cell cycle red arrows and the cells in the first cell cycle white arrows).
The event details of mitosis displaying by EGFP sensor in primary cell and cell lines
To investigate the expression of cyclin B1 fused EGFP sensor impact on cell cycle, we synchronized the transfected cells in various cell cycle phases (). HEK293 cells were transfected with CE1-MK plasmid and synchronized by serum-free culture for 24 h for G1 phase, Aphidicolin treatment for 24 h for G1/S phase, and Nocodzzole treatment for 16 h for G2 phase. Furthermore, the expression of cell cycle markers was detected by Western-blot (). The results demonstrated that the expression of cyclin B1 fused EGFP sensor do not impaired cell cycle progression. On the other hand, to detect the expression of Cre and Flp recombinase drove by cyclin B1 promoter, HEK293 cells were transfected with the construct of cyclin B1 promoter drive Cre, or were co-transfected with cyclin B1 promoter drive Flp together. The cells synchronized by serum-free culture for 24 h for G1 phase, Aphidicolin treatment for 24 h for G1/S phase, and Nocodazole treatment for 16 h for G2 phase (). The expression of Cre and Flp recombinase in various cell cycle phases were detected by Western-blot (). The results demonstrated that the expression of Cre and Flp recombinase was controlled under cyclin B1 promoter.
Figure 3. The expression pattern of G2/M phase fluorescent probe in primary and cell lines. (a), HEK293 cells were transfected with the plasmid of G2/M phase fluorescent probe and synchronized in various cell cycle phases. The population of cells in different phases were monitored by FACS. (b), Transfected HEK293 cells were synchronized and detected the expression of cell cycle markers: cyclin D1, cyclin E1, cyclin B1, and p-Histon H3, CDC2, p-CDC2, PCNA; the expression of recombinase: Cre, Flp, the internal control: Actin by Western-blot. (c), Neonatal rat cardiomyocytes were infected with EGFP sensor adenovirus. C2c12 and HeLa cells were transfected with G2/M phase fluorescent sensor construct. Cells were performed immunofluorescence with anti-cyclin B1 antibody (red) and DAPI (blue). The localization of cyclin B1 is similar with cyclin B1-EGFP fusion protein. (d), Neonatal rat cardiomyocytes were infected with EGFP sensor adenovirus. Cells were performed for immunofluorescence with anti-P-Histone H3 (Ser10) antibody (red) and DAPI (blue). The detail events of mitosis were displayed by EGFP sensor.
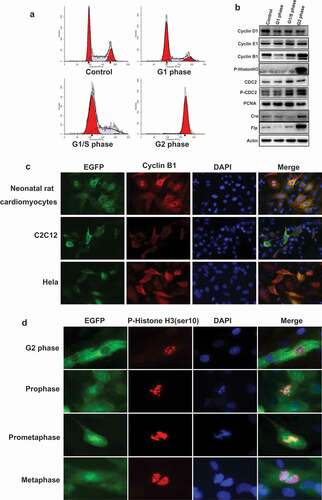
To address the expression pattern of cyclin B1 fused EGFP sensor in primary cell and immortalized/cultured cell lines, we generated cyclin B1 fused EGFP expression adenovirus. The adenovirus infected primary rat neonatal cardiomyocytes demonstrated that the expression pattern of cyclin B1 fused EGFP is same as the endogenous cyclin B1 (). The expression of endogenous cyclin B1 has been detected by anti-cyclin B1 antibody that target the C-terminal peptide of cyclin B1 protein. The localization and intensity are same with the green fluorescence sensor. Furthermore, we also transfected C2C12 and HeLa cells with CE1-MK plasmid. Endogenous expression of cyclin B1 was detected with antibody in transfected cells. The localization and intensity of endogenous cyclin B1 are similar with cyclin B1 fused EGFP sensor ().
A precise analysis of mitotic phases has been performed with cyclin B1 fused EGFP sensor and immunofluorescence staining. Neonatal rat cardiomyocytes were infected with cyclin B1 fused EGFP sensor adenovirus and stained with phosphorylated Histone H3 antibody. Phosphorylation of Histone H3 is tightly correlated with chromosome condensation during mitosis, the state of nucleus and chromosome could be monitored by the phosphorylation of Histone H3 in diverse phases of mitosis [Citation23]. The anti-phospho-Histone H3 (Ser10) antibody was recognized by Alexa Fluor 594 secondary antibody (red). The nuclei were stained with DAPI (blue). In G2 phase, green signal (cyclin B1 fused EGFP sensor) is localized in the cytoplasm with increasing intensity. The genomic DNA started to condense with the phosphorylation at ser10 of Histone H3 while the levels of phosphorylated Histone H3 are increasing and enriched in nuclei (). Cyclin B1 fused EGFP sensor is translocated from cytoplasm to nuclei and enriched in nuclei after cell entry mitosis. The localization of phosphorylated Histone H3 indicated that the chromosomes are formed in the prophase. The intensity of green signal reached the peak and localized in the full cell without nuclear membrane in the prometaphase and metaphase. The phosphorylated Histone H3 signal demonstrated that chromosomes are paired and started to divide into two sets toward opposite direction of the cell.
The similar detailed analysis of cell cycle phases has also been performed by transfected cell lines. C2C12 cells were transfected with construct CE1-MK and processed for immunofluorescence with anti-phospho-Histone H3 (Ser10) antibody (red) and DAPI (blue). In G2 phase, cyclin B1 fused EGFP sensor is expressed and localized in cytoplasm while phosphorylated Histone H3 could also be detected in nuclei. In prophase, cyclin B1 fused EGFP sensor is enriched and localized in both cytoplasm and nucleus while the signal of phosphorylated Histone H3 is increasing in nuclei (Fig. S2). In metaphase, cyclin B1 fused EGFP sensor reached the peak and full of the cells accompanied by the rupture of the nuclear membrane. When detected by red signal, the chromosomes are paired and divided. In anaphase, cyclin B1 fused EGFP sensor is starting to reduce and divide, and the phosphorylated Histone H3 started to move toward the opposite direction. In telophase, cyclin B1-fused EGFP signal is decreased and divided, and the replicated chromosomes split into two identical daughter cells (Fig. S2).
Generation of cell cycle EGFP sensor transgenic mice
Transgenic mouse with cyclin B1 fused EGFP sensor would be a useful cell cycle monitor model for in vivo tissue. Klochendler and colleagues generated a transgenic mouse with cyclin B1 fused EGFP that was drove by PGK promoter[Citation24]. To test this cell cycle EGFP sensor in vivo, we generated CE1-MK knock-in ES cells, and made a random integration transgenic mouse strain CE1-MK. The transfected ES cells have been cultured and selected with the EGFP sensor. The proliferating ES cells could be illuminated by the EGFP sensor. The selected EGFP positive cells were cultured into the ES clone, which were injected into mouse embryo and generated transgenic mice (). A PCR primer pair was designed to amplify the expression fragment of EGFP (). The production of PCR is a 300bp fragment. The primer pair was used to identify the positive ES clones and genotyping. The plasmid vector was used as the positive control and the transgenic mice were identified as the positive (P) and negative (N) by PCR ().
Figure 4. G2/M phase fluorescent sensor knock-in transgenic mouse generation and probe in embryo. (a), Mouse ES cells were electroporated with EGFP sensor construct fragments. The EGFP signal showing the positive ES colonies indicated the genomic integration. (b), The PCR primers for transgenic mice genotyping was designed in the GFP fragment. (c), The positive and negative transgenic mice were recognized by the production of PCR. (d), The GFP signal of the cryosections of transgenic mouse CCB1E-MK embryo (E14.5) were detected. The dorsal (posterior) root ganglion area was shown in the low magnification (100x) and high magnification (400x). The G2 phase cells were shown in the high magnification (1000x), with GFP signal in the cytoplasm. (e), Cryosections of transgenic mouse CCB1E-MK embryo (E10.5) were stained with antibody against EGFP, and detected with ABC-DAB system in low magnification (50x), the EGFP signal showing dorsal (posterior) root ganglion (arrows). Cryosections from wild type mice embryo (E10.5) were performed same experiment without any positive signal as the control.
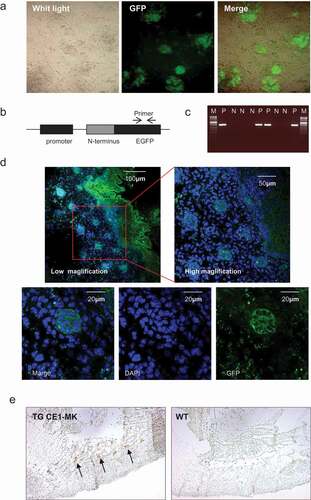
The positive mouse was breeding and prepared for the embryo isolation. CE1-MK positive transgenic embryo has been performed cryosectioning and stained with DAPI. Most of the cells in the dorsal (posterior) region were EGFP positive (). In the most cells, strong EGFP signal localized in the cytoplasm, which indicated the cells are in the G2 phase (). The various magnification of confocal photography demonstrated that cyclin B1 fused EGFP sensor may a suitable probe for in vivo cell cycle progression monitor. CE1-MK positive transgenic and wild type mice embryo have been immunostained with antibody against EGFP and detected by ABC-DAB system. The result indicated that CE1-MK positive embryo showed stronger EGFP signal in the dorsal region, while wild type embryo tissue cannot be detected any signal ().
Furthermore, CE1-MK positive transgenic mice embryos have been performed by immunostaining with antibodies against EGFP and DAPI. Most of the cells in the dorsal region were EGFP positive (Fig. S3). In most of the cells, EGFP signal localized in the cytoplasm, which indicated the cells are in the G2 phase. Cells indicated by strong EGFP signal throughout the cell, are in the mitosis (Fig. S3).
Cell cycle G2/M phases EGFP sensor was applied in adult mouse
Cell cycle EGFP sensor has been tested in a variety of cells in vitro and the transgenic mouse embryo in vivo. It is known that the cells are proliferating in the tissue of thymus and spleen in the adult stages. We thereby isolated the tissues of thymus and spleen from wild type and CE1-MK mice and performed cryosectioning. The slides were stained with DAPI and detected by fluorescence microscopy. The results indicated that CE1-MK transgenic mice showed strong EGFP signal in some proliferating cells whereas the wild type control mice did not show any specific EGFP signal (). The EGFP positive cells can be ascertained in G2 phase or mitosis of cell cycle depending on the localization of the fluorescent signal. Furthermore, the sections of thymus and spleen tissue were immunostained with antibody against phosphorylated Histone H3 and DAPI followed by fluorescence microscopy detection. The results showed that some of the cells from wild type and CE1-MK transgenic mice were fluorescence signal positive (). These data demonstrated that the cell cycle EGFP sensor can be applied in the tissues from adult transgenic mice to identify the various phases of proliferating cells.
Figure 5. G2/M phase fluorescent sensor expression in adult tissues of knock-in transgenic mouse. (a), Cryosections of thymus and spleen from adult transgenic mouse CE1-MK and wild type mouse were stained with DAPI. Some cells in CE1-MK mouse section are EGFP positive showing the cells in mitosis, while wild type mouse sections as the control have not any EGFP positive signal. (b), Cryosections of thymus and spleen from adult transgenic mouse CE1-MK and wild-type mouse were stained with antibody against P-Histone H3 (Ser10). Some cells in CE1-MK mouse and control wild-type mouse sections are P-Histone H3 positive showing the cells in mitosis. C, Western-blot result showed that P-Histone H3 expressed in adult mouse thymus, spleen and colon tissue. The protein levels of cyclin B1 and EGFP were detected in CE1-MK transgenic and wild type control mice. The expression of cyclin B1 is increased in CE1-MK mice and the EGFP is only expressed in transgenic mice. Actin was detected as the loading control of western-blot.
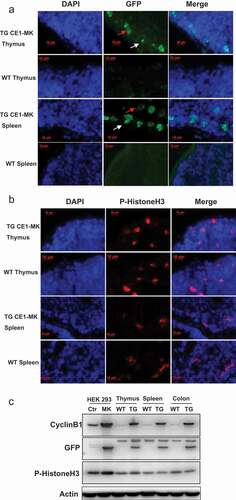
The tissue samples from wild type and CE1-MK mice were tested by Western-blot. The results showed that the protein levels of phosphorylated Histone H3 were similar in the tissues of thymus, spleen and colon from wild type and CE1-MK transgenic mice. The protein levels of phosphorylated Histone H3 in HEK293 CE1-MK transfected cells are stronger than that in control cells. The expression of cyclin B1 was detected by antibody anti-cyclin B1. The expression of cyclin B1 in the CE1-MK transfected cells and tissue samples of transgenic mouse is increased compared to control HEK293 cells and WT mice. The expression of EGFP was detected by antibody anti-EGFP and detected strong signal in CE1-MK transfected cells and tissue samples of transgenic mice. In contrast, we detected no GFP signal in control HEK293 cells and the tissue samples from WT mice ().
In addition, the colonic epithelial cells keep on proliferating and growth through the young, adult and old stages. The colon tissue was isolated from wild type and CE1-MK mouse and cryosections were prepared. The slides were immunostained with antibody against GFP and detected by ABC-DAB system. The result indicated that samples from CE1-MK mouse showed stronger GFP signal in the colonic epithelial cells. However, no signals were detected in wild type colonic epithelial cells (Fig. S4).
Discussion
The cell division cycle that describes the fundamental process of the cells reproduction, directly impacts the growth and development of all living organisms. The timely execution of each stage of the cell cycle is ultimately linked to the process of differentiation and organogenesis, while the failure to precisely regulate cell cycle progression could lead to various diseases, such as cancer. Understanding of the dynamic nature of cell cycle is challenging due to lacking of appropriate real-time monitoring systems. It is difficult to precisely track cell cycle progression in a living, multicellular context. Most of the techniques currently used to monitor the cell cycle, such as BrdU incorporation or immunostaining of cell-cycle marker, need to fix the cell prior to analysis. These methods do not allow the dynamic morphology of cycling cells to be visualized in real-time, particularly in living tissue in vivo. In the past years, several techniques have been developed to track cell cycle progress in living cells and in vivo tissues [Citation4,Citation25–Citation28]. The FUCCI system is genetically encoded two-color indicator that could be followed the cell division within a cell population. However, it is limited to visualize the mitosis phases. The methods are focused on marking the G1/S transition in living cells, rather targeting on the G2/M transition and mitosis. In current study, we developed a method to visualize the detailed events of mitosis in living culture cell and even in various organs and tissues from living mice. The localization and intensity of cyclin B1 fused EGFP sensor allow to track cell cycle progression in a highly spatiotemporal way. Cyclin B1 fused EGFP is a powerful tool to visualize the detailed events of mitosis progress in living cells. Importantly, CE1-MK transgenic mice provide a platform for studying molecular machine of cell cycle or proliferation in a variety of multicellular context tissues under different conditions.
Multi-fluorescent imaging of cell cycle progression is necessary to research the proliferation of distinct cell in vitro as well as in vivo. Some differentiated somatic cells will reentry cell cycle under specific stimuli [Citation29,Citation30]. We designed a triple fluorescent sensors system making the cell cycle progression visible. Furthermore, we have designed a triple fluorescent transgenic mouse strains for cell cycle report system in vivo. The designed constructs were similar with our multi-fluorescent sensor system in vitro. The first construct is an EGFP fragment driven by cyclin B1 promoter following a stop sequence, which is covered by two loxP sites. An Flp recombinase coding sequence is followed by the cassettes. The second construct is a MerCreMer coding sequence driven by tissue specific promoter or a CreERT2 coding sequence driven by Rosa26 promoter. The third construct is a DsRed fragment driven by CMV promoter following a stop sequence, which is flanked by two Frt sites, followed by an EYFP fragment (Fig. S5). The constructs will be generated into transgenic mouse strains and integration by crossbreeding. The final mouse strain with three varieties of fluorescent reporters would be used for exploring specific tissue cell cycle progress or proliferation states (Fig. S5).
Cyclin B1 fused EGFP protein accumulates in the whole cell cycle, and translocates into nucleus at the G2/M checkpoint. It is degraded at anaphase and telophase and accumulates again during the next cell cycle. The most important events of cell cycle are the replication of chromosomal DNA during S phase and the segregation of the replicated chromosomes during mitosis. In cardiomyocytes and vascular smooth muscle cells that frequently exit mitosis may proceed in the absence of chromosome segregation and karyokinesis, leading to cell cycle re-entry and polyploidization [Citation31]. So far, it has been constantly observed that sister chromosome mis-segregation in some cancer cells. The activated complex of cyclin B1-cdc2 is responsible for the entry and exit of mitosis and essential for chromosome segregation. Cyclin B1 fused EGFP construct, adenovirus, and CE1-MK transgenic mice would be useful tools for investigating the molecular mechanism of polyploidy and multi-nucleation in hepatocytes, cardiomyocytes and so on, and offer an insight into the oncogenesis in vitro and in vivo.
Cyclin B1 fused EGFP construct and CE1-MK transgenic mice might be applied for relevant cell therapy product. Recently, human cell atlas project has been built in London that will describe and define the cellular basis of health and disease. Bone marrow transplantation and the immune cells transplantation have been applied in the cancer therapy or the relevant combination of anticancer chemotherapy. Cyclin B1 fused EGFP sensor may be a useful monitor for cell cycle progression in vitro and in vivo. Our system also might contribute the useful for the proliferation of certain cell linage. Regeneration is a regulative developmental process ubiquitous across all species. Its function throughout the life cycle to maintain or restore the normal form and function of cells, tissues and, in some cases organs, appendages and whole organisms. However, the regenerative capability of most vertebrate animals is restricted to certain tissues [Citation32]. The adult stem cell has real potential to regenerate, at least in the muscle and bone damaged by injury or genetic disease [Citation32]. Under certain conditions, adult stem cell is activated and differentiated to the tissue progenitor cell even to the tissue-specific functional cell. Cyclin B1-fused EGFP construct and CE1-MK transgenic mice provide a cure to monitor the adult stem cell proliferation and differentiation and the tissue reproduction. Cell escaping the cell cycle checkpoint regulation, due to DNA damage and replication imbalance, is a main path of carcinogenesis [Citation33]. G2/M checkpoint is a key point for regulating the cell to apoptosis or karyokinesis. Cyclin B1 fused EGFP construct and CE1-MK transgenic mice would be useful for tumor and carcinogenesis research.
Taken together, here we show that cyclin B1 fused EGFP construct and transgenic mice CE1-MK can be very useful for the study of the detailed events of mitotic phase and cell cycle progression in vitro and in vivo, not only in cultured mammalian cells and human-derived primary cells, but also in the multicellular context tissues. The localization and the intensity of fluorescence are definitely varieties in the different mitotic phases. It is also possibility to monitor the population of proliferating cells and the proliferated cells in vitro and in vivo. The system can be used widely in the fields of cell therapy, tissue regeneration, cancer development, and so on.
Materials and methods
Plasmids
Human cyclin B1 promoter and Cre coding sequence were cloned into pcDNA3 plasmid. The Fragments of cyclin B1 promoter, EGFP, STOP, Loxp, and FLP were cloned and assembled into pcDNA3 plasmid. The similar strategy was used to assembly the fragments of CMV promoter, DsRed, STOP, Frt, amd EYFP into pcDNA3 plasmid. The knock-in transgenic mouse plasmids have similar fragments and selection marker neomycin. The recombinase transgenic mouse plasmids were the MerCreMer and CreERT2 inducible Cre drove by tissue-specific promoter or ROSA26 promoter. Human cyclin B1 promoter drove cyclin B1 fused EGFP construct was modified from pCORON4004-CCEGFP, which was ordered from Amersham Biosciences [Citation34]. The mammal cell expression plasmid was termed as CE1-MK vector.
EGFP sensor knock-in mouse
Transgenic mouse was generated by random integrated human cyclin B1 promoter drove cyclin B1 fused EGFP expression fragments into genome, achieved from ES cells, named as CE1-MK TG mouse. Positive ES clones could be checked by the fluorescence directly. Genotyping of the transgenic mice was performed by PCR using the following primers: 5ʹATCGAGCTGAAGGGCATCGACTTCAAGGAG3ʹ; 5ʹCTCCAGCAGGACCATGTGATCGCGCTTCTC3ʹ. Wild-type C57BL6 mice were used as control.
Generation of adenoviruses
The human cyclin B1 promoter drove EGFP sensor was cloned into adenovirus shuttle vector pShuttle. The construct was linearized with Pme I and cotransformed into bacterial with pAdEasy-1 together. Identified recombinant adenovial plasmids were digested with Pac I and were used to transfect HEK293 cells to produce virus. The transfected HEK293 cells were maintained in DMEM with 2.5% FCS. Virus were harvested and prepared when the complete cytopathic effect was observed. The virus titers were performed as described in the instructions of the manufacturer (Stratagene).
Cell lines and primary cell culture
HEK cells and c2c12 cells were maintained in DMEM/10%FCS, and HeLa cells were cultured in RPMI1640/10%FCS supplemented with 2 mM L-glutamine adjusted to contain 1.5 g/L sodium bicarbonate, 4.5 g/L glucose following the standard culture method of ATCC. The transfection of EGFP sensor was performed by FuGENE 6 following instructions of the manufacturer (Roche).
Neonatal rat cardiomyocytes were prepared using standard procedures. Pups were pre-refrigerated at 4°C for about 20 min. The hearts were taken out, placed into ice-cold dissection buffer. The great vessels and the atria were removed. The trimmed hearts were minced in ice-cold enzyme solution and digested at 37°C with shaking. After 5 min the suspension mainly containing erythrocytes was replaced. The subsequent digesting times were 1 × 20, 2 × 25, 1 × 15, and 1 × 10 min. Each time the suspension was replaced. Digestion in the removed suspension was stopped with fetal calf serum and the mix centrifuged at 100g for 5 min. The pellet was resuspended in medium, passed through a 70 μm nylon filter and pre plated onto a cell culture dish. After 75 min the cardiomyocytes enriched suspension was removed and plated onto gelatin-coated cell culture dishes at a density of 400 000–800 000 cells per cm2. Cardiomyocytes were maintained in serum-free DMEM containing 25 mg/L BSA, 2.5 mg/L transferring, and 25 μg/L insulin 24 h before virus infection.
Cell cycle synchronization
Cell cycle synchronization was achieved by modified protocols as described previously [Citation31]. Briefly, HEK293 cells were cultured in DMEM medium without serum for 48 h to induce G0/G1 arrest. For G1/S arrest, cells were synchronized by treatment of 5 µg/ml Aphidicolin (Sigma) for 24 h. HEK293 cells were treated with 100 ng/ml Nocodazole (Sigma) and incubated for 16–18 h to induce M phase arrest. The efficiency of synchronization was tested by flow cytometry using Propidium Iodide staining.
Immunofluorescence and immunostaining
HEK cells, c2c12 cells and HeLa cells were seeded in 8-wells chamber slides using standard procedures. Cells were stained with antibodies against cyclin B1 (1:500; Santa Cruz; SC-725) and phosphorylated Histone H3 (1:200; cell signal; 9701) for immunofluorescence as described previously [Citation31]. Cells were stained with 4′, 6-Diamidino-2-phenylindole dihydrochloride (DAPI) to visualize nuclei. Embryo and adult tissue samples were embedded in OCT compound (TissueTek) for cryosections and were cut into 7 μm sections. Cryosections were fixed blocked, and washed in various buffers for immunostainings (fix buffer: 4% paraformaldehyde, 0.1% deoxycholate, and 0.2% Nonidet P-40 in PBS; wash and block buffer: 2% bovine serum albumin, 3% goat serum, and 0.5% Nonidet P-40 in PBS). The washed sections were stained with antibody against GFP (1:1000; abcam; ab6556) and phosphorylated Histone H3 (1:200; cell signal; 9701), and detected with ABC-DAB system or detected with secondary antibody Alexa Fluorescence.
Protein isolation, Western blots
Protein isolation and Western blot analysis were performed using the standard protocol. Cells were lysed in HEPES buffer (HEPES buffer, 1% Triton X100 or 1% NP40, 1 mM PMSF, protease inhibitor mix, 60 min, 4◦C). Tissue samples were lysed by sonification in HEPES buffer. Lysates were combined with 10× SDS-loading buffer and denaturized by heating for 5 min at 100°C. Protein extracts were separated in 7–12% SDS-PAGE. After transfer, blocking, immunoblotting with primary and HRP-labeled secondary antibodies, blots were developed with the ECL detection kit.
Imaging
Immunofluorescence and immunostaining analysis was performed using an Axiophot microscope (Zeiss).
Supplemental Material
Download Zip (831.4 KB)Acknowledgments
The authors mostly thank to Ms. Wiesnet, Marion and Ms. Kreutzer, Susanne for their help for primary cardiomyocytes preparation and transgenic mouse generation. We would like to thank Dr. Schneider, André for discussion and suggestions. I am grateful to the people of my laboratory.
Disclosure statement
No potential conflict of interest was reported by the authors.
Supplementary material
Supplemental data for this article can be accessed here.
Additional information
Funding
Related Research Data
References
- Orlando DA, Lin CY, Bernard A, et al. Global control of cell-cycle transcription by coupled CDK and network oscillators. Nature. 2008;453:944–947.
- Nurse P. A long twentieth century of the cell cycle and beyond. Cell. 2000;100:71–78.
- Reis T, Edgar BA. Negative regulation of dE2F1 by cyclin-dependent kinases controls cell cycle timing. Cell. 2004;117:253–264.
- Sakaue-Sawano A, Kurokawa H, Morimura T, et al. Visualizing spatiotemporal dynamics of multicellular cell-cycle progression. Cell. 2008;132:487–498.
- Chittajallu DR, Florian S, Kohler RH, et al. In vivo cell-cycle profiling in xenograft tumors by quantitative intravital microscopy. Nat Methods. 2015;12:577-+.
- Gut G, Tadmor MD, Pe’er D, et al. Trajectories of cell-cycle progression from fixed cell populations. Nat Methods. 2015;12:951–954.
- Bajar BT, Lam AJ, Badiee RK, et al. Fluorescent indicators for simultaneous reporting of all four cell cycle phases. Nat Methods. 2016;13:993-+.
- Rodriguez EA, Tran GN, Gross LA, et al. A far-red fluorescent protein evolved from a cyanobacterial phycobiliprotein. Nat Methods. 2016;13:763–769.
- Swaffer MP, Jones AW, Flynn HR, et al. CDK substrate phosphorylation and ordering the cell cycle. Cell. 2016;167:1750–61 e16.
- Bassermann F, Frescas D, Guardavaccaro D, et al. The Cdc14B-Cdh1-Plk1 axis controls the G2 DNA-damage-response checkpoint. Cell. 2008;134:256–267.
- Ruijtenberg S, van Den Heuvel S. G1/S inhibitors and the SWI/SNF complex control cell-cycle exit during muscle differentiation. Cell. 2015;162:300–313.
- Barik D, Baumann WT, Paul MR, et al. A model of yeast cell-cycle regulation based on multisite phosphorylation. Mol Syst Biol. 2010;6:405.
- Li L, Zou L. Sensing, signaling, and responding to DNA damage: organization of the checkpoint pathways in mammalian cells. J Cell Biochem. 2005;94:298–306.
- Holsberger DR, Cooke PS. Understanding the role of thyroid hormone in Sertoli cell development: a mechanistic hypothesis. Cell Tissue Res. 2005;322:133–140.
- Cuddihy AR, O’Connell MJ. Cell-cycle responses to DNA damage in G2. Int Rev Cytol. 2003;222:99–140.
- Helmke KJ, Heald R, Wilbur JD. Interplay between spindle architecture and function. Int Rev Cel Mol Bio. 2013;306:83–125.
- Rahman MM, Kipreos ET. The specific roles of mitotic cyclins revealed. Cell Cycle. 2010;9:22–23.
- Toyoshima-Morimoto F, Taniguchi E, Shinya N, et al. Polo-like kinase 1 phosphorylates cyclin B1 and targets it to the nucleus during prophase. Nature. 2001;410:215–220.
- Chang DC, Xu N, Luo KQ. Degradation of cyclin B is required for the onset of anaphase in Mammalian cells. J Biol Chem. 2003;278:37865–37873.
- Lin H, Liu XY, Subramanian B, et al. Mitotic arrest induced by XK469, a novel antitumor agent, is correlated with the inhibition of cyclin B1 ubiquitination. Int J Cancer. 2002;97:121–128.
- Martins PAD. Mononuclear diploidy at the heart of cardiomyocyte proliferation. Cell Stem Cell. 2017;21:421–422.
- Turan S, Galla M, Ernst E, et al. Recombinase-mediated cassette exchange (RMCE): traditional concepts and current challenges. J Mol Biol. 2011;407:193–221.
- Nowak SJ, Corces VG. Phosphorylation of histone H3: a balancing act between chromosome condensation and transcriptional activation. Trends Genet. 2004;20:214–220.
- Klochendler A, Weinberg-Corem N, Moran M, et al. A transgenic mouse marking live replicating cells reveals in vivo transcriptional program of proliferation. Dev Cell. 2012;23:681–690.
- Easwaran HP, Leonhardt H, Cardoso MC. Cell cycle markers for live cell analyses. Cell Cycle. 2005;4:453–455.
- Leonhardt H, Rahn HP, Weinzierl P, et al. Dynamics of DNA replication factories in living cells. J Cell Biol. 2000;149:271–280.
- Kisielewska J, Lu P, Whitaker M. GFP-PCNA as an S-phase marker in embryos during the first and subsequent cell cycles. Biol Cell. 2005;97:221–229.
- Andaloussi SEL, Mager I, Breakefield XO, et al. Extracellular vesicles: biology and emerging therapeutic opportunities. Nat Rev Drug Discov. 2013;12:347–357.
- Foglia MJ, Poss KD. Building and re-building the heart by cardiomyocyte proliferation. Development. 2016;143:729–740.
- Magadum A, Ding YS, He L, et al. Live cell screening platform identifies PPAR delta as a regulator of cardiomyocyte proliferation and cardiac repair. Cell Res. 2017;27:1002–1019.
- Liu Z, Yue S, Chen X, et al. Regulation of cardiomyocyte polyploidy and multinucleation by CyclinG1. Circ Res. 2010;106:1498–1506.
- Zippel N, Schulze M, Tobiasch E. Biomaterials and mesenchymal stem cells for regenerative medicine. Recent Pat Biotechnol. 2010;4:1–22.
- Luch A. Cell cycle control and cell division: implications for chemically induced carcinogenesis. Chembiochem. 2002;3:506–516.
- Thomas N. Lighting the circle of life: fluorescent sensors for covert surveillance of the cell cycle. Cell Cycle. 2003;2:545–549.