
 ?Mathematical formulae have been encoded as MathML and are displayed in this HTML version using MathJax in order to improve their display. Uncheck the box to turn MathJax off. This feature requires Javascript. Click on a formula to zoom.
ABSTRACT
During the first rapid divisions of early development in many species, the DNA:cytoplasm ratio increases until the midblastula transition (MBT) when transcription resumes and cell cycles lengthen. S phase is very rapid in early embryos, about 20–30 times faster than in differentiated cells. Using a combination of DNA fiber studies and a Xenopus laevis embryonic in vitro replication system, we show that S phase slows down shortly after the MBT owing to a genome wide decrease of replication eye density. Increasing the dNTP pool did not accelerate S phase or increase replication eye density implying that dNTPs are not rate limiting for DNA replication at the Xenopus MBT. Increasing the ratio of DNA:cytoplasm in egg extracts faithfully recapitulates changes in the spatial replication program in embryos, supporting the hypothesis that titration of soluble limiting factors could explain the observed changes in the DNA replication program at the MBT in Xenopus laevis.
Introduction
The embryos of the African clawed frog Xenopus laevis have been widely studied to understand the cell cycle, development, and the connections between them. After fertilization of the X. laevis egg, a series of rapid and synchronous cell division cycles is initiated in many if not most animal species [Citation1]. In these cleavage cycles, genome replication (S-phase) and genome segregation (M-phase) alternate without gap phases (G1 and G2-phase) or cell cycle checkpoints. Little or no cell growth occurs during the cleavage cycles due to the absence of transcription. After 12–13 cleavage cycles, a threshold ratio of DNA:cytoplasm is reached, which leads to slowing down of the cell cycle [Citation2,Citation3] and resumption of zygotic transcription. This event is called the midblastula transition (MBT). After the MBT cell cycle length increases [Citation4,Citation5].
The extremely short S phase lasting only a few minutes during the cleavage cycles requires rapid but faithful duplication of the genome in comparison with S phases that last several hours at later stages of development and differentiation. In most metazoan cells, replication initiates at several thousands of fairly specific sites called replication origins according to a spatial and temporal program but no strict consensus sequence has been identified so far [Citation6,Citation7]. Origins are “licensed” for replication by loading of Orc1-6, Cdc6 and Mcm2-7 proteins on chromatin in late mitosis and G1 phase, thus forming pre-replicative complexes (pre-RCs) [Citation8]. Pre-RCs are subsequently activated during S phase by cyclin- and Dbf4/Drf1-dependent kinases (CDKs and DDKs) which leads to the recruitment of many other factors, DNA unwinding and start of DNA synthesis at origins. More Pre-RCs are assembled in G1 phase than used and origins activated in S phase. The selection of origins to be activated depends on epigenetic modifications [Citation9,Citation10], local concentration of replication factors and nuclear localization [Citation7] . How each of these different factors contributes to S phase length has been difficult to resolve in differentiated cells. Early developing embryos therefore provide a unique developmental context to study S phase duration around MBT. In Xenopus embryos, initiations of DNA replication take place randomly at the amplified rDNA locus before the MBT but are restricted to the intergenic region after the MBT when the rDNA genes are transcribed [Citation11]. In the widely used Xenopus in vitro system, sperm nuclei replicate efficiently in egg extracts, which is supposed to mimic the first S phase after fertilization. Typically, origins are spaced in the in vitro system every 10–15 kb [Citation12–Citation14] genome wide, whereas in somatic cells this distance is greater by about 10-fold [Citation15]. Varying the DNA:cytoplasm ratio in the Xenopus in vitro system leads to an increase of S phase length and it has been proposed that the replication program changes at the midblastula transition (MBT) [Citation16]. Single DNA fiber analysis showed that locally, inter-origin spacing did not change. Instead, the time of activation of different groups of origins (clusters) is spread out over time leading to an increase of S phase length by changing the temporal program [Citation17]. The temporal replication program in the in vitro system is regulated by the ATR/Chk1 dependent replication checkpoint [Citation17–Citation20]. Altogether these observations imply that a maternal diffusible replication factor becomes limiting at the MBT, connecting the DNA:cytoplasm ratio to the cell cycle, controlling the embryonic replication program. Slowing down of replication forks would activate the ATR/Chk1 dependent DNA replication checkpoint thereby slowing down origin firing and S phase progression.
In support of this model it has been shown, though at only one stage post-MBT, that overexpression of four replication initiation factors (Treslin, RecQ4, Drf1, TopBP1) delays the onset of the MBT in Xenopus laevis and reduces replication track distances [Citation21]. Other factors such as protein phosphatase 2A [Citation22], non-coding Y RNAs [Citation23], the chromatin remodeling complex xNuRD [Citation24], histones [Citation25], Rap1 interacting factor (Rif1) [Citation26] and dNTP pools have also been linked to the change of DNA replication program or the DNA:cytoplasm ratio at the MBT. Injection of dNTPs into early embryos leads to extra cleavage cycles [Citation27], and early embryos treated with the ribonucleotide reductase (RNR) inhibitor hydroxyurea (HU) are arrested at the MBT [Citation28]. In support of a role of the dNTP pool at the MBT, it has been reported that the dATP concentration decreases at the MBT [Citation29]. But dNTP injection into embryos slowed cell cycles, probably because of toxicity.
The aim of this study was to investigate how the genome-wide replication program changes at the MBT in Xenopus embryos by directly comparing replication in pre- and post-MBT embryos. Using an in vitro replication system based on embryonic extracts and DNA fiber studies we show that, shortly after the MBT, the number of replication eyes (in vitro labeled replication tracks, see Methods for further definition) decreases and the distances between replication eyes increase while fork speed remains unchanged. We also show that increased fork distances at the MBT can be reproduced in the egg extract system by increasing the DNA:cytoplasm ratio, supporting the role of known rate limiting replication factors or unknown soluble factors at this stage in development. Modulation of the dNTP pool by addition of exogenous dNTP did not change the replication program showing that dNTP are not limiting at this stage in vitro. Our study provides a new and straightforward strategy to study the DNA replication program during early vertebrate development by the use of an embryonic in vitro system.
Materials and methods
Reagents and antibodies
Roscovitine was purchased from Sigma-Aldrich ®, aliquoted at −20°C and used only once, Anti-DNA antibody (Mab3032) from Merck-Millipore, StreptavidinAlexaFluor594 and AlexaFluor antibodies from Invitrogen, anti-human P-Chk1 (Ser345) (#2341), recognizes Xenopus P-Chk1 (S342) and anti-human P-Cdc25 (Ser216) (#4901), recognizes Xenopus P-Cdc25C (S287) from Cell signaling. Anti-Xenopus cyclin E1 developed by J. Maller was obtained from the European Xenopus Resource Centre, UK. Recombinant GST-tagged human p21 was expressed in E.coli and purified as described [Citation30].
Xenopus in vitro fertilization and extract preparation
In vitro fertilization of Xenopus eggs with sperm was performed according to standard techniques at 22–23°C [Citation31], and developmental stages of embryos were determined according to [Citation32]. Embryonic lysates were prepared as described [Citation23,Citation33] with some modifications. 100–200 dejellied early blastula (stage 7) and late blastula (stage 9) embryos (siblings) were washed in embryo extraction buffer (10mM Hepes, pH 7.7 KOH, 100mM KCl, 50 mM Sucrose, 1mM MgCl2, 0.1 mM CaCl2 and spun at 700 g for 1 min, to pack embryos without crushing. Excess liquid was removed and embryos were centrifuged at 17 000 g for 10 min at 4°C. The two middle phases (clear yellow containing cell extracts and a small greyish phase containing the nuclei) were isolated with a needle and combined. Into this crude extract containing endogenous nuclei energy mix (7.5 mM creatine phosphate, Creatine kinase, 1 mM ATP) and 20µM rhodamine-dUTP, 20µM biotin-dUTP (Roche Applied Science), or [α-32P]dATP was added. Replication was allowed to continue, then aliquots were withdrawn at indicated time points and replication reactions stopped. Interphase egg extracts and replication reactions with varying concentration of nuclei were performed as described [Citation19]. Embryo lysates for western blot analysis were prepared by adding 100 µl of EB buffer plus proteinase inhibitors and phosphatase inhibitors to 10 embryos which were centrifuged for 10 min, 4°C at 18.000 g. The interphase was collected and prepared for SDS-PAGE and western blot analysis. Protocols including Xenopus laevis have been approved by the local ethical review board for animal welfare and animal experimentation (comité d’éthique Paris Centre et Sud N°59, N° 2012–0062) according to French and European regulation on animal research.
Molecular combing and detection by fluorescent antibodies
DNA was extracted and combed as described [Citation34]. Biotin was detected using AlexaFluor594 conjugated to streptavidin followed by incubation with biotinylated anti-avidin antibodies (repeated twice). DNA was labeled by mouse anti-DNA antibody followed by AlexaFluor488 rabbit anti-mouse then goat anti-rabbit antibodies for enhancement [Citation19].
Molecular combing measurements and data analysis
Images of the combed DNA molecules were acquired and measured as described [Citation34]. For each combing experiment, a total of 5–11 of Mb DNA was measured. The fields of view were chosen at random. Measurements on each molecule were made using Image Gauge version 4.2 (Fujifilm) and compiled using macros in Microsoft Excel (2010). Replication eyes were defined as the incorporation tracks of biotin–dUTP. Replication eyes were considered to be the products of one, two or more replication forks, because cells and therefore also initiations are asynchronous in post-MBT. We therefore preferred the more general term replication eye to a replication fork in this study. Incorporation tracks at the extremities of DNA fibers were considered to be the products of one replication fork. Tracks of biotin-labeled DNA needed to be at least 1 kb to be considered significant and scored as eyes. When the label was discontinuous, the tract of unlabeled DNA needed to be at least 1 kb to be considered as a real gap. The replication extent was determined as the sum of eye lengths divided by the total DNA length. Replication eye density was calculated as the total DNA divided by the total number of replication eyes. Eye-to-eye distances (ETED), were measured between the midpoints of adjacent replication eyes. The means of fiber lengths were comparable inside each individual experiment in order to avoid biases in eye-to-eye distances. Incorporation tracks at the extremities of DNA fibers were not regarded as replication eyes, but were included in the determination of the replication extent, calculated as the sum of all eye lengths (EL) divided by total DNA. Box plots of ETED (with n ranging from 80 to 400) were made using GraphPad version 6.0 (La Jolla, CA, USA). Statistical analysis of repeated experiments has been included as means including ranks where possible. Summary tables of all combing results are in the supplementary data. To further analyze the distribution of eye-to-eye distances (ETED), the data were tabulated into a histogram of 70 bins in a range of 0-90kb. For the Fourier analysis, we used the fast fourier transform (fft) function in Matlab (vR2013a) to evaluate the discrete Fourier transform of the ETED distribution. Then, we calculated the power spectral density (PSD) as:
with , N = 70 and fs = 0.78kb−1.
Fourier transforms are usually used to find the frequency components of a temporal signal, and therefore, the frequency unite is in [Hz] ([1/s]). In our case, the signal is defined in the spatial domain, therefore Fourier transform of the signal and the related power spectral density are defined in the domain of the conjugate variable, that is the spatial frequency domain, also called wavenumber domain. Hence, as the eye-to-eye distances are defined in [kb], the power spectral density of their distribution depends on the conjugate variable of the distance, i.e. on wavenumber whose unit is [1/kb].
Neutral and alkaline agarose gel electrophoresis
Embryonic extracts were complemented with indicated reagents and one-fiftieth volume of [α-32P]dATP (3000 Ci/mmol). DNA was purified, separated on 0.8% TBE-agarose or 1.1% alkaline agarose gels, and analyzed as described [Citation14]. The fraction of incorporated radiolabeled signal was calculated relative to the maximal incorporation in each sample in order to calculate means and compare different experiments.
Results
De novo DNA synthesis in pre- and post-MBT embryonic extracts
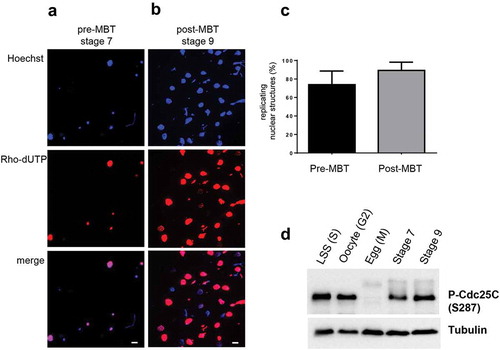
In order to investigate how the spatiotemporal replication program changes during early X. laevis development, we established protocols to label replicating DNA in developing embryos before and after MBT (). Different attempts to label whole developing embryos in vivo with short pulses of BrdU supplied to external buffer did not result in a robust labeling of replicated DNA in nuclei or on single DNA fibers (data not shown). We therefore used an in vitro system based on embryonic extracts [Citation33], thus differing from the well-known egg extract in vitro system [Citation35]. Embryos which have been fertilized in vitro in one batch develop very synchronously. Cell divisions inside each embryo are synchronous during the first stages, then nearly synchronous until cell cycle 12. At a constant temperature cell cycle length before the MBT is very reproducible (30–32 min at 22.5°C) and each end of mitosis can be easily determined by the appearance of the cleavage furrow indicating cytokinesis. DNA replication starts in pre-MBT embryos already in telophase [Citation33]. Therefore, for pre-MBT conditions, embryos were harvested at stage 7, containing 128 cells at the end of cell cycle 8 in telophase which was monitored by the first appearance of the cleavage furrow. For post-MBT conditions, embryos were harvested at stage 9 in cell cycle 13–14 containing 4096–8192 cells. At this stage the cell cycle length is around 60–75 min on average and synchrony of cells inside each embryo is now lost [Citation2]. Several hundreds of embryos from the same sibling for both developmental times were collected and broken down by centrifugation to obtain four phases (). The two middle phases containing crude cell extract and endogenous nuclei [Citation33] were collected together. Western blot analysis of these embryo lysates confirms the Nieuwkoop and Faber staging since a decrease of cyclin E1 between stage 7 and 9 and the transient Chk1 phosphorylation at stage 9 were observed () which is consistent with previous studies [Citation36–Citation38]. To these fresh embryonic extracts containing endogenous nuclei we added rhodamine-dUTP for 15 or 20 min as well as an ATP regenerating system in order to visualize replication in vitro by fluorescence microscopy in labeled nuclear structures (). Small nuclear structures in pre-MBT extracts represent karyomeres, which are individual chromosomes surrounded by a nuclear membrane typical for this developmental stage and which disappear after stage 9 [Citation33]. We found that 80% of all nuclear structures in pre-MBT lysates were karyomeres (2–6 µm in diameter) and only 30% in post-MBT lysates with predominant interphase nuclei (16–20 µm diameter)(Suppl. Figure 1), consistent with earlier observations [Citation23,Citation33,Citation39]. Rhodamine-labelled DNA could be detected in 73.9% or 89.3% of nuclear structures after incubation in pre-MBT () and post-MBT () extracts, respectively. In post-MBT embryo interphase nuclei, typical replication foci pattern with early, mid and late foci were observed (data not shown). Western blot analysis of embryo lysates probed against the phosphorylated (S287) and inactive phosphatase Cdc25C further confirmed that the cells at the time of harvest were highly enriched in interphase () [Citation40,Citation41]. These results show that DNA was synthesized de novo after the cellular breakdown and that embryonic extracts in both conditions contain a very high percentage of S phase nuclei.
Figure 1. Embryonic in vitro replication system.
(a) Developmental stages during early development of Xenopus laevis, stage diagrams from [Citation32], (b) Experimental strategy of in vitro replication system from pre- or post-MBT embryos; MBT, Mid-Blastula-Transition. (c) Western blot analysis of embryo lysates from stage 7 and stage 9 with anti-Xcyclin E1 and anti-human P-Chk1(S345) antibodies (which recognize Xenopus P-Chk1 homolog S342), anti-tubulin as loading control, * marks non-specific band.
![Figure 1. Embryonic in vitro replication system.(a) Developmental stages during early development of Xenopus laevis, stage diagrams from [Citation32], (b) Experimental strategy of in vitro replication system from pre- or post-MBT embryos; MBT, Mid-Blastula-Transition. (c) Western blot analysis of embryo lysates from stage 7 and stage 9 with anti-Xcyclin E1 and anti-human P-Chk1(S345) antibodies (which recognize Xenopus P-Chk1 homolog S342), anti-tubulin as loading control, * marks non-specific band.](/cms/asset/cd5959a2-4e00-4b75-9c12-3bac0fd2e2c1/kccy_a_1618641_f0001_oc.jpg)
Figure 2. DNA replication of karyomeres and interphase nuclei in embryonic extracts.
Karyomeres and nuclei in embryonic extracts were incubated for 15 min in the presence of rhodamine-dUTP and processed for fluorescence microscopy. Karyomeres and interphase nuclei were isolated from (a) pre-MBT lysates, (b) post-MBT lysates. (c) Mean percentages (with standard deviation) of all replicating nuclear structures, karyomeres and interphase nuclei, were quantified from two independent experiments. bar = 15 µm, (d) Western blot analysis of embryo lysates from stage 7 and stage 9 with anti-human P-Cdc25C (S219) antibodies, which recognize Xenopus P-Cdc25C (S287). LSS (S): low-speed supernatant, S phase egg extract; Oocyte (G2): oocyte extract (G2 phase), Egg (M): inactivated, laid egg extract (meiosis); st7: stage 7 embryo lysate; st9: stage 9 embryo lysate.
Next, to better characterize the replication kinetics in early pre-MBT embryonic extracts, we added [α32P]-dATP for different periods from the start of incubation. DNA was purified and nascent strands were separated by alkaline gelelectrophoresis (). We observed that the nascent strand synthesis increased between 1 and 10 min incubation time, then slowed down by 15 min. Small-sized nascent strands were more abundant in earlier (2–5 min) than in later time points in which high molecular weight DNA is predominant. This observation is consistent with the initiation of DNA replication in the beginning and continued DNA synthesis later during the incubation period. Some small-sized labeled DNA at later time points persists, probably produced by DNA shearing during sample processing. Similar replication kinetics were obtained with nuclei in post-MBT extracts (Suppl. Figure 2). The observed replication label could represent elongation of replication forks from origins activated in vivo, new origins activated in vitro or both. In order to distinguish between these two possibilities, we added the Cdk1/2 inhibitor roscovitine to replication reactions in the presence of [α32P]-dATP in pre-MBT and post-MBT extracts to inhibit the activation of new origins (). We found that addition of roscovitine led to a 48% and 53% inhibition of replication in pre-MBT and post-MBT, respectively, in comparison to the control (mean of two experiments, t-test, P-value 0.0012 and 0.032, respectively). We repeated these experiments using the Cdk2 inhibitor p21/Cip1with very similar results (Suppl. Figure 3). This shows that de novo initiation takes place in the embryonic system, but also suggests that S phase has already started in some cells in vivo as Cdk2 inhibition did not completely inhibit DNA replication. We thus also monitor ongoing DNA replication from origins initiated in vivo, in addition to those initiated in vitro. In conclusion, these experiments show that de novo DNA replication and initiation take place in the in vitro embryonic extract system allowing us to study DNA replication before and after MBT.
Figure 3. De novo initiation of DNA replication in embryonic extracts.
Pre-MBT extracts and nuclei were incubated with [α-32P]dATP for 1–15 min, genomic DNA was purified and separated by alkaline gelelectrophoresis (a), (b) radiolabeled fraction of maximal incorporation of [α-32P]dATP of two independent nascent strand experiments (mean and SEM), (c) pre-MBT and post-MBT extracts with nuclei were incubated with [α-32P]-dATP in the absence or presence of roscovitine (40µM) for 15 min. As in (A), DNA was purified, separated and the fraction of maximal radiolabeled incorporation was determined in two independent experiments (mean and SD).
![Figure 3. De novo initiation of DNA replication in embryonic extracts.Pre-MBT extracts and nuclei were incubated with [α-32P]dATP for 1–15 min, genomic DNA was purified and separated by alkaline gelelectrophoresis (a), (b) radiolabeled fraction of maximal incorporation of [α-32P]dATP of two independent nascent strand experiments (mean and SEM), (c) pre-MBT and post-MBT extracts with nuclei were incubated with [α-32P]-dATP in the absence or presence of roscovitine (40µM) for 15 min. As in (A), DNA was purified, separated and the fraction of maximal radiolabeled incorporation was determined in two independent experiments (mean and SD).](/cms/asset/a1cb1b25-536a-497d-990d-d7cc7f341967/kccy_a_1618641_f0003_b.gif)
Genome-wide decrease of replication eye density after the MBT
We performed DNA combing experiments to determine replication parameters such as distances between replication eyes, eye density and fork speed. Embryonic extracts from embryos (same siblings) at stage 7 (pre-MBT) or stage 9 (post-MBT) with endogenous nuclei were incubated for 4, 5 or 6 min with biotin-dUTP. DNA was isolated for DNA combing experiments. Sufficient biotin-dUTP incorporation on DNA fibers was detected in both conditions allowing us to visualize replication eyes and to measure eye-to-eye distances (ETED) in pre- and post-MBT extracts (, see also Material and Methods). As shown in , depending on labeling time, replication extent increases in pre- and post-MBT conditions, consistent with the above radioactive dATP incorporation experiments. Moreover, for all three labeling times replication extent was lower in the post-MBT than in the pre-MBT embryo extracts, consistent with a slower cell cycle 13 and slower DNA synthesis [Citation2]. Because replication eyes in the less synchronous post-MBT embryos could represent one replication fork from elongation patterns or two active replication forks from initiation patterns, we calculated replication eye density rather than fork density as in previous studies. We observed a mean decrease of replication eye densities of 30% in the three post-MBT conditions compared to pre-MBT conditions (, 4.8 versus 6.9 replication eyes per 100 kb, P-value 0.018, t-test) which explains the lower DNA synthesis rate in post-MBT embryos. In order to get an estimate of the total number of active origins before and after MBT, we considered that the replication eye density approximates origin density. This is a good approximation in the very synchronous pre-MBT embryos but probably an overestimation in the less synchronous post-MBT embryos. For the genome size of diploid somatic cells of Xenopus laevis this would result in around 430 000 active origins before MBT and 300 000 after MBT (at stage 9).
Figure 4. Higher replication eye density in pre-MBT extracts than in post-MBT extracts.
Embryonic extracts and nuclei were incubated in the presence of biotin-dUTP for 4, 5, 6 min, genomic DNA was purified, combed and labeled as described, AlexaFluor488: anti-DNA, AlexaFluor594-streptavidin: biotin-dUTP labeled replication eyes. (a) example of combed DNA fibers of pre-MBT, (b) post-MBT (4 min biotin-dUTP), (c) replication extent calculated from three independent combing experiments with different labelling times, (d) mean replication eye density (N/100kb), (e) eye-to-eye distance distributions (ETED) (scatter dot plots with median) for 5 min labelling time (black pre-MBT, grey post-MBT) and indicated biotin-dUTP labelling times, (f) eye length (EL) distributions for 6 min labelling time (scatter dot plots with median), Mann–Whitney test, ns not significant, significant *, **, ***, P-values see text.
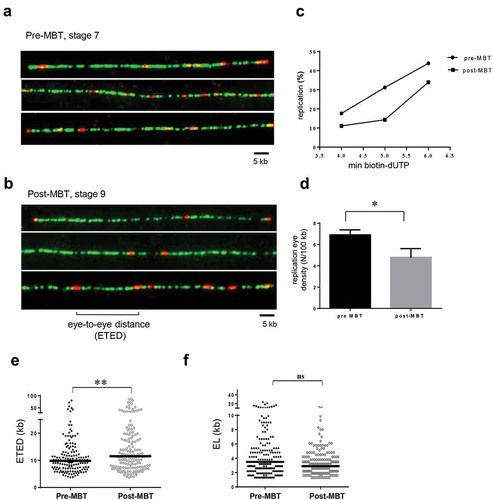
Next, we compared ETED distributions between pre- and post MBT extracts (). We found a significant increase of ETED distances in post-MBT extracts in comparison to pre-MBT extracts (median: 11.5 versus 9.8 kb; Mann–Whitney Test, P-value 0.0064, mean: 12.7 versus 17.0 kb), consistent with the observed mean decrease in replication eye density in post-MBT extracts. Since the decrease in synthesis rate could be due to slower fork progression, we also compared replication eye lengths (EL), which are good indicators of replication fork speed (). We did not find any significant difference between distributions of eye lengths before and after MBT (Mann–Whitney test, P-value 0.32). We conclude that replication eye density rather than fork speed decreases after MBT, strongly suggesting that origin density decreases likewise.
Increasing the DNA:cytoplasm ratio in egg extracts reproduces the increase of replication eye distances in embryonic extracts after the MBT
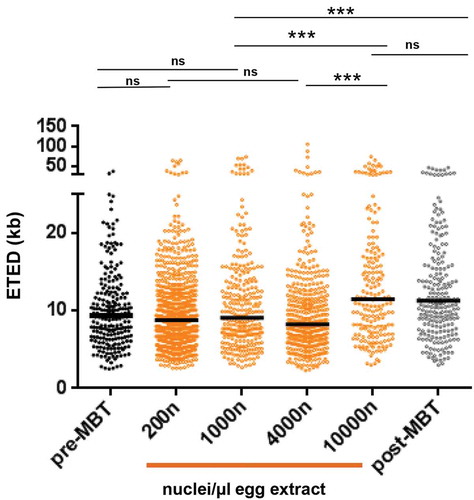
The decrease of replication fork density after MBT could be due to depletion of soluble factors or to other changes related to the onset of zygotic transcription and chromatin remodeling at the MBT. Only the hypothesis of depletion of soluble factor(s) can be reproduced in egg extracts, by increasing concentration of nuclei. The concentration of nuclei at the MBT at stage 8/9 embryos corresponds to 10,000 nuclei per µl of egg extract. In order to compare the eye distances from the in vitro embryo system to those from the in vitro egg system, we generated new combing data in egg extracts with different nuclear-cytoplasmic ratios (200–10,000 nuclei/µl). Sperm nuclei replicate in interphase egg extracts in 30–45 min whereas S phase in vivo in pre-MBT embryos lasts less than 30 min [Citation2]. Therefore, we compared experiments in the egg extract system with similar replication extent in mid S phase (25–53%) to the embryonic system, rather than using similar labeling times (). We found that ETED distributions in the egg extract system at mid-S phase were not statistically different at low (200 nuclei/µl) and high (1000–4000 nuclei/µl) nuclei concentration consistent with earlier observations [Citation17]. Furthermore, the pre-MBT ETED distributions were not significantly different from the ETED distributions from the egg extract system at nuclei concentration of 200, 1000 and 4000 nuclei/µl (P-values: 0.11, 0.53 and 0.05, respectively). However, all distributions representing pre-MBT stages in the egg extract and embryonic extracts, were different than distributions of the post-MBT embryonic extract and of 10.000 nuclei/µl in the egg extract system (P-value = or <0.0001). ETED in post-MBT and in very high nuclei (10,000 nuclei/µl) were not statistically different (P-value 0.67). We conclude that local replication eye distances in the pre-MBT embryonic system are identical to those in the established egg extract system at concentrations up to 4000 nuclei/µl, demonstrating that, independent of the experimental system, local replication eye distances distributions are surprisingly stable before MBT. Further on, in vitro egg extract experiments with nuclei concentrations close to those found at the MBT reproduce local eye distances from post-MBT embryos. This result strongly suggests that the initial decrease of the replication eye density after the MBT can be mainly attributed to the depletion of limiting soluble factors.
Figure 5. Increase of DNA:cytoplasm ratio in vitro recapitulates increase of eye-to-eye distances after the MBT in embryos.
Scatter dot plots of eye-to-eye distance (ETED) distributions from the in vitro egg extract system (orange) with different nuclei concentrations (200–10,000 nuclei/µl) at mid S phase (R 25–53%) are compared to ETED distances distribution from pre- and post-MBT extracts (black and grey, respectively). The horizontal black bars are the medians. Mann–Whitney test, ns not significant, significant *, **, ***, P-values see text.
dNTP levels are not limiting for the replication program at the MBT in embryonic extracts
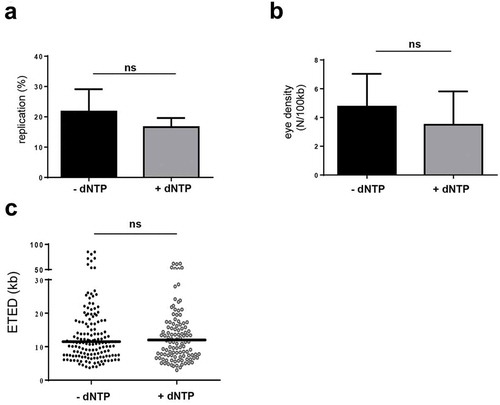
Next, we wanted to test whether the dNTP pool becomes limiting at the MBT [Citation2,Citation27]. The concentration of dCTP and dATP in interphase egg extracts is 50 µM [Citation35]. We added water or dNTP (50 µM for each dNTP) to post-MBT embryonic extracts and nuclei in the presence of biotin-dUTP (5 min) and performed DNA combing experiments. If the dNTP limiting model is right we would expect to see an increase of the replication extent and eye density after dNTP addition in post-MBT embryonic nuclei. In two independent experiments, we found that the replication extent () and eye density () were not significantly increased. In addition, we did not find any significant difference of ETED distribution (, mean ETED-dNTP 17.0 kb versus +dNTP 15.4 kb, P-value 0.6732). We conclude that dNTP addition does not accelerate DNA replication in the embryonic extract system post-MBT.
Figure 6. Increase of dNTP pool did not increase replication rate in post-MBT extracts.
Nuclei in post-embryonic extracts were labeled with biotin-dUTP in the absence (black) or presence of 50µM dNTP (grey). DNA combing experiments in post-MBT extracts were performed, two independent experiments (a) mean replication extent (SEM), t-test, (b) mean replication eye density (SEM) t-test, (c) eye-to-eye distance (ETED) distributions (scatter dot plots with median), Mann Whitney test, P-values see text.
Apparent correlation length of replication eye distances in pre-MBT embryos
In pre-MBT Drosophila embryos, Blumenthal et al. found a periodicity in eye-to-eye distances distributions of multiples of 3.4 kb [Citation42], suggesting a regular spacing of origins. We investigated this question in pre-MBT Xenopus embryos choosing the 4-min labeling time point because it represents the early S phase where the probability of merged neighboring eyes is the lowest. A clear peak of the frequency of ETED around 7–10 kb was detected. However, we found no additional peaks of multiples at 7–10 kb, as expected if there were periodic spacing (). In order to detect less apparent periodicities, we performed a Fourier analysis and plotted the power spectral density (). If the origins are periodically distributed then we expected to detect a single sharp peak. However, we could only observe one broad, sufficiently high peak (indicated with an arrow) which suggests that origins are not very regularly spaced. Nevertheless, this new analysis reveals the existence of a 7.5 kb correlation length among fired origins in pre-MBT embryos. We conclude that origins in Xenopus embryos are not spaced completely at random but can be found at ̴7.5 kb intervals although less regular than in Drosophila.
Figure 7. Length correlation of eye-to-eye distances in pre-MBT extracts.
(a) Frequency of ETED after 4 min biotin-dUTP labelling, 1.256 kb/bin, n = 249, (b) power spectral density (PSD) of data from (a); Arrow for considered peak in (b).
Discussion
Rapid cell cycles are typical of cleavage cycles of flies, amphibians and fish but even mammals exhibit rapid cell cycles in close association with gastrulation [Citation43]. How these quick cell cycles including the duplication of complex genomes are controlled and how the transition to a slower adult replication mode at the MBT occurs has been of interest for a long time. Although it was shown at two specific loci that the initiation pattern change after the MBT in Xenopus and Drosophila using 2D gel electrophoresis [Citation11,Citation44], it was still unclear how the spatial replication program changes at the MBT genome-wide. Since the introduction of DNA combing technique to study replication programs, much progress has been made to visualize origins at the level of single DNA fibers genome-wide. This approach provides a direct value origin or replication of eye distances. In contrast, population-based techniques, like two-dimensional gel electrophoresis or recent sequencing of nascent strands, tend to overestimate origin densities since not every origin of each cell is fired in each cell cycle. In an early pioneering study in Drosophila using autoradiography on single DNA fibers, Blumenthal et al. showed that origins are closely spaced in cleavage nuclei and more restricted in differentiated cell culture cells, with mean center distances between track length about four times larger in comparison to cleavage nuclei [Citation42]. Here, we show for the first time on single DNA fibers genome-wide in Xenopus that the number of replication eyes decreases by one third shortly after the MBT because distances between neighboring eye lengths increase. This observation most probably also reflects a similar decrease in the density of active replication origins. No difference in fork speed could be detected as eye lengths did not change. Our results extend similar observations of Collart et al. that were limited to one stage post-MBT [Citation21]. In contrast to the latter study, we found smaller distances between replication eyes, which is probably due to the shorter labeling times we used in our study (4–6 min versus 10 min in [Citation21]). In dissociated blastomeres, cell cycles last 35 min before MBT but the cell cycle 13 lasts on average 60 min concomitantly with a decrease in 3H-thymidine incorporation [Citation2]. More recently, S, M, G1 and G2 phase length were determined by in vivo time-lapse microscopy in early Xenopus blastomeres [Citation45]. According to this study S phase length increases 1.5 fold between pre-MBT (22–25 min) and stage 9 post-MBT embryos (33-40 min). Fork density and S phase length are not necessarily correlated in a strict linear manner [Citation46]. Therefore, the relatively small decrease of 30% in eye density between pre-MBT (cycle 8) and post-MBT (late blastula cycle 13) extracts in our experiments is consistent with a progressive increase of the cell cycle length after the MBT. This suggests that the replication program changes gradually, but not immediately after the MBT as does cell cycle length. A change in the initiation pattern between Xenopus laevis embryos at pre- and post-MBT stages has been observed at the specific locus of the rDNA repeats using two-dimensional gel electrophoresis [Citation11]. In pre-MBT embryos, initiations were random through-out the locus, but in late blastula embryos, initiations were repressed in the highly transcribed rDNA genes and restricted to the intergenic region, suggesting that, on average, origin density decreases on this specific locus linked to the resumption of rDNA transcription after MBT. We also previously showed, using DNA combing and FISH, that initiations at the rDNA locus are less random and more frequent in the transcription unit in egg extracts [Citation47]. Our results on the whole genome using DNA combing are therefore consistent with these early observations at the rDNA locus and show that replication eye density decreases globally although to a lesser extent than deduced from one locus.
In order to ensure that during the rapid embryonic S phase no DNA is left unreplicated before mitosis it was suggested that origins are regularly spaced in Xenopus [Citation48] as it was reported in Drosophila [Citation42]. In a former study, we and others did not detect a regular spacing of origins in sperm nuclei replicating in Xenopus egg extracts [Citation12,Citation14], although the eye distance distribution was not completely random. In this study, we performed a Fourier analysis to better visualize a potential periodicity of eye-to-eye distances in pre-MBT embryos. Again, no strict regular spacing was detected but a more evident correlation length of around 7.5 kb was detected. Maybe the much shorter S phase length in Drosophila early embryos (3.5 min) in comparison to Xenopus embryos (20 min) reflects different replication strategies and explains the differences in origin spacing. How the spatial replication program is regulated in the absence of any sequence specificity in Xenopus needs further investigation. We recently showed that the ATR/Chk1 dependent replication checkpoint regulates the frequency of initiation events in this system [Citation19]. Numerical simulations including checkpoint mechanisms and origin organization in clusters can reproduce experimental data, including eye-to-eye distance distributions (manuscript in preparation). In mice, genome-wide studies show that the temporal program of replication changes during development at the level of large replication domains [Citation49,Citation50]. In this study, we did not investigate the temporal replication program at the lower resolution level of replication domains (100 kb-1Mb), but a previous study showed that the timing program also exists in the Xenopus egg extract system at the level of replication foci reflecting domains [Citation47]. Recently, a study in zebrafish reported that replication timing domains are already established before the MBT and the onset of transcription but change progressively after the MBT [Citation51], analogous to our observation of a gradual change in the spatial replication program.
The Xenopus in vitro system based on egg extracts has been extensively used to study DNA replication, and it was presumed that it mimics the rapid S phase replication program of the first cleavage cycles after fertilization. Here, we actually show that the eye-to-eye distances in the egg extract system with nuclei concentrations corresponding to pre-MBT stages are identical to those in pre-MBT extracts, although S phase is longer in the in vitro system. This validates on the one hand this embryonic in vitro system and shows on the other hand that replication eye distances before MBT are remarkably constant, independent of S phase length and experimental system. Increasing the nuclei concentration beyond DNA:cytoplasm ratios corresponding to those at the MBT leads to distance distributions identical to those found in post-MBT extracts. In other words, depleting cytosolic factors in vitro is sufficient to recapitulate the increase in eye-to-eye distances seen in embryos shortly after the MBT. Furthermore, this suggests that other changes which take place at the MBT in vivo, like the resumption of transcription and changes in histone variants and histone modifications [Citation52,Citation53], are not the main cause of the observed increase of eye-to-eye distances in Xenopus. This is consistent with the initial observations made by Newport and Kirschner [Citation2] which showed that injection of Xenopus embryos at the one-cell-stage with the transcription inhibitor α-amanitin did not change the length of the cleavage cycles at the MBT. We cannot however rule out that at later stages the resumed transcription and associated changes in chromatin structure influence with the spatial replication program. Further studies are needed to correlate these changes to the replication program in Xenopus. A correlation between transcriptional activity and active origins is well established, but the question of whether transcriptional activity specifies replication origins during development or vice versa is still a matter of debate. In pluripotent (pre-gastrula) stages of C. elegans, origins were recently found to be enriched on promotors [Citation54] or enhancers [Citation55] of highly active genes. In contrast to Xenopus, Zebrafish and Drosophila, transcription in C. elegans has already started at the four-cell stage. Rodriguez-Martinez et al. reported that new origins are selected after gastrula transition as a function of the transcriptional program because their positions change from TSS sites to enhancer and non-coding regions. However, Pourkarimi et al. concluded that replication origins are predefined in pre-gastrula embryos prior to the broad onset of transcription after gastrulation because their position is mostly invariant throughout different stages even though the transcriptional programs changes. The latter study is therefore more in line with our and another study [Citation21] both showing that the spatial replication program at the MBT in Xenopus changes, at least to some extent, independently of transcriptional activity. In Drosophila, the replication checkpoint activation at the MBT depends on the level of recruitment of RNA Polymerase II [Citation56]. It is possible that different organisms adapted different strategies for cell cycle control at the MBT.
It has been proposed that replication factors are limited in yeast [Citation57] and become limiting in Xenopus, due to the increase of the DNA:cytoplasm that reaches a threshold at the MBT, which slows down replication forks [Citation2]. In Xenopus, it was shown that the four essential initiation factors Drf1, TopBP1, Treslin and RecQ4 become limiting at the MBT and that overexpression of all four factors in embryos led to extra cleavage cycles [Citation21]. After overexpression of these factors, DNA combing experiments in dissociated cells from dissected animal caps at one stage around the MBT after overexpression of these factors showed a two-fold increase of replication extent due to a decrease of gap length between replication tracks in comparison to the control. We wondered whether these four factors are the only limiting replication factors at the MBT. It is known that the dATP concentration in embryos decreases after the MBT [Citation29], implying that the dNTP concentration could become limiting for the replication program at the MBT. In mammalian cells and yeast, respectively, the deoxynucleotide availabilities can modulate origin choice and origin spacing [Citation58,Citation59]. In our study, we did not find an increase of replication eye density suggesting that depletion of dNTP pools alone at the MBT does not change the replication program in Xenopus embryos. This is similar to conclusions from [Citation21] where it was shown that dNTP injections alone did not delay or reduce Chk1 activation at the MBT. However, the effect of dNTP injections alone or in combination with replication factors on the DNA replication program in embryos were not studied in this study. Why HU treatment of Xenopus embryos leads to cell death at the MBT [Citation28] but dNTP addition or injection alone had no effect on the replication program or the checkpoint activation at the MBT requires further studies. Maybe HU has other secondary, toxic effects [Citation60] on early Xenopus embryos.
In conclusion, we show genome-wide that the spatial replication program changes at the MBT in Xenopus laevis. Our finding that a simple increase of the DNA:cytoplasm ratio in vitro does entirely reproduce local replication eye distances found in vivo after the MBT suggests that titration of limiting replication factors or other unknown cytosolic factors can explain the initial change of the spatial replication program at the MBT. This embryonic replication system will allow us to further dissect the replication program in the Xenopus model system. Indeed, biochemical fractionation methods combined with deep proteomics studies could help identifying novel replication factors (proteins or non-coding RNAs) controlling the change of the replication program at this important developmental transition.
Supplemental Material
Download Zip (152.2 KB)Acknowledgments
We thank the reviewers for their constructive comments, Bruno Miroux for critical reading of the manuscript and Arach Goldar and Torsten Krude for discussions. This work was supported by the “Association pour la recherche contre le Cancer (ARC)” and “LIGUE contre le cancer” for KM lab. M.P. was supported by a MNERT PhDfellowship of the université Paris/Sud, D.C is supported by a PhD fellowship from IdEx program of université Paris-Saclay. Anti-Xenopus cyclin E1 developed by J. Maller was obtained from the European Xenopus Resource Centre, curated with funding from the Wellcome Trust/BBSRC and maintained by the University of Portsmouth, School of Biological Sciences.
Disclosure statement
No potential conflict of interest was reported by the authors.
Supplementary material
Supplemental data for this article can be accessed here.
Additional information
Funding
Related Research Data
References
- O’Farrell PH, Stumpff J, Su TT. Embryonic cleavage cycles: how is a mouse like a fly? Curr Biol. 2004;14:R35–45.
- Newport J, Kirschner M. A major developmental transition in early Xenopus embryos: I. characterization and timing of cellular changes at the midblastula stage. Cell. 1982;30:675–686.
- Satoh N. Timing mechanisms in early embryonic development. Differ Res Biol Divers. 1982;22:156–163.
- Kane DA, Kimmel CB. The zebrafish midblastula transition. Development. 1993;119:447–456.
- Masui Y, Wang P. Cell cycle transition in early embryonic development of Xenopus laevis. Biol Cell. 1998;90:537–548.
- Méchali M, Yoshida K, Coulombe P, et al. Genetic and epigenetic determinants of DNA replication origins, position and activation. Curr Opin Genet Dev. 2013;23:124–131.
- Prioleau M-N, MacAlpine DM. DNA replication origins-where do we begin? Genes Dev. 2016;(30):1683–97.
- Parker MW, Botchan MR, Berger JM. Mechanisms and regulation of DNA replication initiation in eukaryotes. Crit Rev Biochem Mol Biol. 2017;52:107–144.
- Picard F, Cadoret J-C, Audit B, et al. The spatiotemporal program of DNA replication is associated with specific combinations of chromatin marks in human cells. PLoS Genet. 2014;10:e1004282.
- Cayrou C, Ballester B, Peiffer I, et al. The chromatin environment shapes DNA replication origin organization and defines origin classes. Genome Res. 2015;25:1873–1885.
- Hyrien O, Maric C, Méchali M. Transition in specification of embryonic metazoan DNA replication origins. Science. 1995;270:994–997.
- Blow JJ, Gillespie PJ, Francis D, et al. Replication origins in Xenopus egg extract Are 5-15 kilobases apart and are activated in clusters that fire at different times. J Cell Biol. 2001;152:15–25.
- Herrick J, Stanislawski P, Hyrien O, et al. Replication fork density increases during DNA synthesis in X. laevis egg extracts. J Mol Biol. 2000;300:1133–1142.
- Marheineke K, Hyrien O. Aphidicolin triggers a block to replication origin firing in Xenopus egg extracts. J Biol Chem. 2001;276:17092–17100.
- Cayrou C, Coulombe P, Vigneron A, et al. Genome-scale analysis of metazoan replication origins reveals their organization in specific but flexible sites defined by conserved features. Genome Res. 2011;21:1438–1449.
- Walter J, Newport JW. Regulation of replicon size in Xenopus egg extracts. Science. 1997;275:993–995.
- Marheineke K, Hyrien O. Control of replication origin density and firing time in Xenopus egg extracts: role of a caffeine-sensitive, ATR-dependent checkpoint. J Biol Chem. 2004;279:28071–28081.
- Guo C, Kumagai A, Schlacher K, et al. Interaction of Chk1 with treslin negatively regulates the initiation of chromosomal DNA replication. Mol Cell. 2015;5:492-505.
- Platel M, Goldar A, Wiggins JM, et al. Tight Chk1 levels control replication cluster activation in Xenopus. PloS One. 2015;10:e0129090.
- Shechter D, Costanzo V, Gautier J. ATR and ATM regulate the timing of DNA replication origin firing. Nat Cell Biol. 2004;6:648–655.
- Collart C, Allen GE, Bradshaw CR, et al. Titration of four replication factors is essential for the Xenopus laevis midblastula transition. Science. 2013;341:893–896.
- Murphy CM, Michael WM. Control of DNA replication by the nucleus/cytoplasm ratio in Xenopus. J Biol Chem. 2013;288:29382–29393.
- Collart C, Christov CP, Smith JC, et al. The midblastula transition defines the onset of Y RNA-dependent DNA replication in Xenopus laevis. Mol Cell Biol. 2011;31:3857–3870.
- Christov CP, Dingwell KS, Skehel M, et al. A NuRD complex from Xenopus laevis eggs is essential for DNA replication during early embryogenesis. Cell Rep. 2018;22:2265–2278.
- Amodeo AA, Jukam D, Straight AF, et al. Histone titration against the genome sets the DNA-to-cytoplasm threshold for the Xenopus midblastula transition. Proc Natl Acad Sci. 2015;112:E1086–E1095.
- Seller CA, O’Farrell PH Rif1 prolongs the embryonic S phase at the Drosophila mid-blastula transition. PLoS Biology. 2018;16:e2005687.
- Landström U, Løvtrup-Rein H, Løvtrup S. Control of cell division and cell differentiation by deoxynucleotides in the early embryo of Xenopus laevis. Cell Differ. 1975;4:313–325.
- Newport J, Dasso M. On the coupling between DNA replication and mitosis. J Cell Sci Suppl. 1989;12:149–160.
- Vastag L, Jorgensen P, Peshkin L, et al. Remodeling of the metabolome during early frog development. PloS One. 2011;6:e16881.
- Frank-Vaillant M, Jessus C, Ozon R, et al. Two distinct mechanisms control the accumulation of Cyclin B1 and Mos in xenopus oocytes in response to progesterone. Mol Biol Cell. 1999;10:3279–3288.
- Sive HL, Grainger RM, Harland RM. Xenopus laevis in vitro fertilization and natural mating methods. CSH Protoc 2007. 2007; pdb.prot4737.
- Nieuwkoop PD, Faber J, editors. Normal table of Xenopus laevis (Daudin): a systematical and chronological survey of the development from the fertilized egg till the end of metamorphosis. New York: Garland Pub; 1994.
- Lemaitre J-M, Géraud G, Méchali M. Dynamics of the genome during early Xenopus laevis development: karyomeres as independent units of replication. J Cell Biol. 1998;142:1159–1166.
- Marheineke K, Goldar A, Krude T, et al. Use of DNA combing to study DNA replication in Xenopus and human cell-free systems. Methods Mol Biol Clifton NJ. 2009;521:575–603.
- Blow JJ, Laskey RA. Initiation of DNA replication in nuclei and purified DNA by a cell-free extract of Xenopus eggs. Cell. 1986;47:577–587.
- Hartley RS, Rempel RE, Maller JL. In vivoregulation of the early embryonic cell cycle inXenopus. Dev Biol. 1996;173:408–419.
- Gotoh T, Kishimoto T, Sible JC. Phosphorylation of Claspin is triggered by the nucleocytoplasmic ratio at the Xenopus laevis midblastula transition. Dev Biol. 2011;353:302–308.
- Shimuta K, Nakajo N, Uto K, et al. Chk1 is activated transiently and targets Cdc25A for degradation at the Xenopus midblastula transition. Embo J. 2002;21:3694–3703.
- Montag M, Spring H, Trendelenburg MF. Structural analysis of the mitotic cycle in pre-gastrula Xenopus embryos. Chromosoma. 1988;96:187–196.
- Duckworth BC, Weaver JS, Ruderman JV. G2 arrest in Xenopus oocytes depends on phosphorylation of cdc25 by protein kinase A. Proc Natl Acad Sci. 2002;99:16794–16799.
- Zhao Y, Haccard O, Wang R, et al. Roles of greatwall kinase in the regulation of Cdc25 phosphatase. Mol Biol Cell. 2008;19:1317–1327.
- Blumenthal AB, Kriegstein HJ, Hogness DS. The units of DNA replication in Drosophila melanogaster chromosomes. Cold Spring Harb Symp Quant Biol. 1974;38:205–223.
- O’Farrell PH, Stumpff J, Tin ST. Embryonic cleavage cycles: how is a mouse like a fly? Curr Biol. 2004;14:R35–45.
- Sasaki T, Sawado T, Yamaguchi M, et al. Specification of regions of DNA replication initiation during embryogenesis in the 65-KilobaseDNApolα-dE2F Locus of Drosophila melanogaster. Mol Cell Biol. 1999;19:547–555.
- Iwao Y, Uchida Y, Ueno S, et al. Midblastula transition (MBT) of the cell cycles in the yolk and pigment granule-free translucent blastomeres obtained from centrifuged Xenopus embryos. Dev Growth Differ. 2005;47:283–294.
- Yang SC-H, Bechhoefer J. How Xenopus laevis embryos replicate reliably: investigating the random-completion problem. Phys Rev E. 2008;78:041917.
- Labit H, Perewoska I, Germe T, et al. DNA replication timing is deterministic at the level of chromosomal domains but stochastic at the level of replicons in Xenopus egg extracts. Nucleic Acids Res. 2008;36:5623–5634.
- Laskey RA. Chromosome replication in early development of Xenopus laevis. J Embryol Exp Morphol. 1985;89:285–296.
- Hiratani I, Leskovar A, Gilbert DM. Differentiation-induced replication-timing changes are restricted to AT-rich/long interspersed nuclear element (LINE)-rich isochores. Proc Natl Acad Sci U S A. 2004;101:16861–16866.
- Hiratani I, Ryba T, Itoh M, et al. Global reorganization of replication domains during embryonic stem cell differentiation. PLoS Biol. 2008;6:e245.
- Siefert JC, Georgescu C, Wren JD, et al. DNA replication timing during development anticipates transcriptional programs and parallels enhancer activation. Genome Res. 2017;;27:1406-1416.
- Shechter D, Nicklay JJ, Chitta RK, et al. Analysis of histones in Xenopus laevis. I. A distinct index of enriched variants and modifications exists in each cell type and is remodeled during developmental transitions. J Biol Chem. 2009;284:1064–1074.
- Wang W-L, Anderson LC, Nicklay JJ, et al. Phosphorylation and arginine methylation mark histone H2A prior to deposition during Xenopus laevis development. Epigenetics Chromatin. 2014;7:22.
- Rodríguez-Martínez M, Pinzón N, Ghommidh C, et al. The gastrula transition reorganizes replication-origin selection in Caenorhabditis elegans. Nat Struct Mol Biol. 2017;24:290–299. http://www.nature.com/doifinder/10.1038/nsmb.3363
- Pourkarimi E, Bellush JM, Whitehouse I. Spatiotemporal coupling and decoupling of gene transcription with DNA replication origins during embryogenesis in C. elegans. eLife. 2016;5:e21728. Internet] 2016 [cited 2018 Apr 10]. 5.
- Blythe SA, Wieschaus EF. Zygotic genome activation triggers the DNA replication checkpoint at the midblastula transition. Cell. 2015;160:1169–1181.
- Mantiero D, Mackenzie A, Donaldson A, et al. Limiting replication initiation factors execute the temporal programme of origin firing in budding yeast. Embo J. 2011;30:4805–4814.
- Anglana M, Apiou F, Bensimon A, et al. Dynamics of DNA replication in mammalian somatic cells: nucleotide pool modulates origin choice and interorigin spacing. Cell. 2003;114:385–394.
- Poli J, Tsaponina O, Crabbé L, et al. dNTP pools determine fork progression and origin usage under replication stress. Embo J. 2012;31:883–894.
- Singh A, Xu Y-J. The cell killing mechanisms of hydroxyurea. Genes (Basel). 2016;7:99.