
ABSTRACT
DNA damage can be generated in multiple ways from genotoxic and physiologic sources. Genotoxic damage is known to disrupt cellular functions and is lethal if not repaired properly. We compare the transcriptional programs activated in response to genotoxic DNA damage induced by ionizing radiation (IR) in abl pre-B cells from mice deficient in DNA damage response (DDR) genes Atm, Mre11, Mdc1, H2ax, 53bp1, and DNA-PKcs. We identified a core IR-specific transcriptional response that occurs in abl pre-B cells from WT mice and compared the response of the other genotypes to the WT response. We also identified genotype specific responses and compared those to each other. The WT response includes many processes involved in lymphocyte development and immune response, as well as responses associated with the molecular mechanisms of cancer, such as TP53 signaling. As expected, there is a range of similarity in transcriptional profiles in comparison to WT cells, with Atm-/- cells being the most different from the core WT DDR and Mre11 hypomorph (Mre11A/A) cells also very dissimilar to WT and other genotypes. For example, NF-kB-related signaling and CD40 signaling are deficient in both Atm-/- and Mre11A/A cells, but present in all other genotypes. In contrast, IR-induced TP53 signaling is seen in the Mre11A/A cells, while these responses are not seen in the Atm-/- cells. By examining the similarities and differences in the signaling pathways in response to IR when specific genes are absent, our results further illustrate the contribution of each gene to the DDR. The microarray gene expression data discussed in this paper have been deposited in NCBI’s Gene Expression Omnibus (GEO) (http://www.ncbi.nlm.nih.gov/geo/) and are accessible under accession number GSE116388.
Introduction
DNA double-strand breaks (DSBs) are generated by endogenous and exogenous sources. One exogenous source of DSB damage is ionizing radiation (IR), which has been shown to disrupt many cellular functions. The response to radiation-induced DNA damage must be detected and repaired rapidly or this damage can lead to detrimental health effects such as cell death or cancer. Upon exposure to DNA damage, multiple highly regulated and complex responses are induced that can regulate cell cycle arrest, chromatin remodeling, DNA repair, or death of the affected cells [Citation1,Citation2]. In mammalian cells, the network of damage responses includes detecting and removing the DNA lesions and allowing the cells to progress and survive without mutations, or elimination of cells that cannot be repaired properly. There are multiple levels at which proteins are involved in this cascade of signaling events that can alter the outcome of the damage-response network, such as sensing the damage, transducing the signal, and mediating or effecting interactions with other molecules [Citation3,Citation4]. Proteins such as those in the MRN complex (MRE11, RAD50 and NBS1) sense the damage and initiate a rapid response [Citation5–Citation7]. A family of serine/threonine kinases, known as phosphatidylinositol 3-kinase-related kinases (PIKKs), are the major transducers of the DNA damage signals, and these activate mediator and effector proteins, which direct and execute functional outcomes in the damage response. Ataxia-telangiectasia mutated (ATM), ataxia-telangiectasia mutated and RAD3-related (ATR), and DNA-dependent protein kinase, catalytic subunit (DNA-PKcs/Prkdc) are PIKKs, ATM being the primary responder to DSBs, which promote the hierarchical accumulation of remodeling and repair factors on the chromatin that surrounds the DSB sites. Beyond the phosphorylation from these kinases and their targets, additional posttranslational modifications such as ubiquitylation [Citation8,Citation9] and sumoylation provide essential information in the complex regulation of the cascade of events in the DNA damage response (DDR) [Citation2,Citation10,Citation11]. Mediators of the response include BRCA1, TP53, TP53-binding protein 1 (53BP1) and mediator of DNA damage checkpoint 1 (MDC1). The variant histone, H2AX, is a downstream target of activated PIKKs, and the phosphorylated form, γ-H2AX, facilitates binding of these proteins to chromatin surrounding the break site. 53BP1, MDC1 and BRCA1 bind without γ-H2AX, but do not remain bound to the DSB site. MDC1 association is dependent on ATM-mediated phosphorylation of histone H2AX, which then facilitates the binding of ubiquitin ligases. 53BP1 binding also depends on accumulation of MDC1 and ubiquitin ligases. The tumor suppressor protein TP53 is highly inducible by IR through direct ATM activation and inhibition of the MDM2 E3 ligase [Citation12]. Once stabilized, TP53 can induce cell cycle arrest, apoptosis, or senescence, depending on the cell type and conditions. TP53 deficiency leads to an increased frequency of homologous recombination (HR) [Citation13] and chromosomal abnormalities in the presence or absence of external genotoxic damage, suggesting TP53 function in maintaining genomic stability under physiological conditions [Citation14,Citation15].
DNA repair can be carried out through the non-homologous end joining pathway (NHEJ) or the HR repair pathway. NHEJ is the predominant method of DSB repair in mammalian cells and occurs throughout the cell cycle, while HR is the preferential method of repair for DSBs formed in S phase. The relative dynamics of the accumulation and competition of different DSB repair proteins at break sites may be an important aspect in determining which pathway will be chosen for an individual replication-associated DSB lesion [Citation16–Citation19]. For example, RNF169, an E3 ubiquitin ligase, negatively regulates the E3 ubiquitin ligase RNF8/RNF168-dependent signaling response to DSBs, thus competing with 53BP1 and RAP80-BRCA1 for recruitment to RNF168-modified chromatin [Citation18]. 53BP1 binding to chromatid breaks blocks HR and promotes NHEJ at the level of resection [Citation20,Citation21]. Thus it may be that by competing with 53BP1 and RAP80 for binding to chromatin near DSBs, RNF169 may function to channel repair to the more error-free HR pathway [Citation18,Citation19].
In developing B cells, NHEJ is particularly important as it is required for the repair of DNA double-strand breaks associated with the normal physiologic Rag endonuclease-associated process of V(D)J recombination, a process important for lymphocyte development. In the cell culture system used in this study, mouse pre-B cells are transformed with v-abl (described in Supplemental Materials and Methods, referred to as abl pre-B from here on). Chen et al. [Citation22] and Klug et al. [Citation23], together, demonstrate that v-ABL protein suppresses NF-kB and REL activity as well as RAG-1 and RAG-2 expression, thus suppressing at least two essential pathways utilized at this light chain gene rearrangement stage of B-cell differentiation. For examination of the RAG-induced breaks associated with recombination, the cells are abl-inactivated using an abl kinase inhibitor, STI571, thus removing the abl “proliferative” signal and allowing increased RAG endonuclease activity (in an Artemis-/- background), as well as the activation of NF-kB as the cells enter an arrest in the G1 phase of the cell cycle. Using this system, we previously examined the RAG endonuclease-induced transcriptional profile of abl pre-B cells in the G1 phase of the cell cycle and identified a core lymphocyte-specific transcriptional response [Citation24] that is common to both this physiologic response and IR-induced genotoxic breaks in the G1 phase of the cell cycle [Citation25]. As described in the latter paper, we found that genotoxic damage induces pathways and genes associated with B-cell activation, increased proliferation, and oxidative stress responses, as well as increased expression of the microRNA miR-155. Alterations in many pathways through transcriptional regulation are known to be involved in the generation of neoplasia, as well as immune disorders, including those just mentioned.
In our current study, we examine the signaling that is activated in the presence of DNA breaks resulting from exposure to ionizing radiation. We first investigated the IR-induced genotoxic DNA damage response in wild type (WT) cycling developing B-cells. These cells normally remain in proliferative growth due to the strong abl signal, causing cells to remain in the lymphocyte differentiation process at the stage of Ig light chain gene rearrangement.
We then examine differences and similarities in the transcriptional response to IR-induced damage in cycling cells that come from mice deficient in different genetic components of DSB DNA damage response (DDR) pathways, including Atm, 53bp1, H2ax, Mdc1, Mre11 and DNA-PKcs/Prkdc (Scid). Atm-/- cells have a deficiency in the major DDR PIKK, ATM, which responds to DNA DSBs and signals in both HR and NHEJ repair pathways, while Scid cells have a deficiency in the NHEJ pathway. MRE11, 53BP1, and MDC1 are important in sensing and mediating the damage response and H2AX is an important component of the DNA damage complex at the site of the DSBs.
Immune defects are a common characteristic for most of these deficient genotypes. Scid, Atm-, H2ax-, Mdc1-, and 53bp1-deficient mice share the characteristic of lymphopenia, though the specific mechanisms or level of deficiency are not always the same [Citation26–Citation28]. One source of lymphopenia is that lymphocyte progenitors cannot complete V(D)J recombination successfully, including the process of NHEJ, causing an absence of or deficiency in mature lymphocytes in those cells. For example, Prkdcscid mice have a specific impairment of differentiation of stem cells into mature lymphocytes, resulting in a severe depletion of lymphoid cells [Citation29]. Abl-transformed pre-B cells from Prkdcscid, Atm-/-, and Mre11A/A mice have been shown to have abnormal rearrangements of immunoglobulin and T cell receptor genes [Citation30–Citation32]. Mice deficient in 53BP1 show defects in class switch recombination (CSR) [Citation33,Citation34], and mice deficient in H2AX were found to have a 50% reduction in B and T lymphocytes, also with defects found in CSR [Citation35]. An MDC1 deficiency results in less severe defects than H2AX or 53BP1 deficiencies [Citation36]. In addition to lymphopenia, a number of these genotypes are prone to lymphomas, including Atm-/- and, to a lesser extent, 53bp1-/- mice [Citation37]. One aspect of the response to DNA damage is the interaction of different proteins involved at the site of a break. There is a considerable amount of information in the published literature on the processes occurring at the DNA damage site, including what happens when defects in each of these genotypes exist [Citation2,Citation9,Citation11,Citation28].
It is a combination of these responses to DNA damage from both physiological and genotoxic sources that generate the phenotypic characteristics associated with deficiencies of each of these genotypes. We examine broad aspects of these processes by comparing the global transcriptional responses to a genotoxic source of DNA damage, IR, in the same cell type from different deficient genotypes under the same conditions. Comparing the responses in these different lines may shed light on the roles of each specific protein and potential redundancies of functionality in the DDR. We couple this with an evaluation of the G2/M checkpoint response, a hallmark response to DNA damage in wild type cells, in order to shed light on the integrity of the genetic network regulating DNA damage responses in developing lymphocytes. Understanding the roles each gene plays in the response could identify potential drug targets for the treatment of neoplasia, lymphopenia and other immune deficiencies in people with mutations of DNA damage response genes.
Materials and methods
Cell lines and culture
Pre-B cell lines were derived from mice that harbored the Eμ-Bcl2 transgene and different gene mutations or no mutation [Citation30] and were v-abl transformed as described in supplemental materials and methods. Cells were maintained in suspension in Dulbecco’s modified Eagle Medium (DMEM), high glucose, (11960–077, Invitrogen, Grand Island, NY) supplemented with 10% fetal bovine serum (12476–024, Invitrogen), 1X Sodium Pyruvate (11360–070, Invitrogen), 1X Non-Essential Amino Acids (11140–050, Invitrogen), 1X L-Glutamine (25030–081, Invitrogen), and 0.0004% β-mercaptoethanol. For IR treatment, logarithmically growing cells plated ~48 hr earlier, were exposed to γ-rays from a Citation1Citation37Cesium source at a rate of 0.72 Gy/min for a final dose of 1 Gy.
G2/M checkpoint assay
For determination of their G2/M DNA damage checkpoint function, cells were collected 2, 4 and 6 hr after exposure to 1 Gy IR and fixed in 70% ethanol for 15 minutes at room temperature, followed by storage at 4°C. For the flow cytometric checkpoint assay, cells were rinsed with PBS, exposed to 0.2% triton X-100 in PBS for 20 minutes on ice, resuspended in 100 μl IFA (10mM HEPES, pH 7.4, 150 nM NaCl, 4% FBS, 0.1% sodium azide) with anti-phospho-histone H3 (Ser 10) (1:25; 9706, Cell Signaling, Danvers, MA) and incubated 2 hr at room temperature, rinsed in IFA, resuspended in 100 μl anti-mouse FITC-conjugated in IFA (1:250; 715-095-151, Jackson Immunological Laboratories, West Grove, PA) and incubated for 30 minutes at room temperature in the dark, rinsed with IFA and stained with Propidium iodide (1:250; P3566, Invitrogen) and RNase (1:250; 1119915, Boehringer Mannheim) in IFA for at least 15 minutes on ice in the dark. Cells were analyzed in a Becton Dickinson FACSort flow cytometer. A reduction of the percentage of cells in mitosis, as quantified by the percentage of cells with phosphorylated histone H3 (pHH3), was used as a measure of G2/M checkpoint function.
RNA isolation
For RNA analysis, cells were collected 2 hr after exposure to 1 Gy IR and flash frozen. For microarray, RNA was isolated using a Qiagen RNeasy kit (Qiagen, Germantown, MD) following the manufacturer’s protocol, including the addition of DNase.
Microarray hybridization and data analysis
Isolated total RNA was submitted to the NIEHS Microarray Core facility for microarray analysis. Gene expression analysis was conducted using Affymetrix Mouse Genome 2.0 GeneChip arrays (Mouse 430 v2). One microgram of total RNA was amplified as directed in the Affymetrix One-Cycle cDNA Synthesis protocol. Fifteen micrograms of amplified biotin-complementary-RNAs were fragmented and hybridized to each array for 16 h at 45°C in a rotating hybridization oven using the Affymetrix Eukaryotic Target Hybridization Controls and protocol. Array slides were stained with streptavidin and phycoerythrin using a double-antibody staining procedure, and then washed using the EukGE-WS2v5 protocol of the Affymetrix Fluidics Station FS450 for antibody amplification. Arrays were scanned in an Affymetrix Scanner 3000 and data was obtained using the GeneChip Operating Software (Version 1.2.0.037). The resulting data were processed and analyzed using Partek Genome Suites (Partek® Genome Suites software, version 6.6beta Copyright © 2009 Partek Inc., St. Louis, MO, USA). Intensity values from the Affymetrix files were imported into Partek separately for each genotype using RMA background correction and Quantile Normalization (3 control and 3 irradiated samples per genotype). To eliminate background low expression variability, all intensity values were floored to 120 and probe sets with no more than 120 in any of the 6 samples were eliminated for that genotype. An analysis of variance (ANOVA) was performed between the control (0 Gy) and irradiated (1 Gy) samples. Associated p-values were generated by Partek to identify differentially expressed probe sets for each genotype. Combined with a fold change ǀFCǀ ≥ 1.5, a p-value of ≤ 0.05 was used to generate a list of differentially expressed probe sets for each genotype.
Pathways analyses
We used two programs to generate pathway information, Ingenuity Pathway Analysis (IPA) (https://www.qiagenbioinformatics.com/products/ingenuity-pathway-analysis) and Gene Set Enrichment Analysis (GSEA) [Citation38]. IPA contains lists of genes for established signaling and metabolic pathways. IPA was used to examine altered canonical pathways based on differential gene expression using pre-determined cutoffs of significance level. Over-representation of a pathway is determined regardless of up- or down-regulation of gene expression within the pathway’s set of genes. For our analysis, the WT genes used to generate data were based on lists generated using FC and p-value significance (1.5 and 0.05), as described above. Pathways were considered significantly over-represented if they had a p-value of ≤ 0.005 (-Log10 ≥ 2.3). GSEA utilizes knowledge-based data sets represented in the GSEA Molecular Signatures Database, MSigDB. MSigDB collections include 8 major categories of gene sets with thousands of sub-collections. We chose to narrow our analyses to curated gene sets from Biocarta, KEGG and Reactome Pathways. GSEA includes genes that may not meet the threshold for statistical significance based on pre-determined criteria, but when acting together, they may have relevant biologic meaning in cellular processes. The gene lists we used for GSEA included all probe sets with an intensity of > 120 in any of the 6 samples for that genotype but without any fold change or p-value limits, resulting in much larger lists than were used for IPA. GSEA calculates enrichment scores, and subsequent statistical significance values (FDR q-value), that reflect ranking of differential expression of genes between, in this study, unirradiated and irradiated microarray-generated data for each genotype and distribution of the gene rank within a GSEA gene set. For our study, pathways were considered significantly enriched if they had a false discovery rate (FDR) q-value of ≤ 0.10. An additional feature of GSEA is that the gene sets are separated into those that are up-regulated or down-regulated following IR based on the direction of expression changes of each probe set. We used both programs for validation of each other from multiple database sources. GSEA added the potential to reveal pathways that might not have significant differential regulation of specific genes but may have relevant biologic meaning in cellular processes when a group of genes is acting together.
Results
Ionizing radiation induces a transcriptional program in WT murine abl pre-B cells that includes cell cycle regulation and immune activation signaling
Utilizing Affymetrix whole mouse genome gene expression microarrays, we collected gene expression data from wild type abl pre-B cells exposed to either 0 Gy (control treatment) or 1Gy of IR. In order to identify significant changes in gene expression after IR-induced DNA damage we utilized a combination of ANOVA generated p-values and fold change cutoffs (p ≤ 0.05; ǀFCǀ ≥ 1.5). We identified 128 probe sets that were significantly changed after IR-induced DNA damage in WT cells (Supplemental Table 1). From the 128 probe sets there were 88 known genes (), each represented by 1 to 3 significantly regulated probe sets. Of these, 58 are induced and 30 are repressed. Using IPA based on the 128 probe sets and GSEA based on 19,711 probe sets, we identified a broad range of pathways that had significant responses to IR-induced genotoxic DNA damage in these WT cells. ) shows some of these over-represented IPA canonical pathways affected, while ) shows some of the 24 enriched GSEA pathway gene sets with genes up-regulated after IR. Supplemental Table 2 shows the 64 IPA significant pathways and the genes associated with each pathway and Supplemental Table 3 shows the 24 enriched GSEA pathway gene sets with the associated genes listed. Due to the different analytical approaches for determining genes associated with the pathways (see Materials and Methods), we see overlapping and distinct genes associated with the significantly enriched/over-represented pathways, as well as overlapping and distinct pathways using these different analytical tools. Combining the two, we discern patterns of transcriptional regulation. An over-riding feature of the significant IPA pathways is up-regulation of NF-kB signaling, from Nfκb2 and Relb, as well as NF-kB inhibitors (Nfκbia, Nfκbib, and Nfκbie). The CD40 signaling pathway is the most significant IPA pathway for WT abl pre-B cells, which includes NF-kB signaling as well as Cd40 and Icam1 transcriptional activation. ICAM1, intercellular adhesion molecule 1, has roles in cell adhesion and viral entry, as well as in signal transduction associated with a pro-inflammatory response to mediators such as cytokines, hormones, and cellular stresses, including those generated by reactive oxygen or nitrogen species. Dendritic Cell Maturation (IPA) is another significant pathway with up-regulation of Icam1, Cd40, Il12a, and Nfκb2 as players in this immune cell maturation process. We see up-regulation of additional genes associated with activation of immune cells, including Swap70, Notch1, and Cd69. In summary, we see transcriptional regulation that is associated with lymphocyte-specific development, maturation, and immunological responses to external stimuli due to exposure to the genotoxic IR-induced DNA damage.
Table 1. 88 Differentially regulated known genes in WT cells 2 hours after exposure to 1 Gy IR, 58 induced and 30 repressed. Values are fold change of gene expression 2 hr after exposure to 1 Gy IR compared to 0 Gy controls based upon 1, 2* or 3^ significant probe sets for a given gene. Values are averaged for the multiple probes if more than 1 probe set was found to be significant. See Supplemental Table 1 for a list of all 128 probe sets
Figure 1. Selected significantly affected signaling pathways over-represented in WT cells exposed to 1 Gy IR. A) A selection of the top Ingenuity Pathways Analysis Canonical Pathways (-log10 (p-value) shown on X axis) that passed a cutoff of p ≤ 0.005 (-log10 ≥ 2.3). B) A selection of the top enhanced GSEA Pathway Gene Sets (FDR q-value ≤ 0.10).
Another strongly represented area of signaling in response to IR is through the transcription factor TP53. We are aware that it has been shown that mutations in Tp53 are involved in a subset of < 50% of abl-transformed pre-B isolates [Citation39]. We have not examined the TP53 status of the abl pre-B cells we use, however, we do see transcriptional profiles that suggest TP53 is activated at the transcriptional level in all genotypes except Atm-/-. In IPA, the TP53 signaling pathway is significantly over-represented and in GSEA the KEGG and Biocarta TP53 pathways are significantly enhanced. Genes significantly up-regulated in these pathways include some that have been associated with cell cycle and checkpoint regulation (p21/Cdkn1a, Mdm2, Ccng1) and apoptosis (Bbc3/Puma, Trp53inp1/Sip, Lrdd/Pidd). Since GSEA includes a broader set of genes, it picks up patterns that would not be detected using only the selected significant genes used for IPA. The GSEA TP53 Signaling Pathways include genes that are up-regulated and affect cell cycle arrest (p21), apoptosis (Bbc3, Ei24/Pig8), DNA repair and damage prevention (Gadd45, Sesn2), and TP53 negative feedback (Mdm2, Ccng1) or localization (Gtse1) (see Supplemental Table 3 for gene list).
As a biological “endpoint” we examined cell cycle checkpoint function. TP53 is involved in control of the G1/S-phase checkpoint [Citation40–Citation43] and the G2/M-phase arrest following IR. TP53 is involved in the G2/M transition, although it is not required for the early G2 checkpoint response [Citation44–Citation50]. The G2/M checkpoint is characterized by an ATM-dependent early response to IR, which can be measured by pHH3, as we did here, and a late response that results in ATM-independent G2/M accumulation. We performed checkpoint analyses and show activation of both G1/S and G2/M checkpoints. shows that following IR, the percentage of cells with phosphorylated histone H3 (pHH3, a measure of cells in mitosis) is reduced to 2.5% of the unirradiated controls at 2 hr, with a release into mitosis evident at 4 hr (66.8% of unirradiated) and full recovery at 6 hr (116.7% of unirradiated). While the G1/S checkpoint generated following this low-dose of IR is not as strong, we see a reduction to 39.2% of the unirradiated cells 8 hr following IR (Supplemental Figure 1). Thus, in agreement with some of the gene expression changes observed, there is checkpoint activation at both G1/S and G2/M in these cells.
Figure 2. G2/M checkpoint response in WT cells exposed to 1 Gy IR: comparison of genotype specific responses to the WT response. Cells were collected 2, 4 and 6 hr after exposure to 1 Gy IR and stained with anti-phospho-histone H3 (Ser 10) to determine the percentage of cells with pHH3 at each time point, indicative of the delay of cells in G2.
Following an investigation of the WT response, we analyzed how disruption of the major signaling proteins and pathways change the DSB response. In order to accomplish that, we treated cells from Atm-/-, 53bp1-/-, H2ax-/-, Mdc1-/-, Mre11A/A, and Scid mice in the same way we treated the WT cells. The same analyses of gene expression changes following IR were performed and comparisons generated of transcriptional changes and associated pathway representation. In addition, checkpoint assays were performed on cells from each of the different genotypes as they were for WT cells.
Checkpoint activation as a biological representation of the IR response of each genotype
As mentioned above, WT abl pre-B cells have a strong G2/M checkpoint at 2 hr, with a return to normal cycling levels of pHH3 by 6 hr following IR. They also have a reduction of cells in early S phase 8 hr following IR that indicates activation of the G1/S checkpoint, though not as strong as the G2/M checkpoint. We examined the G2/M checkpoint function for each of the genotypes and show these responses in . All cells were in logarithmic growth phase at the time of irradiation. The G2/M checkpoint is based on a measure of phosphorylation of histone H3. Low percentage values represent a strong checkpoint. It can be seen in that most genotypes have a strong G2 checkpoint response at 2 hr following IR, with the notable exception of an attenuation in Atm-/- and Mre11A/A cells, and, to a lesser degree, in H2ax-/- cells. What differs from WT cells in all genotypes is the recovery seen at 4 and 6 hours post IR treatment, suggesting unrepaired DNA damage at these later times in all genotypes except WT. Mdc1-/-, Scid and 53bp1-/- cells have very poor reentry into mitosis. H2ax-/- cells have recovered to the level of Mre11A/A and Atm-/- cells by 6 hr but at 4 hr they were still intermediate in their progression into mitosis. From these data it appears that Atm-/- and Mre11A/A cells are most like each other in this G2/M checkpoint response and most dissimilar to WT at 2 hr, H2ax-/- cells are intermediate, and Scid, Mdc1-/- and 53bp1-/- cells are most similar to each other but dissimilar to WT in their recovery. Similar observations have been made by others [Citation51], such as an intact G2/M checkpoint but delayed exit in 53bp1-/- cells [Citation37].
Supplemental Figure 1 shows G1/S checkpoint responses 8 hr following IR. The percentage of cells in early S phase, determined by exposure to BrdU between 6 and 8 hr after IR, was compared between genotypes. The values are percentage of BrdU-positive cells in early S phase after 1 Gy IR/percentage after no irradiation, thus representing a holding of cells at the G1 checkpoint and a clearing from early S at this snapshot in time. Here we see that H2ax-/- and Atm-/- cells have a tendency toward an attenuated G1/S checkpoint as compared to WT cells. The most striking difference from WT is the stronger clearing of early S phase in the Mdc1-/- cells, with an intermediate response of the Scid and 53bp1-/- cells in that direction.
Differences in gene transcription and signaling pathways between the genotypes suggest complex signaling with many redundant pathways
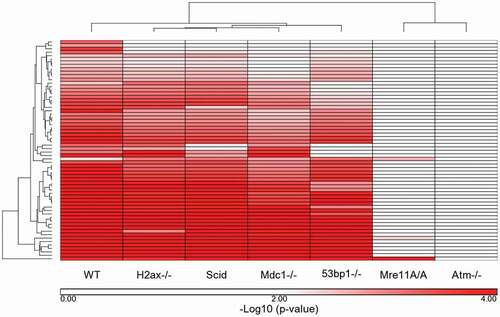
The fold-change values between IR-treated and untreated cells for each genotype for the 128 WT response probes sets were clustered with the WT values (). The clustering pattern from all genotypes is almost identical to that with just the WT probe sets, with the exception of Mre11A/A and Atm-/-, with Mre11A/A intermediate between Atm-/- and the remaining genotypes. Supplemental Table 4 shows the fold change values of the 128 probe sets in all cells in cluster order. Those in bold type are significant by both fold change and p-value. To examine signaling at a broader level, we compared the WT significantly affected IPA pathways to those of each genotype. For this comparison, IPA -log10 (p-values) were determined for each probe set for each genotype based only on the 128 WT probe sets utilizing a 1.5 FC cutoff (regardless of p-value). The 64 pathways determined to be significant at a cutoff of p ≤ 0.005 (-log10 (p-value) ≥ 2.3) in the WT cells were clustered using these genotype-specific generated -log10 (p-values) (). Negative log10 (p-values) are listed in Supplemental Table 5. In this clustering pattern we see a very strong separation of the Mre11A/A and Atm-/- cells from the remaining genotypes, without the intermediate response of the Mre11A/A cells. The reason for this is that the Mre11A/A cells share similarities with the WT cells only in ATM signaling, TP53 signaling, and several Cancer signaling pathways. The remaining WT affected pathways are insignificant, as they are in the Atm-/- cells. The WT cells are separate from the remaining 4 genotypes, H2ax-/-, Scid, Mdc1-/- and 53bp1-/-, which are most similar to each other.
Figure 3. Differentially regulated probe sets in WT cells exposed to 1 Gy IR: comparison of genotype specific responses to the WT response. The fold change values, based on average genotype intensity levels from 1 Gy/0 Gy exposure, were generated and compared to those that were significant in WT cells based on a p-value cutoff of p ≤ 0.05 and a fold change ǀFCǀ ≥ 1.5. The fold change values were hierarchically clustered to determine the similarities and differences between the genotypes based on the 128 significant probe sets of the WT response to IR. Fold change values in this cluster for non-WT genotypes are not necessarily significant for that genotype based on p-value or fold change cutoffs.
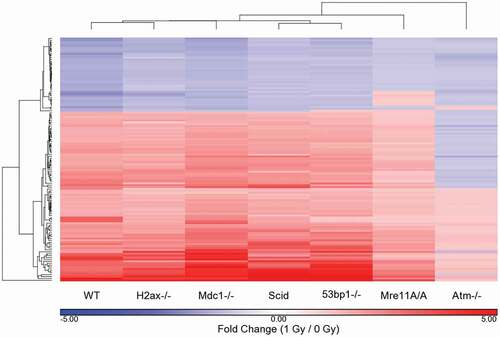
Figure 4. Ingenuity Pathways that met a p-value cutoff of p ≤ 0.005 in WT cells: comparison of WT response to the remaining 6 genotypes. The Ingenuity Canonical Pathway -log10 (p-values) generated for each genotype were compared for the 64 pathways that were significantly over-represented in WT cells based on a p-value of ≤ 0.005 (= -log10 (p-value) of 2.3). The -log10 (p-values) were clustered to determine the similarities and differences between the 7 genotypes based on the WT response to IR.
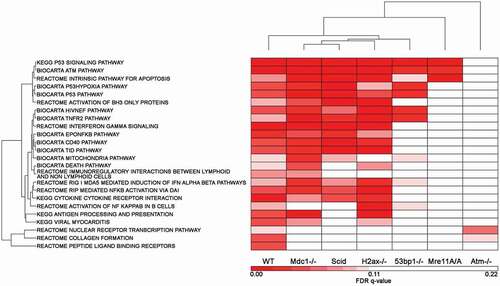
GSEA pathway FDR q-values were determined based on all probe sets that passed a 120 minimum intensity cutoff specifically for each genotype. The 24 GSEA pathways are all the WT Biocarta, KEGG and Reactome pathways determined to be significant at a cutoff of FDR q-value ≤ 0.10. The GSEA generated FDR q-values for each genotype specifically for these 24 pathways were clustered (). The q-values are listed in Supplemental Table 6. In all 3 of these clusters (IR-induced fold change, IPA pathways and GSEA pathways) the genotypes with the most dissimilar response to the WT cells are Atm-/- and Mre11A/A, these being most like one another. The other genotypes are somewhat similar to each other but showing distinct differences from the WT cells in their deficiencies in responding to DNA damage.
Figure 5. Gene Set Enrichment Analysis Pathways that met a FDR q-value cutoff of q ≤ 0.1 in WT cells: comparison of WT response to the remaining 6 genotypes. The GSEA Pathway FDR q-values generated for each genotype were compared for the 24 up-regulated pathways that were significant in WT cells based on a q-value of ≤ 0.1. The q-values of each genotype, each based on their own probe set list, were clustered to determine the similarities and differences between the 7 genotypes based on the WT response to IR.
Ionizing radiation induces a different transcriptional program in each genotype of murine abl pre-B cells
In addition to the above comparisons to the WT cell response, we examined the transcriptional response to IR of each genotype separately to provide insight into signaling that may differ based on the absence of a specific DNA damage response gene in these cultured abl pre-B cells regardless of the WT IR response. We combined all significantly differentially regulated probe sets for all 7 genotypes, a total of 411, and generated a table of fold change values. These were clustered to examine the similarities and differences between the genotypes (Supplemental Figure 2). This gave very similar results to what we saw when clustering the genotypes using just the WT response genes. We also generated a list of Ingenuity Canonical Pathways from each genotype’s own list of differentially regulated probe sets. We then combined each of these 71 IPA pathways that had a significance of at least a -log10 (p-value) of 2.3 in any one of the 7 genotypes. The -log(p-values) were clustered to observe similarities and differences (Supplemental Figure 3 and Supplemental Table 7). It should be noted that the IPA pathway significance values are not necessarily the same when the different size probe sets are analyzed (128 WT only vs. 411 all genotypes).
We also examined GSEA, as we did for the WT genotype, generating a probe set list for each genotype that passed the intensity cutoff of 120. This resulted in probe set lists ranging from 16,845 to 19,711. Significant GSEA gene sets are based on a false discovery rate (FDR) q-value cutoff of q ≤ 0.1. We combined the 85 significant gene sets with up-regulated genes (Supplemental Figure 4(a), Supplemental Table 8) and 15 with down-regulated genes (Supplemental Figure 4(b,c), Supplemental Table 9) from all 7 genotypes.
Using this type of comparison, we can identify particular pathways that may be unique to a specific genotype (). While the fold change of the individual genes in these categories is not statistically significant, there is a group of associated genes that together have a level of altered expression following IR that GSEA found to have a FDR q-value ≤ 0.1. For example, there is a group of categories uniquely up-regulated after IR in the Atm-/- cells that is partially driven by changes in guanine nucleotide binding proteins (G proteins) and adenylate cyclases. Another example appears to be the PI3K-ERBB and PIP3-AKT responses in Mdc1-/- cells. Interestingly, the down-regulation data is driven by cell cycle regulation and progression associated pathways in the Scid cells. Although to a lesser extent, the Mdc1-/- cells share many of the same responses as Scid cells, and the 53bp1-/- cells share the G2/M and Activation of ATR in response to replicative stress categories. We speculate that the down regulation of genes involved in these pathways is related to the poorer release from the G2/M checkpoint and cell cycle progression seen in these 3 cell lines (see ). The 53bp1-/- cells also have unique down-regulation of genes in 3 pathways: B-Cell Receptor Activation by Antigens, HDAC, and RHO GTPase signaling. RHO signaling has been linked to the mitotic phase of cell division [Citation52] and it is possible that this pathway is linked to the extended G2 arrest of the 53bp1-depleted cells, or possibly death of mitotic cells; cause or effect being unknown. The involvement of RHO in the DNA damage response was reviewed in Fritz et al. [Citation53] and RHO inhibition has been studied as a pharmacological target influencing IR-induced toxicity in radiation oncology care [Citation54].
Table 2. Representative signaling pathways over-represented in IPA or with enhanced up- or down-regulated gene sets in GSEA in any one of the genotypes in response to 1 Gy IR. Coding represents a single pathway or may represent an average of -log10 (p-values) or FDR q-values of more than 1 related pathway or gene set, such as KEGG and Biocarta p53 signaling pathways. These are not meant to indicate statistical significance but rather relationships. Coded values in the table are italicized and bold to focus on differences between genotypes. As a reference, negative log10 (p-value) and FDR q-value cutoffs considered statistically significant in this work are bolded
In we provide an overview of some of the global transcriptional responses to IR in the same cell type from different DNA damage response gene-deficient lines under the same conditions to shed light on the integrity of the genetic network regulating DNA damage responses in developing lymphocytes. This table shows genotype specific similar and variable categories of responses based on both IPA and GSEA pathways in any of the 7 cell lines, including some that are unique to one genotype.
Discussion
WT response to IR
We examined whole genome transcriptional changes and checkpoint control in response to IR exposure in WT abl pre-B cells. As seen previously in G1 phase abl pre-B cells, we observed genes that were differentially regulated similarly to those regulated following physiological Rag-induced DSBs. These include a range of genes, such as Cd40, Cd69, Icam1, Swap70, and Nfκb, and pathways related to immune processes [Citation24,Citation25]. Utilizing IPA and GSEA we identified significantly altered immune associated pathways with this DNA damage response. Based on these findings, we see transcriptional regulation that is associated with lymphocyte-specific development, maturation, and immunological responses to external stimuli due to exposure to the genotoxic IR-induced DNA damage.
The regulation of NF-kB signaling, both in the NF-kB family members and their inhibitors, is a strong determinant in a number of the significantly affected pathways. This signaling through a variety of dimeric protein complexes plays a key transcriptional role (activation and repression) in inflammation and development, and incorrect regulation is associated with immune defects, cancer and other chronic diseases. Among the known inducers of NF-kB activity are ionizing radiation, reactive oxygen species (ROS) and bacterial products. We also see up-regulation of several NF-kB inhibitors, Nfκbia, Nfκbib and Nfκbie, which are known to act in a feedback loop to regulate NF-kB expression. The members we see transcriptionally differentially regulated in the abl pre-B cells are primarily Nfκb2 (p100/p52) and Relb. NF-kB signaling has been classified into canonical (p50/RELA and p50/c-REL heterodimers) and non-canonical signaling [Citation55]. The dimerization of p52 with RELB falls into the non-canonical signaling pathway, which has been shown to be linked to canonical NF-kB signaling [Citation56].
CD40 is one of the known NF-kB inducers and can be a stimulating factor in both the canonical or non-canonical signaling pathways. Our data reveal up-regulation of Cd40 in WT cells following exposure to IR with “CD40 Signaling” being the most over-represented IPA pathway. CD40 signaling is known to regulate B-cell activation and differentiation events as well as mediate dendritic cell maturation and antigen presentation. Resulting activation of NF-kB signaling involves post-translational control by the MAP kinase NIK, which regulates p100 processing through phosphorylation and the action of E3 ubiquitin ligases [Citation55,Citation57]. BIRC3 (cIAP2) is one of the ubiquitin ligases involved in the fine-tuning of NF-kB activation and Birc3 is up-regulated in response to IR. Intercellular adhesion molecule-1 (Icam1) is an example of an inflammatory response gene up-regulated following IR exposure and known to be induced by a number of transcription factors, the most important of which is NF-κB. Icam1 is up-regulated in response to a variety of inflammatory mediators and its expression is primarily increased through gene transcription [Citation58]. Lymphotoxin b (LTB) is another inducer of the inflammatory response system and is involved in normal lymphoid tissue development. LTB is regulated by multiple transcription factors, including NF-kB, and this pathway is also up-regulated in response to IR. However, it remains to be determined if there is in fact inducible processing of p100 to p52 in these abl pre-B cells.
We also found strong TP53 activation in multiple TP53-regulated responses: cell cycle arrest (p21), pro- and anti-apoptosis (Lrdd, Bbc3), DNA repair and damage prevention (Sesn2), and its own feedback regulation (Mdm2, Ccng1). Sestrin 2 (SESN2) is an example of a protein involved in protection against oxidative stress [Citation59], a known consequence of IR exposure, and subsequent control of protein synthesis associated with DNA repair following IR-generated DNA damage [Citation60]. Similarly, TP53INP1, a major player in the oxidative stress response, has a TP53-dependent regulatory function that allows for transcription of p21, Sesn2, Bbc3 and Bax, resulting in subsequent G1 cell cycle arrest and ROS detoxification [Citation61].
NF-kB and TP53 are both key transcription factors that mediate responses to cellular stress. They are often thought of as having distinct roles, NF-kB acting for pro-survival and having a prominent role in the immune system, and TP53 associated with death and cell cycle arrest. There are also increasing studies showing cooperative regulation in inflammatory and DNA damage responses. Understanding the interactions is complicated by differences in cell type and study conditions. Our hypothesis was that by comparing the signaling in abl pre-B cells from mice with multiple genetic defects in DNA damage signaling under the same irradiation treatment condition, broader understanding of possible interactions could be gained at a pathway level, thus identifying potential alternative pathways for repair or survival that could play a role in lymphoid diseases and increase our understanding of the underlying molecular mechanisms of these diseases, with the potential for aiding in improving therapeutic strategies.
Comparison of DNA damage responses in abl pre-B cells deficient in various DDR signaling genes to WT response
The most striking difference seen between the 7 genotypes in comparison to each other is the separation of Atm-/- and Mre11A/A cells from the rest. The disease associated with hypomorphic mutations in MRE11 is Ataxia-telangiectasia-like disease (ATLD) [Citation62]. There are similarities in the cellular phenotypes and clinical presentations of A-T and ATLD [Citation62,Citation63], as well as differences, including a more normal TP53 response in ATLD cells [Citation62]. They have in common progressive cerebellar degeneration but differ in that there is an absence of telangiectasias in ATLD and progression of the symptoms is slower. While A-T is characterized by immunodeficiencies, ATLD patients show normal levels of total IgG, IgA and IgM, although patients with ATLD show a measurable immunodeficiency [Citation64]. It has been shown that components of the MRN (including MRE11) complex act both upstream and downstream of ATM in the DNA damage response pathway, explaining the resemblance of the two disorders [Citation7,Citation65]. Cellular characteristics of both mutant cell lines include inappropriate DSBs responses, chromosomal abnormalities, hypersensitivity to IR, radioresistant DNA synthesis, and defective S-phase checkpoint [Citation62]. Because of the rarity of the disorder it is not known if there is an increased risk of developing cancer with ATLD, however Mre11ATLD1 hypomorph mice do not develop lymphomas [Citation66], while Atm-/- mice develop thymic lymphomas and die early from their tumors [Citation67,Citation68]. Studies utilizing Mre11ATLD1 hypomorph mice have provided insight into this very rare disease. Theunissen et al. [Citation66] compared cellular IR-response characteristics of Mre11A/A hypomorph and Atm-/- cells and found many similarities, though generally less severe in Mre11 cells, including trans-rearrangements between TCR ß and γ loci in thymi, G1/S and G2/M phase checkpoint defects in MEF cells, chromosomal abnormalities, and abrogated CHK2 phosphorylation in MEFs and thymocytes. They also found differences, including normal TP53 stabilization and p21 induction in Mre11 cells, whereas TP53 stabilization was reduced in Atm-/- thymocytes compared to WTs [Citation69,Citation70] and apoptotic death of thymocytes was significantly lower in Atm-/- cells than WT cells but close to WT levels in Mre11A/A cells. Taken together, Theunissen et al. show similar, but less severe, defects in Mre11 hypomorph mice compared to Atm-/- mice regarding checkpoint and DNA recombination in response to IR exposure, indicating that the effect of MRE11ATLD1 on ATM activity is incomplete. It is possible that MRE11ATLD1 proteins have some residual functionality that affects ATM activation or that there are activities that depend on ATM but not MRE11. The fact that Mre11ATLD1 hypomorph mice can survive but mice null for MRE11 do not [Citation71] supports the former possibility.
Our data support these findings in that Mre11A/A cells are more similar to Atm-/- cells than the remaining genotypes in G2/M checkpoint function () and transcriptional regulation (Supplemental Table 4), and we see that Atm-/- and Mre11A/A cells are most dissimilar from all other genotypes. In most pathways (Supplemental Tables 5 and 6), the Mre11A/A cells are very similar to the Atm-/- cells. Two exceptions are that the ATM pathway and TP53 pathway are over-represented in all genotypes except Atm-/-, including the Mre11 hypomorphs. A number of pathways are intermediate between Atm-/- and WT cells in the Mre11 hypomorphs, including several cancer signaling pathways and PI3K/AKT signaling. Pathways such as NF-κB and CD40 signaling discriminate Atm-/- and Mre11A/A from the remaining genotypes. Based upon significantly differentially regulated probes from both of these genotypes, neither shows changes in Nfκb or Nfκb inhibitors and NFκB signaling is not significant based on the IPA or GSEA pathway analyses, indicating that ATM and MRE11 are on the same pathway in NF-κB regulation. There is a well-established association of ATM regulation of NF-κB signaling but it has not previously been shown that NF-κB signaling is also MRE11-dependent (in this context).
In a broader overview of the comparison of the remaining genotypes, Scid, Mdc1-/-, 53bp1-/- and H2ax-/-, we see the most similarity to WT cells in H2ax-/- cells at the overall differential regulation of genes, whereas Scid and 53bp1-/- cells are most like each other. In IPA and GSEA pathway analyses these four genotypes are closest to each other, and then to WT cells. Mdc1-/-, Scid, and 53bp1-/- cells have similar G1/S and G2/M checkpoint patterns. As mentioned previously, Cano et al. [Citation61] suggest that TP53 and TRP53INP1 could act synergistically on cell cycle progression by inducing a G1 checkpoint, and to delay S-phase progression. Significant up-regulation of Trp53inp1 and Sesn2 is seen in WT cells, as well as a very similar or greater fold change in Scid, 53bp1-/- and Mdc1-/- cells following IR. It may be possible that the increased Trp53inp1 expression is associated with the G1 arrest equivalent to or stronger than WT cells seen in these 3 cell lines.
Comparison of DNA damage responses in abl pre-B cells deficient in various DDR signaling genes to each other and WT
We also compared significantly differentially regulated gene expression changes from all 7 genotypes (Supplemental Figure 2) to examine signaling that is based on the absence of any of the DNA damage response genes as well as the WT response. This expanded the differentially regulated probe sets from 128 to 411, resulting in changes in IPA and GSEA pathway results. Like the hierarchical cluster of all 7 genotypes comparing expression of the genes differentially regulated in WT cells (), Atm-/- and Mre11 hypomorph cells are most dissimilar to the remaining genotypes, WT and H2ax-/- cells are most similar, and 53bp1-/-, Mdc1-/-, and Scid cells are intermediate. This is the same pattern seen with the IPA Pathways hierarchical cluster (Supplemental Figure 3). In an overall comparison of the GSEA significant pathways we see many pathways affected in other cells lines that are not seen in the WT cells (Supplemental Figure 4(a) for pathways with up-regulated genes and 4(b) for pathways with down-regulated genes, both showing the visual cutoff at FDR q-value of 0.1, which is the level of significance in our evaluations). This is most obvious in the Scid cells, particularly in GSEA pathways down regulated after IR. Supplemental Figure 4(c) shows the visual cutoff of 0.25 for easier comparison of the genotypes. DNA-PK is critical in replication and the pathways we see down-regulated are cell cycle associated pathways, in agreement with our G1/S and G2/M checkpoint results. Mdc1-/- cells have a similar pattern, although not statistically significant in most of the pathways (Supplemental Figure 4(c)). Both of these cell lines appear to “shut down” and not be progressing through the cell cycle ( and Supplemental Figure 1). As discussed above, these associations are similar to observations made when comparing Scid, Mdc1-/- and 53bp1-/- cells to WT cells, possibly because these genotypes share intact ATM signaling in response to unrepaired DNA breaks, resulting in cessation of cell cycle progression at multiple phases of the cell cycle.
In summary, we have examined transcriptional responses and cell cycle checkpoint responses to IR in cell lines lacking functional DNA damage response genes and have shown a range of differences in comparison to the WT response. This demonstrates the complexity of the interactions of key DNA damage response proteins in responding to DNA breaks. Further studies evaluating genotype-specific translational and post-translational events associated with these transcriptional profiles will be needed to expand knowledge of the complex DNA damage response. Understanding the potential alternative pathways utilized by cells with these mutations that allow them to continue to survive, despite a potentially lethal amount of damage, could provide additional understanding to the complex phenotypes of lymphopenia and immunosuppression.
Contributions
CLI participated in the conception and design of this project, carried out experiments, analyzed and interpreted the microarray data, and co-drafted the manuscript. JEH assisted in pathway and functional interpretation of the microarray data. AJM, BAH and BPS performed primary characterization and growth of the cell lines and provided significant scientific information on growing them. BPS made substantial contributions to the conception and design of the project. RSP participated in the conception and design of the project, in the interpretation of the data and in the writing and revising of the manuscript. SHS contributed to revising the manuscript.
Supplemental Material
Download Zip (1.9 MB)Disclosure statement
No potential conflict of interest was reported by the authors..
Supplementary material
Supplemental data for this article can be accessed here.
Additional information
Funding
Related Research Data
References
- Bartek J, Lukas J. DNA damage checkpoints: from initiation to recovery or adaptation. Curr Opin Cell Biol. 2007;19:238–245.
- Bohgaki T, Bohgaki M, Hakem R. DNA double-strand break signaling and human disorders. Genome Integr. 2010;1:15.
- Petrini JH, Stracker TH. The cellular response to DNA double-strand breaks: defining the sensors and mediators. Trends Cell Biol. 2003;13:458–462.
- Shiloh Y. ATM and related protein kinases: safeguarding genome integrity. Nat Rev Cancer. 2003;3:155–168.
- Carson CT, Schwartz RA, Stracker TH, et al. The Mre11 complex is required for ATM activation and the G2/M checkpoint. Embo J. 2003;22:6610–6620.
- Williams RS, Williams JS, Tainer JA. Mre11-Rad50-Nbs1 is a keystone complex connecting DNA repair machinery, double-strand break signaling, and the chromatin template. Biochem Cell Biol. 2007;85:509–520.
- Uziel T, Lerenthal Y, Moyal L, et al. Requirement of the MRN complex for ATM activation by DNA damage. Embo J. 2003;22:5612–5621.
- Al-Hakim A, Escribano-Diaz C, Landry MC, et al. The ubiquitous role of ubiquitin in the DNA damage response. DNA Repair (Amst). 2010;9:1229–1240.
- Uckelmann M, Sixma TK. Histone ubiquitination in the DNA damage response. DNA Repair (Amst). 2017;56:92–101.
- Kouzarides T. Chromatin modifications and their function. Cell. 2007;128:693–705.
- Dantuma NP, van Attikum H. Spatiotemporal regulation of posttranslational modifications in the DNA damage response. Embo J. 2016;35:6–23.
- Khosravi R, Maya R, Gottlieb T, et al. Rapid ATM-dependent phosphorylation of MDM2 precedes p53 accumulation in response to DNA damage. Proc Natl Acad Sci U S A. 1999;96:14973–14977.
- Bishop AJR, Schiestl RH. Role of homologous recombination in carcinogenesis. Exp Mol Pathol. 2003;74:94–105.
- Bischoff FZ, Yim SO, Pathak S, et al. Spontaneous abnormalities in normal fibroblasts from patients with Li-Fraumeni cancer syndrome - aneuploidy and immortalization. Cancer Res. 1990;50:7979–7984.
- Bouffler SD, Kemp CJ, Balmain A, et al. Spontaneous and ionizing radiation-induced chromosomal-abnormalities in P53-deficient mice. Cancer Res. 1995;55:3883–3889.
- Sonoda E, Hochegger H, Saberi A, et al. Differential usage of non-homologous end-joining and homologous recombination in double strand break repair. DNA Repair (Amst). 2006;5:1021–1029.
- Shrivastav M, De Haro LP, Nickoloff JA. Regulation of DNA double-strand break repair pathway choice. Cell Res. 2008;18:134–147.
- Poulsen M, Lukas C, Lukas J, et al. Human RNF169 is a negative regulator of the ubiquitin-dependent response to DNA double-strand breaks. J Cell Biol. 2012;197:189–199.
- Kakarougkas A, Jeggo PA. DNA DSB repair pathway choice: an orchestrated handover mechanism. Br J Radiol. 2014;87:20130685.
- Bunting SF, Callen E, Wong N, et al. 53BP1 inhibits homologous recombination in brca1-deficient cells by blocking resection of DNA Breaks. Cell. 2010;141:243–254.
- Zimmermann M, de Lange T. 53BP1: pro choice in DNA repair. Trends Cell Biol. 2014;24:108–117.
- Chen YY, Wang LC, Huang MS, et al. An active V-Abl protein-tyrosine kinase blocks immunoglobulin light-chain gene rearrangement. Genes Dev. 1994;8:688–697.
- Klug CA, Gerety SJ, Shah PC, et al. The v-abl tyrosine kinase negatively regulates NF-kappa B/Rel factors and blocks kappa gene transcription in pre-B lymphocytes. Genes Dev. 1994;8:678–687.
- Bredemeyer AL, Helmink BA, Innes CL, et al. DNA double-strand breaks activate a multi-functional genetic program in developing lymphocytes. Nature. 2008;456:819–823.
- Innes CL, Hesse JE, Palii SS, et al. DNA damage activates a complex transcriptional response in murine lymphocytes that includes both physiological and cancer-predisposition programs. BMC Genomics. 2013;14:163–172.
- Matei IR, Gladdy RA, Nutter LM, et al. ATM deficiency disrupts Tcra locus integrity and the maturation of CD4+CD8+ thymocytes. Blood. 2007;109:1887–1896.
- Bosma MJ, Carroll AM. The scid mouse mutant - definition, characterization, and potential uses. Annu Rev Immunol. 1991;9:323–350.
- Difilippantonio S, Gapud E, Wong N, et al. 53BP1 facilitates long-range DNA end-joining during V(D)J recombination. Nature. 2008;456:529–533.
- Dorshkind K, Keller GM, Phillips RA, et al. Functional status of cells from lymphoid and myeloid tissues in mice with severe combined immunodeficiency disease. J Immunol. 1984;132:1804–1808.
- Bredemeyer AL, Sharma GG, Huang CY, et al. ATM stabilizes DNA double-strand-break complexes during V(D)J recombination. Nature. 2006;442:466–470.
- Helmink BA, Bredemeyer AL, Lee BS, et al. MRN complex function in the repair of chromosomal Rag-mediated DNA double-strand breaks. J Exp Med. 2009;206:669–679.
- Gapud EJ, Dorsett Y, Yin B, et al. Ataxia telangiectasia mutated (Atm) and DNA-PKcs kinases have overlapping activities during chromosomal signal joint formation. Proc Natl Acad Sci U S A. 2011;108:2022–2027.
- Ward IM, Reina-San-Martin B, Olaru A, et al. 53BP1 is required for class switch recombination. J Cell Biol. 2004;165:459–464.
- Manis JP, Morales JC, Xia ZF, et al. 53BP1 links DNA damage-response pathways to immunoglobulin heavy chain class-switch recombination. Nat Immunol. 2004;5:481–487.
- Celeste A, Petersen S, Romanienko PJ, et al. Genomic instability in mice lacking histone H2AX. Science. 2002;296:922–927.
- Lou ZK, Minter-Dykhouse K, Franco S, et al. MDC1 maintains genomic stability by participating in the amplification of ATM-dependent DNA damage signals. Mol Cell. 2006;21:187–200.
- Ward IM, Minn K, Van Deursen J, et al. p53 binding protein 53BP1 is required for DNA damage responses and tumor suppression in mice. Mol Cell Biol. 2003;23:2556–2563.
- Subramanian A, Tamayo P, Mootha VK, et al. Gene set enrichment analysis: A knowledge-based approach for interpreting genome-wide expression profiles. Proc Natl Acad Sci U S A. 2005;102:15545–15550.
- Thome KC, Radfar A, Rosenberg N. Mutation of Tp53 contributes to the malignant phenotype of Abelson virus-transformed lymphoid cells. J Virol. 1997;71:8149–8156.
- Kastan MB, Zhan Q, el-Deiry WS, et al. A mammalian cell cycle checkpoint pathway utilizing p53 and GADD45 is defective in ataxia-telangiectasia. Cell. 1992;71:587–597.
- Kuerbitz SJ, Plunkett BS, Walsh WV, et al. Wild-type P53 Is a cell-cycle checkpoint determinant following irradiation. Proc Natl Acad Sci U S A. 1992;89:7491–7495.
- Dulic V, Kaufmann WK, Wilson SJ, et al. P53-dependent inhibition of cyclin-dependent kinase-activities in human fibroblasts during radiation-induced G1 arrest. Cell. 1994;76:1013–1023.
- Agarwal ML, Agarwal A, Taylor WR, et al. P53 controls both the G(2)/M and the G(1) cell-cycle checkpoints and mediates reversible growth arrest in human fibroblasts. Proc Natl Acad Sci U S A. 1995;92:8493–8497.
- Stark GR, Taylor WR. Control of the G(2)/M transition. Mol Biotechnol. 2006;32:227–248.
- Kimura SH, Ikawa M, Ito A, et al. Cyclin G1 is involved in G2/M arrest in response to DNA damage and in growth control after damage recovery. Oncogene. 2001;20:3290–3300.
- Paules RS, Levedakou EN, Wilson SJ, et al. Defective G(2) checkpoint function in cells from individuals with familial cancer syndromes. Cancer Res. 1995;55:1763–1773.
- Bunz F, Dutriaux A, Lengauer C, et al. Requirement for p53 and p21 to sustain G(2) arrest after DNA damage. Science. 1998;282:1497–1501.
- Xu B, Kim ST, Lim DS, et al. Two molecularly distinct G(2)/M checkpoints are induced by ionizing irradiation. Mol Cell Biol. 2002;22:1049–1059.
- Chung JH, Bunz F. Cdk2 Is required for p53-independent G(2)/M checkpoint control. Plos Genet. 2010;6:e1000863.
- Landsverk KS, Patzke S, Rein ID, et al. Three independent mechanisms for arrest in G(2) after ionizing radiation. Cell Cycle. 2011;10:819–829.
- Fernandez-Capetillo O, Chen HT, Celeste A, et al. DNA damage-induced G(2)-M checkpoint activation by histone H2AX and 53BP1. Nat Cell Biol. 2002;4:993–997.
- Narumiya S, Yasuda S. Rho GTPases in animal cell mitosis. Curr Opin Cell Biol. 2006;18:199–205.
- Fritz G, Henninger C. Rho GTPases: novel players in the regulation of the DNA damage response? Biomolecules. 2015;5:2417–2434.
- Ziegler V, Henninger C, Simiantonakis I, et al. Rho inhibition by lovastatin affects apoptosis and DSB repair of primary human lung cells in vitro and lung tissue in vivo following fractionated irradiation. Cell Death Dis. 2017;8:e2978.
- Beinke S, Ley SC. Functions of NF-kappa B1 and NF-kappa B2 in immune cell biology. Biochem J. 2004;382:393–409.
- Basak S, Shih VFS, Hoffmann A. Generation and activation of multiple dimeric transcription factors within the NF-kappa B signaling system. Mol Cell Biol. 2008;28:3139–3150.
- Sun SC. Non-canonical NF-kappa B signaling pathway. Cell Res. 2011;21:71–85.
- Roebuck KA, Finnegan A. Regulation of intercellular adhesion molecule-1 (CD54) gene expression. J Leukocyte Biol. 1999;66:876–888.
- Budanov AV, Sablina AA, Feinstein E, et al. Regeneration of peroxiredoxins by p53-regulated sestrins, homologs of bacterial AhpD. Science. 2004;304:596–600.
- Braunstein S, Badura ML, Xi QR, et al. Regulation of protein synthesis by ionizing radiation. Mol Cell Biol. 2009;29:5645–5656.
- Cano CE, Gommeaux J, Pietri S, et al. Tumor protein 53-induced nuclear protein 1 is a major mediator of p53 antioxidant function. Cancer Res. 2009;69:219–226.
- Stewart GS, Maser RS, Stankovic T, et al. The DNA double-strand break repair gene hMRE11 is mutated in individuals with an ataxia-telangiectasia-like disorder. Cell. 1999;99:577–587.
- Costanzo V, Paull T, Gottesman M, et al. Mre11 assembles linear DNA fragments into DNA damage signaling complexes. PLoS Biol. 2004;2:600–609.
- Taylor AMR, Groom A, Byrd PJ. Ataxia-telangiectasia-like disorder (ATLD) - its clinical presentation and molecular basis. DNA Repair (Amst). 2004;3:1219–1225.
- Stracker TH, Petrini JHJ. Working together and apart The twisted relationship of the Mre11 complex and Chk2 in apoptosis and tumor suppression. Cell Cycle. 2008;7:3618–3621.
- Theunissen JWF, Kaplan MI, Hunt PA, et al. Checkpoint failure and chromosomal instability without lymphomagenesis in Mre11(ATLD1/ATLD1) mice. Mol Cell. 2003;12:1511–1523.
- Barlow C, Hirotsune S, Paylor R, et al. Atm-deficient mice: A paradigm of ataxia telangiectasia. Cell. 1996;86:159–171.
- Xu Y, Ashley T, Brainerd EE, et al. Targeted disruption of ATM leads to growth retardation, chromosomal fragmentation during meiosis, immune defects, and thymic lymphoma. Genes Dev. 1996;10:2411–2422.
- Xu Y, Yang EM, Brugarolas J, et al. Involvement of p53 and p21 in cellular defects and tumorigenesis in Atm-/- mice. Mol Cell Biol. 1998;18:4385–4390.
- Barlow C, Brown KD, Deng CX, et al. Atm selectively regulates distinct p53-dependent cell-cycle checkpoint and apoptotic pathways. Nat Genet. 1997;17:453–456.
- Xiao Y, Weaver DT. Conditional gene targeted deletion by Cre recombinase demonstrates the requirement for the double-strand break repair Mre11 protein in murine embryonic stem cells. Nucleic Acids Res. 1997;25:2985–2991.