
ABSTRACT
In recent years, studies have revealed HOXA2 as a new oncogene, but its function is unknown in gliomas. We aimed to reveal the relationship between HOXA2 and glioma based on the Chinese Glioma Genome Atlas(CGGA) and the cancer genome atlas (TCGA). HOXA2 expression data and clinically relevant information of glioma patients were obtained from the CGGA and TCGA containing 1447 glioma tissues and five non-tumor brain tissues. The Wilcox or Kruskal tests were used to detect the correlation between the HOXA2 expression level and clinical data of glioma patients. the Kaplan–Meier method were used to examine the relationship between HOXA2 and overall patient survival. Gene set enrichment analysis (GSEA) was conducted to indirectly reveal the signaling pathways involved in HOXA2, and RT-PCR was used to detect HOXA2 expression in gliomas and non-tumor brain tissues. High HOXA2 expression was found to be positively correlated with clinical grade, histological type, age, and tumor recurrence, but negatively correlated with 1p19 codeletion and isocitrate dehydrogenase mutation status.RT-PCR results showed that HOXA2 expression levels were significantly higher in tumor tissues than in non-tumor brain tissues. GSEA showed that HOXA2 promoted the activation of the activation of the JAK-STAT-signaling pathway, focal adhesion, cell-adhesion-molecules-CAMS pathway, cytosolic DNA sensing pathway, and natural killer cell-mediated cytotoxicity. This study revealed for the first time that the novel oncogene,HOXA2, leads to poor prognosis in gliomas, and can be used as a biomarker for the diagnosis and treatment of gliomas.
Introduction
Annually, there are 100,000 newly diagnosed glioma patients worldwide [Citation1]. Although the proportion of new cancer patients with glioma is less than 1% per year, it has higher mortality and disability rates [Citation2]. Glioma diagnosis mainly depends on imaging examinations, such as computed tomography (CT) scans and magnetic resonance imaging (MRI), and the treatment mainly relies on surgical resection and adjuvant radiotherapy and chemotherapy [Citation3]. In recent years, some new treatments, such as immunotherapy [Citation4] and photodynamic therapy [Citation5], have been adopted. However, its prognosis is still unsatisfactory, possibly due to the absence of an effective diagnostic and therapeutic target.
Currently, gliomas already have several biomarkers for diagnosis and treatment. The main function of O-6-methylguanine-DNA methyltransferase (MGMT) is to protect DNA from damage, thereby lowering the apoptotic rate of cancer cells; hence, loss of MGMT can enhance the chemotherapeutic effect of temozolomide on glioma [Citation6,Citation7]. Abnormally high expression of the epidermal growth factor receptor (EGFR) is often released in high-grade gliomas, which can be involved in cell proliferation, migration, and tumorigenesis. Additionally, EGFR can be associated with poor glioma prognosis [Citation8,Citation9]. The telomerase reverse transcriptase-encoding gene has been reported in all grades of gliomas, and its abnormally high expression can lead to an increase in the incidence of glioma [Citation10]. CHI3L1 expression increased significantly in glioma compared with normal brain tissue and can be used as an indicator of poor prognosis in glioma patients [Citation11]. There are also several glioma biomarkers, such as TP53, PTEN, 1p/19q co-deletion, and IDH mutant [Citation7,Citation12–Citation14]. Although there are several target biomarkers for glioma diagnosis and treatment, gliomas often occur due to a variety of factors, as one factor alone cannot be decisive. Hence, the search for new biomarkers is urgent toward a better understanding of the development and prognosis of glioma.
The basic features of malignant tumors include malignant progression and metastasis due in part to the abnormal regulation of cell division, differentiation, and migration during embryonic development [Citation15]. The Hox gene is a family that can be translated into transcription factors, which transmit location information to early embryos of many species and play a crucial role in controlling the organization of embryonic tissues [Citation16]. In recent years, a large number of articles have reported that the HOX gene is responsible for embryonic development and closely related to the pathogenesis of cancer [Citation17]. For example, abnormally high expression of the HOXA4 and HOXA9 genes can influence the self-renewal and proliferation of colon cancer stem cells to promote tumorigenesis [Citation18]. the abnormally high expression of HOXB13 can significantly reduce the overall survival (OS) rate of colorectal cancer patients [Citation19]. Further, the HOXA2 gene is involved in the process of malignant progression of tumors, such as in oral dysplasia, squamous cell carcinoma tissues, nasopharyngeal carcinoma, pancreatic cancer, and prostate cancer [Citation20–Citation23]. It is worth emphasizing that HOXA2 is a new oncogene that has not been reported in glioma to our knowledge.
Therefore, this study attempts to reveal the relationship between the expression level of HOXA2 and the clinical characteristics of glioma patients through big data analysis. How HOXA2 as a novel oncogene was involved in the pathological process of glioma. Therefore, we have reason to believe that this study will provide a perspective to reveal the pathogenesis of glioma and provide a potential target for diagnosis and treatment.
Materials and methods
Data collection
mRNA sequencing data and clinical information of the 1018 glioma samples were obtained from the CGGA (http://www.cgga.org.cn/) database. Finally, 749 glioma samples were selected for further analysis, following the exclusion of samples due to clinical information-related missing data, such as grade, age, OS, survival status, radio-status, and chemo-status. Transcriptome profiling data of five non-tumor brain tissues and 698 glioma tissues (Workflow Type: HTSeq-FPKM) were obtained from TCGA database (https://portal.gdc.cancer.gov/) and the corresponding clinical information is also available on the official TCGA website. HOXA2 expression levels in eight glioma and five non-tumor brain tissues, which had been collected in the operating room and stored in liquid nitrogen and then at −80°C until use, were determined via RT-PCR Procedures of this work were approved by Ethics Committee of Henan Provincial People’s Hospital. The use of patient samples conformed to the declaration of Helsinki.
GSEA analysis of HOXA2
GSEA is a well-known bioinformatics tool that can indirectly explain the function of a target gene. First, the mRNA sequencing data downloaded from the CGGA database was subjected to batch correction and normalization using the SVA and limma packages, and then divided into high and low expression groups based on the HOXA2 expression level. The GSEA 3.0.jar software was applied for enrichment analysis, the number of permutations was set to 1000 times, and “KEGG cell signaling pathways” was selected as the gene sets database.
RNA isolation and reverse transcription-quantitative polymerase chain reaction (RT-qPCR) analysis
Total RNA was extracted from the tissue samples using Tri®-Reagent (Sigma, USA), and the RNA quality was tested via a NanoDrop One spectrophotometer (Thermo Fisher Scientific, USA). The Transcriptor First Stand cDNA Synthesis Kit (Roche, USA) was used to convert total RNA to cDNA, and the FastStart Universal SYBR® Green Master (ROX) (Roche, Germany) was used for RT-qPCR. The internal reference was GAPDH with primer sequences,5ʹ-CAAGGTCATCCATGACAACTTTG-3ʹ(F) and 5ʹ-GTCCACCACCCTGTTGC TGTAG-3ʹ (R). The primer sequence for HOXA2 was 5ʹ‐GCGCCTGAGAACTGCTTACA‐3ʹ (F) and 5ʹ‐TGTGCTTCATCCTCCGGTTC ‐3ʹ (R). HOXA2 expression was calculated using the -ΔCT method, and validated via an unpaired t-test and a P-value <0.05.
Statistical analysis
Statistical analysis was performed using R (v.3.6.1 version). HOXA2 expression in the glioma and non-tumor brain tissues was determined using the Wilcox test. Cox regression and the Kaplan–Meier method were used to examine the relationship between HOXA2 expression levels and patient OS, and to plot survival curves. Wilcox or Kruskal tests were used to detect the relationship between clinically relevant information in glioma patients and HOXA2 expression.
Results
Characteristics of the study population
A total of 749 clinically available glioma patient sample data were obtained from the CGGA database, including general clinical data, such as age, gender, and pathological diagnosis, and glioma sample grading. Additionally, postoperative radiotherapy or chemotherapy follow-up, and IDH mutation and 1p19 codeletion data are included. Detailed clinical information classification and percentages are shown in Table S1.
The relationship between HOXA2 expression levels and the clinical characteristics of glioma patients
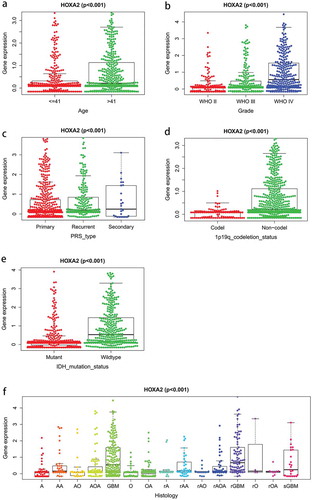
Following the Wilcox or Kruskal test, the HOXA2 expression was found to increase with increasing tumor grade (p < 0.001; a-f). Based on the type of tumor onset, HOXA2 expression was significantly higher in recurrent and secondary glioma cases than in primary glioma (p < 0.001). Patients aged >41 years had significantly higher levels of HOXA2 expression than patients <41 years of age (p < 0.001). HOXA2 expression was significantly reduced in the 1p19 codeletion and IDH mutants compared to non-1p19 codeletion (p < 0.001) and wildtype (p < 0.001), respectively. Additionally, tumor histology showed there was a significant increase in HOXA2 expression levels in GBM and relapsed GBM groups.
Figure 1. HOXA2 expression in glioma. Association with expression and clinicopathologic characteristics, including a: Age, b: Grade, c: PRS_type, d: 1p19q_codeletion status, e: IDH mutation status f: Histology.
Survival outcomes and diagnostic values of HOXA2 in glioma patients
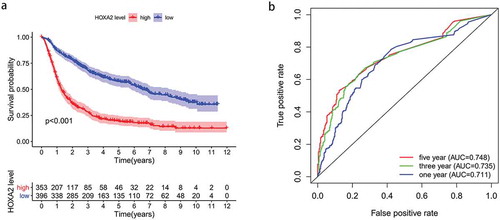
The Kaplan-Meier survival analysis showed that the prognosis of the HOXA2 high expression group was significantly worse than that of the HOXA2 low expression group, indicating HOXA2 that is an oncogene (). The ROC curve was adopted to further demonstrate the diagnostic value of HOXA2 in . The area under the curve was greater than 0.7 in years 1, 3 and 5, which means that the HOXA2 expression level had a modest diagnostic value.
Figure 2. The Kaplan-Meier survival curve and The ROC curve. a: High expression of HOXA2 leads to poor overall survival in glioma patients. b: The ROC curve show good diagnosis value of HOXA2 expression in glioma.
High expression of HOXA2 is an independent risk factor for glioma patients
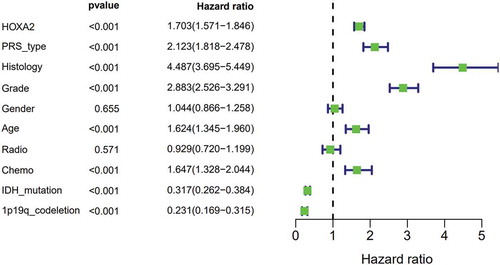
Univariate analysis showed that high expression of HOXA2 () resulted in poor prognosis in patients with glioma (p < 0.001, hazard ratio [HR] = 1.703(95%CI[1.571–1.846])), recurrent cases (p < 0.001, [HR] = 2.123(95%CI[1.818–2.478])), higher histology (p < 0.001, [HR] = 4.487(95%CI[3.695–5.449])), higher grade (p < 0.001, [HR] = 2.883(95%CI[2.526–3.291])), advanced age (p < 0.001, [HR] = 1.624(95%CI[1.345–1.960])), chemotherapy (p < 0.001, [HR] = 1.647(95%CI[1.328–2.044])), IDH-mutation status (p < 0.001, [HR] = 0.317(95%CI[0.262–0.384])), and 1p19q-codeletion status (p < 0.001, [HR] = 0. 231(95%CI[0.169–0.315])).
Figure 3. Univariate regression of prognostic in patients with glioma.
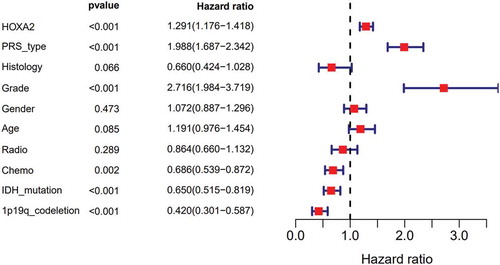
Subsequent multivariate analysis() was used for further analysis using the Cox regression model. HOXA2 expression in relation to general cases (p < 0.001, [HR] = 1.291(95%CI[1.176–1.418])), recurrent cases (p < 0.001, [HR] = 1.988(95%CI[1.687–2.342])), higher grade tumor (p < 0.001, [HR] = 2.716(95%CI[1.984–3.719])), chemotherapy (p = 0.002, [HR] = 0.686(95%CI[0.539–0.872])), IDH-mutation status (p < 0.001, [HR] = 0.650(95%CI[0.515–0.819])), and 1p19q-codeletion status (p < 0.001, [HR] = 0. 420(95%CI[0.301–0.587])) of glioma patients were determined as independent correlations (). The above data suggest that HOXA2 can be used as a diagnostic factor and that patient prognoses may deteriorate as HOXA2 expression increases.
Figure 4. Multivariate survival model of prognostic in patients with glioma.
The HOXA2-related cellular signaling pathway was indirectly explained by GSEA
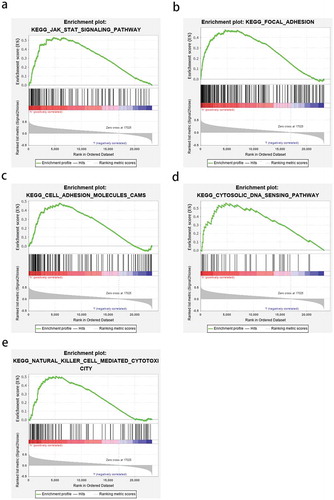
GSEA was used to elucidate the cancer-related pathways in which HOXA2 may be involved between high and low expression groups. A nominal p-value <0.05 is considered to be a meaningful KEGG cell pathway enrichment analysis. Among them, the JAK-STAT-signaling pathway, focal adhesion, cell-adhesion-molecules-CAMS pathway, cytosolic DNA sensing pathway, and natural killer cell-mediated cytotoxicity showed significant differential enrichment analysis in the HOXA2 high expression phenotype group (, ). The above results indicate that as an oncogene, HOXA2 may be involved in the pathogenesis of glioma via these cellular signaling pathways.
Table 1. The gene set enriches the high HOXA2 expression phenotype.
Figure 5. Enrichment plots from GSEA. a:JAK-STAT-signaling pathway; b:focal adhesion; c:cell-adhesion-molecules-CAMS pathway; d:cytosolic DNA sensing pathway; e:natural killer cell-mediated cytotoxicity.
Verifying the reliability of the HOXA2 analyses
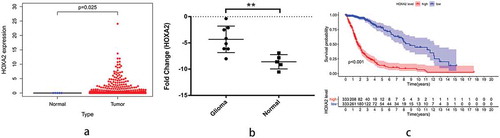
In order to test the credibility of our analyses, we obtained five non-tumor brain and 698 glioma tissues from TCGA to further detect the expression level of HOXA2, and found that the HOXA2 expression increased significantly in glioma (). Additionally, RT-PCR detection of HOXA2 expression in eight glioblastoma and five non-tumor brain tissues showed a significant increase in HOXA2 expression in tumor tissues (). We further downloaded the survival time and status of glioma patients from TCGA database for comparison and the Kaplan–Meier method confirmed that high HOXA2 expression can indeed lead to poor prognosis in glioma patients ().
Figure 6. TGCA database verification survival analysis and RT-qPCR verification results.a: The diff figure showed that the HOXA2 expression increased significantly in glioma; b: The Kaplan-Meier curve based on TCGA database show that high expression of HOXA2 can lead to poor prognosis in patients with glioma. c: The results of PCR verification showed that HOXA2 was highly expressed in glioma patients.
Discussion
Currently, there are several reports of the involvement of HOXA2 in the pathological process of a variety of cancers, and its ability to promote the proliferation, invasion, and metastasis of cancer cells as an oncogene. HOXA2, a novel carcinogenic transcriptional regulator, is significantly correlated with the prognosis of prostate cancer. Its acts by binding to chromatin thereby influencing PCAT19 and CEACAM21 transcription21. However, the relationship between HOXA2 and glioma has not been explored. Therefore, this study aimed to explore HOXA2 expression levels in gliomas and their potential therapeutic and diagnostic value.
We collected data on glioma based on high throughput RNA sequencing from the CGGA and found that HOXA2 expression was positively correlated with glioma grade, glioma recurrence, and patient age, but negatively correlated with the OS of glioma patients, and can be used as an independent prognostic factor. Further, HOXA2 expression and the OS data of glioma patients were obtained through TCGA and we found that HOXA2 expression was significantly higher in glioma tissues than in non-tumor brain tissues. RT-PCR further confirmed that HOXA2 expression increased significantly in glioblastoma. Previous studies have shown that HOXA2 also increased significantly in squamous cell carcinoma [Citation23], and the high methylation level of HOXA2 was significantly related with colorectal cancer prognosis [Citation24].
GSEA was performed to indirectly explain the cellular signaling pathways associated with HOXA2 and to elucidate its function and the results indicated that HOXA2 was involved in the JAK-STAT-signaling pathway, focal adhesion, cell-adhesion-molecules-CAMS pathway, cytosolic DNA sensing pathway, and natural killer cell-mediated cytotoxicity. Previous studies have shown that activation of the JAK-STAT-signaling pathway can be found in many human cancers, and the two protein families of JAKs and STATs are the main promoters of this pathway. The ability of JAK-1 and STAT-3 to promote cell cycle and tumor cell anti-apoptosis in glioma cells greatly influences the OS of glioma patients and can be a diagnostic marker for prognosis [Citation25]. Focal adhesion is a major component of key scaffold proteins, which can link signaling molecules, structural components, and regulatory proteins to produce important biological functions and methyl gallate can block the proliferation and migration of glioma cells by influencing the formation of focal adhesion [Citation26]. Cancer formation occurs due to immune inhibition that escapes the body’s immune response, leading to malignant transformation, which promotes tumorigenesis due to dysfunction of natural killer cell-mediated cytotoxicity in glioma patients [Citation26]. It can be speculated that HOXA2 may promote glioma cell proliferation, migration, and poor prognosis through the JAK-STAT and focal adhesion pathway. However, our results indirectly reveal the mechanism by which HOXA2 affects the prognosis of glioma patients, so further direct mechanisms require further experimentation.
Although we have conducted a wide range of analyses using data from public databases to improve our understanding of the relationship between HOXA2 and glioma, some limitations were hard to avoid. First, to fully understand the relationship between HOXA2 and the development of glioma, detailed treatment plans for all patients should be included in the analysis, such as the scope of surgical resection, and the radiotherapy and chemotherapy dosage. However, because the public data source is a combination of multiple centers, the lack of partial data and the inconsistency of treatment methods are disadvantages of public databases. Second, the size of healthy samples obtained from the public databases was small compared to the tumor tissue sample size, which may cause statistical errors. Hence, we have used RT-PCR technology to verify the differences in HOXA2 expression levels between tumor and non-tumor brain tissues to avoid this error as much as possible. Therefore, our retrospective analysis using public databases requires further experiments to verify the exact mechanism by which high HOXA2 expression causes poor prognosis in patients with glioma.
Conclusions
In this study, we observed an increase in HOXA2 expression levels in gliomas relative to the overall survival of glioma patients, which can serve as an independent prognostic factor. Additionally, HOXA2 may participate in the pathological process of glioma through the JAK-STAT and focal adhesion pathways. We have partially revealed that the mechanism of action of HOXA2 is in gliomas and provides a potential biomarker for the diagnosis and treatment of gliomas.
Supplemental Material
Download MS Word (16.6 KB)Disclosure statement
No potential conflict of interest was reported by the authors.
Data availability statement
The authors confirm that the data supporting the findings of this study are available within the article.
Supplementary material
Supplemental data for this article can be accessed here.
Additional information
Funding
References
- Bray F, Ferlay J, Soerjomataram I, et al. Global cancer statistics 2018: GLOBOCAN estimates of incidence and mortality worldwide for 36 cancers in 185 countries. CA Cancer J Clin. 2018;68(6):394–424.
- Ferlay J, Colombet M, Soerjomataram I, et al. Estimating the global cancer incidence and mortality in 2018: GLOBOCAN sources and methods. Int J Cancer. 2019;144(8):1941–1953.
- Kong Z, Yan C, Zhu R, et al. Imaging biomarkers guided anti-angiogenic therapy for malignant gliomas. Neuroimage Clin. 2018;20:51–60.
- Kong Z, Wang Y, Ma W. Vaccination in the immunotherapy of glioblastoma. Hum Vaccin Immunother. 2018;14(2):255–268.
- Akimoto J III. Photodynamic therapy for malignant glioma. Gan To Kagaku Ryoho. 2018;45(6):933–937.
- Patel M, Vogelbaum MA, Barnett GH, et al. Molecular targeted therapy in recurrent glioblastoma: current challenges and future directions. Expert Opin Investig Drugs. 2012;21(9):1247–1266.
- Gupta K, Salunke P. Molecular markers of glioma: an update on recent progress and perspectives. J Cancer Res Clin Oncol. 2012;138(12):1971–1981.
- Yip S, Iafrate AJ, Louis DN. Molecular diagnostic testing in malignant gliomas: a practical update on predictive markers. J Neuropathol Exp Neurol. 2008;67(1):1–15.
- Karsy M, Neil JA, Guan J, et al. A practical review of prognostic correlations of molecular biomarkers in glioblastoma. Neurosurg Focus. 2015;38(3):E4.
- Killela PJ, Reitman ZJ, Jiao Y, et al. TERT promoter mutations occur frequently in gliomas and a subset of tumors derived from cells with low rates of self-renewal. Proc Natl Acad Sci U S A. 2013;110(15):6021–6026.
- Pelloski CE, Mahajan A, Maor M, et al. YKL-40 expression is associated with poorer response to radiation and shorter overall survival in glioblastoma. Clin Cancer Res. 2005;11(9):3326–3334.
- Xing WJ, Zou Y, Han QL, et al. Effects of epidermal growth factor receptor and phosphatase and tensin homologue gene expression on the inhibition of U87MG glioblastoma cell proliferation induced by protein kinase inhibitors. Clin Exp Pharmacol Physiol. 2013;40(1):13–21.
- Jones PS, Dunn GP, Barker FG 2nd, et al. Molecular genetics of low-grade gliomas: genomic alterations guiding diagnosis and therapeutic intervention. 11th annual Frye-Halloran brain tumor symposium. Neurosurg Focus. 2013;34(2):E9.
- Riemenschneider MJ, Jeuken JW, Wesseling P, et al. Molecular diagnostics of gliomas: state of the art. Acta Neuropathol. 2010;120(5):567–584.
- Rao MK, Maiti S, Ananthaswamy HN, et al. A highly active homeobox gene promoter regulated by Ets and Sp1 family members in normal granulosa cells and diverse tumor cell types. J Biol Chem. 2002;277(29):26036–26045.
- Tumpel S, Maconochie M, Wiedemann LM, et al. Conservation and diversity in the cis-regulatory networks that integrate information controlling expression of Hoxa2 in hindbrain and cranial neural crest cells in vertebrates. Dev Biol. 2002;246(1):45–56.
- Bhatlekar S, Fields JZ, Boman BM. HOX genes and their role in the development of human cancers. J Mol Med (Berl). 2014;92(8):811–823.
- Bhatlekar S, Viswanathan V, Fields JZ, et al. Overexpression of HOXA4 and HOXA9 genes promotes self-renewal and contributes to colon cancer stem cell overpopulation. J Cell Physiol. 2018;233(2):727–735.
- Bhatlekar S, Fields JZ, Boman BM. Role of HOX genes in stem cell differentiation and cancer. Stem Cells Int. 2018;2018:3569493.
- Li HP, Peng CC, Chung IC, et al. Aberrantly hypermethylated Homeobox A2 derepresses metalloproteinase-9 through TBP and promotes invasion in Nasopharyngeal carcinoma. Oncotarget. 2013;4(11):2154–2165.
- Gao P, Xia JH, Sipeky C, et al. Biology and clinical implications of the 19q13 aggressive prostate cancer susceptibility locus. Cell. 2018;174(3):576–89 e18.
- Yu W, Ma Y, Shankar S, et al. Role of SATB2 in human pancreatic cancer: implications in transformation and a promising biomarker. Oncotarget. 2016;7(36):57783–57797.
- Hassan NM, Hamada J, Murai T, et al. Aberrant expression of HOX genes in oral dysplasia and squamous cell carcinoma tissues. Oncol Res. 2006;16(5):217–224.
- Li D, Bai Y, Feng Z, et al. Study of promoter methylation patterns of HOXA2, HOXA5, and HOXA6 and its clinicopathological characteristics in colorectal cancer. Front Oncol. 2019;9:394.
- Tu Y, Zhong Y, Fu J, et al. Activation of JAK/STAT signal pathway predicts poor prognosis of patients with gliomas. Med Oncol. 2011;28(1):15–23.
- Lee SH, Kim JK, Kim DW, et al. Antitumor activity of methyl gallate by inhibition of focal adhesion formation and Akt phosphorylation in glioma cells. Biochim Biophys Acta. 2013;1830(8):4017–4029.