
ABSTRACT
Objective
Exosomes have been documented to function in human diseases, yet their transfer of microRNA (miRNA) in preeclampsia (PE) has seldom been reported. This study intends to discuss the role of miR-133b derived from exosomes in human umbilical cord mesenchymal stem cells (hUC-MSCs) in trophoblast cell development in PE.
Methods
Placentas from PE patients and normal pregnant women were collected. The hUC-MSCs and their exosomes were obtained and identified. Trophoblast cell HPT-8 and HTR8-S/Vneo were obtained and co-cultured with hUC-MSCs-derived exosomes that had been transfected with different miR-133b plasmids. MiR-133b and glucocorticoid-regulated kinase 1 (SGK1) expression in placental tissues and HPT-8 and HTR8-S/Vneo cells was determined. HTR8-S/Vneo and HPT-8 cell proliferation, cell cycle distribution, apoptosis rate, migration and invasion were detected.
Results
MiR-133b was down-regulated and SGK1 was up-regulated in placental tissues of PE patients. MiR-133b expression was inversely related to SGK1 expression in HTR8-S/Vneo and HPT-8 cells co-cultured with hUC-MSC-derived exosomes. Exosomes promoted HTR8-S/Vneo and HPT-8 cell proliferation, migration and invasion abilities, cell cycle entry and inhibited apoptosis. Elevated exosome-derived miR-133b from hUC-MSCs boosted HTR8-S/Vneo and HPT-8 cell proliferation, cell cycle progression, migration and invasion and limited cell apoptosis. MiR-133b targeted SGK1.
Conclusion
Collectively, we demonstrate that miR-133b is down-regulated and SGK1 is up-regulated in PE, and miR-133b derived from exosomes in hUM-MSCs facilitates trophoblast cell proliferation, migration and invasion in PE via constraining SGK1.
Introduction
Preeclampsia (PE) is a pregnancy-specific disease mainly manifested by de-novo development of synchronous hypertension and proteinuria, and advancing into a multiorgan cluster of various clinical features at times [Citation1]. The most important risk factor for PE is a history of PE in previous pregnancies, followed by multiple gestation pregnancy and preexisting conditions like obesity, hypertension, insulin-dependent diabetes, and renal disease [Citation2]. As a result of ineffective diagnostic strategies, and ambiguous etiology of the disorder, PE is still a leading cause of maternal and fetal mortality [Citation3]. At present, only symptomatic blood pressure treatment is available for PE, and delivery is the only recognized cure for this disease, which may lead to infant morbidity and naturally large health care expenditure [Citation4]. In this study, we intended to seek for new effective therapy for PE treatment on the basis of previous research.
Exosomes refer to a kind of cell-derived extracellular vesicles existing in nearly all eukaryotic fluids with a diameter of 10–100 nm [Citation5]. It has been suggested that the contents of exosomes alter in a variety of diseases, which makes exosomes a novel biomarker to be investigated [Citation6]. Lately, exosomes from human umbilical cord mesenchymal stem cells (hUC-MSCs) have been reported to protect ovarian granulosa cell from cisplatin-induced injury and chemotherapy-induced apoptosis in vitro [Citation7]. In recent years, microRNAs (miRNAs) in exosomes have been identified and exosomal miRNAs have been proposed to feature in disease progression [Citation8]. MiRNAs are evolutionarily conserved, small (about 22 nucleotides), single-stranded non-coding RNAs which is capable of modulating the expression of specific genes [Citation9]. MiR-133b, a member of big miRNA family, has been documented to be downregulated in PE [Citation10]. A prior study has revealed that miR-133b is declined in colorectal cancer (CRC) and is inversely related to tumor metastasis [Citation11]. Zhen Y et al. have also demonstrated that miR-133b negatively functions in non-small cell lung cancer progression [Citation12]. There has been a literature recording that miR-133b targets serum- and glucocorticoid-regulated kinase 1 (SGK1) [Citation13]. SGK1, a serine/threonine kinase, has been reported to be vital and limiting in modulating cell survival, proliferation and differentiation [Citation14]. A study has shown that SGK1 is overexpressed in CRC and its suppression has therapeutic meaning for CRC [Citation15]. Nevertheless, the role of exosomal miR-133b from hUC-MSCs remains to be discovered. Thus, we conduct this study to figure out how exosomal miR-133b from hUC-MSCs affects PE trophoblast cells by regulating SGK1.
Materials and methods
Ethics statement
Written informed consents were obtained from all patients prior to the study. The protocols of this study were approved by the Ethic Committee of Shengjing Hospital of China medical University and based on the ethical principles for medical research involving human subjects of the Helsinki Declaration.
Study subjects
Forty-six cases of PE patients (average age: 29.71 ± 1.65 y) hospitalized in Shengjing Hospital of China medical University from January 2016 to December 2018 were collected as the PE group. PE was diagnosed according to the criteria of the eighth edition of Obstetrics and Gynecology on gestational hypertension. Another 30 cases of placentas in normal pregnant women (average age: 29.34 ± 4.28 y) in the third trimester of pregnancy were used as the normal group, and the indications for cesarean section were social factors. All cases were delivered by cesarean section, before which they were not in labor. The medical complications of essential hypertension, urinary system infection, endocrine system and cardiovascular system were excluded.
Cell isolation
The umbilical cord of healthy newborns delivered by cesarean section was collected and immersed in Dulbecco modified Eagle medium (DMEM)/F12 (with 3% Penicillin-Streptomycin), and then the whole umbilical cord was cut into 2-cm sections and immersed in DMEM/F12 after washed with phosphate-buffered saline (PBS). The three blood vessels in the umbilical cord and the outer membrane were removed with ophthalmic scissors and hemostat. Then, human umbilical cord Wharton’s Jelly was transferred to another sterile dish and mixed with a small amount of complete medium with antibiotics for follow-up assays. The separated and washed umbilical cord Wharton’s Jelly was fully cut into 1-mm3 tissue masses which were then evenly arranged in the culture bottle with gaps left. Next, the masses were inversely incubated at 37°C with 5% CO2 for adherence of tissue masses. After 1 to 2 h, the masses were supplemented with 2 mL DMEM/F12 and cultured normally. Fresh complete medium was added every 3 to 4 d. About 1–2 w, the medium was changed when microscopic observation showed that fibroblast-like cells climbed out from the edge of the tissue masses, and those masses suggested no climbing cells were discarded. The liquid was changed every 3 d, and after about 3 w, the cells were detached and passaged at 70–80% cell confluence.
Cell identification
Induction of differentiation of hUC-MSCs into osteoblasts: The well-grown MSCs of passage 3 (P3) were routinely detached with 0.25% trypsin and inoculated into 6-well plates at 2 × 10⁴ cells/well. After cell adherence, two wells without treatment were used as the control group, and another three wells were performed with osteogenic differentiation induction. The cells were supplemented with osteogenic induction medium (DMEM/F12 with 10% FBS mixed with 10−7 mol/L dexamethasone, 50 μg/mL vitamin C and 10 mmol/L β-glycerophosphate sodium) which was changed every 3 d. After 3-w induction culture, visible nodular morphology in MSCs was observed under an inverted microscope, after which MSCs were fixed with 1 mL 95% alcohol for 1 h, supplemented with alizarin red staining solution after ddH2O rinse, and put in a bag and cultured for 2 h. After dried, the cells were observed under an inverted microscope and photographed.
Induction of differentiation of hUC-MSCs into lipoblasts: When the cell confluence was 70–80%, the cells were detached, inoculated, and those in the induction group were mixed with adipogenic induction medium (DMEM/F12 with 10% FBS mixed with 20 μg/mL bovine insulin, 1 mmol/L 1-methyl-3-isobutylxanthine, 1 μmol/L dexamethasone, and 25 μmol/L indomethacin) for continuous culture. After 2 w, the cells were fixed with 4% paraformaldehyde for 0.5 h, and then placed in the incubator with oil red O staining solution for 1 h. Finally, the cells were observed under the inverted microscope and photographed.
Exosome extraction and identification
The well-grown hUC-MSCs of P3-P6 were cultured in a serum-free medium for 48 h (37°C, 5% CO2). The supernatant was collected and kept at 4°C for 1 week. Then, after centrifugation at 300 g at 4°C for 10 min, the new supernatant was collected and centrifuged again at 16,500 g at 4°C for 20 min. The supernatant was collected and filtered by a 0.22 μm filter for degerming. Subsequently, the supernatant was centrifuged at 120,000 g for 70 min at 4°C, and the precipitates were re-suspended in PBS, after which exosomal suspension was obtained. Exosomes were identified by a transmission electron microscope. Briefly, 20 μL newly prepared exosomal suspension was pipetted onto copper mesh and kept for 1 min. After the exosomes were precipitated, the remaining liquid was absorbed by filter paper and 20 μL phosphotungstic acid solution of 30 g/L was applied to the exosomes for 1- to 2-min staining. The copper mesh with samples was baked under incandescent lamp for about 10 min, and placed under a transmission electron microscope (TEM, Hitachi H-7650, Tokyo, Japan) when the surface was slightly dried to observe the morphology of exosomes and take photos. Surface markers of the exosomes were detected by flow cytometry. The isolated and purified hUC-MSCs-derived exosomes were culture with APC-labeled CD44, PE-labeled CD105, FITC-labeled CD34, and PE-cy5-labeled CD45 mouse anti-human antibody (all from Santa Cruz Biotechnology, Santa Cruz, California, USA) for 0.5 h in the dark, re-suspended in PBS, and analyzed by flow cytometer. The exosomes were detected via Nanosight. The prepared exosomes were tested on the NS3000 Nanosight instrument (Malvern Instruments, Malvern, UK) (principle: laser to make nanoparticles emit light, confocal microscopy to observe the Brownian motion of nanoparticles).
Cell transfection and grouping
Transfection was performed when the cell density reached 70%. The hUC-MSCs in logarithmic phase were inoculated in 6-well cell culture plates at 2 × 10⁵ cells/well, and transfected base on the specifications of lipofectamineTM 2000 reagent (11,668–027, Invitrogen, CA, USA). Each transfection oligonucleotides (GenePharma Co., Ltd., Shanghai, China) was diluted with 250 μL serum-free DMEM/F12 (final concentration: 50 nM) and incubated for 5 min. Then, 5 μL lipofectamineTM 2000 was diluted with 250 μL more serum-free DMEM and incubated for 5 min. Next, the above two solutions were mixed and incubate for 20 min and added to the cell culture wells. After 6-h incubation (37°C, 5% CO2, saturated humidity), the medium with the transfection solution was substituted with DMEM/F12 with 10% FBS for further assays. The cells were divided into five groups: blank group (hUC-MSCs without any treatment), mimics-negative control (NC) group (hUC-MSCs transfected with miR-133b mimics NC), miR-133b mimics group (hUC-MSCs transfected with miR-133b mimics), inhibitors-NC group (hUC-MSCs transfected with miR-133b inhibitors NC), miR-133b inhibitors group (hUC-MSCs transfected with miR-133b inhibitors). MiR-133b mimics NC, miR-133b mimics, miR-133b inhibitors NC, and miR-133b inhibitors were all purchased from RiboBio Co., Ltd. (Shanghai, China). After 48-h culture, exosomes of hUC-MSCs in each group were extracted by ultracentrifugation.
Co-culture of hUC-MSC-derived exosomes with HPT-8 and HTR8-S/Vneo cells
The human extravillous cytotrophoblast-derived transformed cell lines HTR-8/SVneo and HPT-8 were obtained from Hibio Bio-tech Co., Ltd. (Hangzhou, Zhejiang, China). HTR8-S/Vneo and HPT-8 cells were grown in DMEM/Ham’s F-12 supplemented with 1% nonessential amino acids, 2 mmol/L glutamine and 10% heat-inactivated FBS in an incubator at 37°C with 5% CO2.
The extracted exosomes from transfected hUC-MSCs were re-suspended in DMEM/F12 with 10% FBS, and co-cultured with HPT-8 and HTR8-S/Vneo trophoblast cells for 3 d for subsequent experiments. HPT-8 cells and HTR8-S/Vneo cells were categorized into Blank (HPT-8, HTR8-S/Vneo cells in normal culture), Blank-Exo group (exosomes from hUC-MSCs without any treatment co-cultured with HPT-8 and HTR8-S/Vneo cells), mimics-NC-Exo group (exosomes from hUC-MSCs transfected with miR-133b mimics NC co-cultured with HPT-8 and HTR8-S/Vneo cells), miR-133b mimics-Exo group (exosomes from hUC-MSCs transfected with miR-133b mimics co-cultured with HPT-8 and HTR8-S/Vneo cells), inhibitors-NC-Exo group (exosomes from hUC-MSCs transfected with miR-133b inhibitors NC co-cultured with HPT-8 and HTR8-S/Vneo cells), miR-133b inhibitors-Exo group (exosomes from hUC-MSCs transfected with miR-133b inhibitors co-cultured with HPT-8 and HTR8-S/Vneo cells).
3-(4,5-dimethylthiazol-2-yl)-2,5-diphenyltetrazolium bromide (MTT) assay
HPT-8 cells and HTR8-S/Vneo cells in the logarithmic phase were seeded into a 96-well cell culture plate at 1 × 10⁴ cells/mL (6 wells were repeated) and incubated for 24 h. After cell adherence, the medium was substituted with 200 μL serum-free DMEM/F12 and the cells were incubated for 6 h, and the medium was discarded. Then, the cells were added with 20 μL MTT solution (5 mg/mL, Sigma-Aldrich, St Louis, MO, USA) for 4-h incubation at 37°C. After removing the supernatant, 150 μL dimethyl sulfoxide was added to each well. The optical density (OD) value was measured at a wavelength of 490 nm with the microplate reader (BioTek, Winooski, Vermont, USA). This assay was repeated 3 times.
Flow cytometry
HPT-8 and HTR8-S/Vneo cells in each group were detached, collected by centrifugation, resuspended with pre-cooled 75% ethanol, and fixed at −20°C overnight. After centrifugation and supernatant removal, each sample was resuspended with 500 μL PBS, followed by 30-min water bath with 10 μL Rnase A (10 mg/mL) at 37°C. Then, 10 μL PI (1 mg/mL) was added for 0.5-h staining at 4°C without light. The cell cycle distribution was detected with the flow cytometer (FACSCalibur, BD Biosciences, Franklin Lakes, NJ, USA) and analyzed. The assay was repeated three times independently.
HPT-8 and HTR8-S/Vneo cells were mixed with pre-cooled 100 μL 1 × binding buffer to resuspend the cells, and 5 μL Annexin (20 μg/mL) and 2.5 μL PI (100 μg/mL) were added in sequence and mixed. Apoptosis was detected by flow cytometry after 15-min incubation without light. Results criteria: AnnexinV was regarded as the horizontal axis, and PI as the vertical axis; the upper left quadrant was mechanically damaged cells; the upper right quadrant was the late apoptotic or necrotic cells; the lower left quadrant was normal negative cells; the lower right quadrant was the early apoptotic cells. The apoptosis rate = [(early apoptotic cells + late apoptotic cells)/total number of cells] × 100%.
Transwell assay
HPT-8 and HTR8-S/Vneo cells of all groups were detached, and cell density was adjusted to 1 × 10⁵ cells/mL. Then, 200 μL cell suspension was seeded into the apical Transwell chambers and mixed with serum-free medium, and the basolateral chambers were supplemented with complete medium with 10% serum for 24-h culture (37°C, 5% CO2). Subsequently, after removing the cells not passing through the membrane in the upper layer of the chambers with a cotton swab, the remaining cells were fixed with formaldehyde at 37°C for 0.5 h and stained with 0.5% crystal violet solution for 20 min. Then, five random fields under the inverted microscope were selected to count the migrating cells and take pictures. Each group was repeated 3 times. Transwell chambers in cell invasion assay were pre-coated with 50 μL Matrigel solution (Becton, Dickinson and Company, Franklin lake, New Jersey, USA), and the remaining steps were the same as those in cell migration assay.
Reverse transcription-quantitative polymerase chain reaction (RT-qPCR)
Trizol (Takara, Dalian, China) was adopted for extraction of total RNA from tissues and cells, and the concentration and purity of RNA were determined. Next, RNA was reversely transcribed into cDNA in the light of the specifications of the reverse transcription kit (K1621, Fermentas, Maryland, NY, USA). miR-133b, U6, SGK1 and glyceraldehyde-3-phosphate dehydrogenase (GAPDH) primer sequences () were designed and entrusted to Shanghai Genechem Co., Ltd. (Shanghai, China) for synthesis. Gene expression was detected with RT-qPCR kit (Takara, Dalian, China) by RT-qPCR detector (ABI 7500, ABI, Foster City, CA, USA). The internal reference of miR-133b was U6, and that of SGK1 was GAPDH. The relative expression of target genes was calculated by 2−ΔΔCt method, and each experiment was repeated 3 times.
Table 1. Primer sequence.
Western blot analysis
Total proteins in exosomes, tissues and cells were extracted, followed by protein concentration determination on the basis of the specifications of bicinchoninic acid kit (Boster Biological Technology Co., Ltd., Wuhan, China). The extracted proteins were added to the loading buffer before 10-min boiling at 95°C (each well was loaded with 30 μg samples). Then, protein separation was performed through electrophoresis with the voltage altered from 80 v to 120 v by 10% polyacrylamide gel (Boster Biological Technology Co., Ltd., Wuhan, China). Then, the proteins were transferred to polyvinylidene difluoride membrane, followed by sealing with 5% bovine serum albumin for 1 h. Next, primary antibody SGK1, Ki-67, CD81 and CD9 (all 1:1000, Abcam, Cambridge, UK) were added for 24- to 48-h incubation at 4°C, along with Cyclin D1 (1:1000), B-cell lymphoma-associated X (Bax, 1:1000), B-cell lymphoma-2 (Bcl-2, 1:1000), CD63 (1:500) (all from Santa Cruz Biotechnology), and GAPDH (1:2000, Jackson ImmunoResearch, Grove, PA, USA), and then placed in horseradish peroxidase-labeled secondary antibody (1:500, Jackson ImmunoResearch) for 1-h incubation. Images were obtained by the Odyssey two-color infrared fluorescence scanning imaging system, and the gray value of the bands was measured by the image analysis software Quantity One (Bio-Rad, Inc., Hercules, CA, USA). The ratios of the value of target bands to that of the internal reference bands in each group were obtained and compared.
Dual-luciferase reporter gene assay
The targeting relationship of miR-133b and SGK1 and the binding site of miR-133b and SGK1 3ʹ-untranslated regions (3ʹ-UTR) were predicted with a bioinformatics software (http://www.targetscan.org). The SGK1 3ʹ-UTR promoter sequence containing the miR-133b binding site was synthesized and cloned into pGL3-basic luciferase plasmid (Promega, Madison, WI, USA) to construct SGK1 3ʹ-UTR wild type plasmid (SGK1-WT). Based on SGK1-WT, the binding site of miR-133b on SGK1-WT was mutated via using point mutation kit (Takara Bio Inc., Otsu, Shiga, Japan) for SGK1 3ʹ-UTR mutant type plasmid (SGK1-MUT) establishment. Then, HTR-8/SVneo and HPT-8 cells in logarithmic phase were inoculated in the 96-well plate, and transfected with the mixtures of SGK1-WT and SGK1-MUT plasmids with mimics NC and miR-133b mimics, respectively, by lipofectamine 2000 reagent at about 70% cell density. After 48 h, cells were lysed for luciferase activity detection with a luciferase assay kit (Promega). Experiment in each group was repeated three times.
Statistical analysis
All data were statistically analyzed employing SPSS 21.0 (IBM Corp., Armonk, NY, USA) statistical software. Measurement data were expressed as mean ± standard deviation and those subjected to normal distribution between two groups were compared with independent sample t-test. Comparison among multiple groups was analyzed by one-way analysis of variance (ANOVA), after which pairwise comparison was performed with Tukey’s multiple comparisons test. P < 0.05 demonstrated statistically significant difference.
Results
Isolation of hUC-MSCs and hUC-MSC-derived exosomes
The hUC-MSCs were cultured by tissue adherence. TEM suggested that there were fibroblast-like cells arranged radially from the inside to the outside, and the shape was polygonal or fusiform; there were few impurities around the cells and no cells of other shapes were witnessed ()). After cultured by osteogenic induction, hUC-MSCs spread over the bottom of the bottle and showed obvious calcified nodules, which turned orange-red after alizarin red staining, indicating that the hUC-MSCs had certain potential for osteogenic differentiation ()). After hUC-MSCs were induced by adipogenic induction solution for 2 w, oil red O staining showed that a large amount of lipids in the cytoplasm were stained red, suggesting that the hUC-MSCs had certain potential for adipogenic differentiation ()).
Figure 1. Isolation of hUC-MSCs and hUC-MSC-derived exosomes. a. Observation of hUC-MSC morphology; b. Alizarin red staining of hUC-MSC osteogenic induction; c. Oil red O staining of hUC-MSC adipogenic induction; d. Identification of exosomes by TEM; e. Identification of exosomes by Nanosight; f. Detection of exosome surface antigen by flow cytometry; g. Detection of CD81, CD9 and CD63 expression by Western blot analysis; the data in the figure were measurement data expressed as mean ± standard deviation; comparison between two groups was analyzed by independent sample t-test.
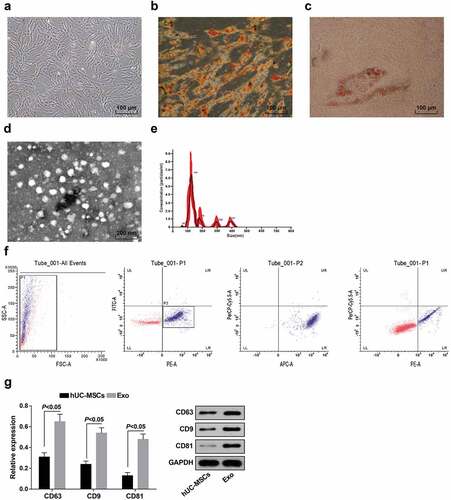
Exosomes were extracted from hUC-MSC conditioned medium by ultracentrifugation and identified by TEM, nanosight, flow cytometry and Western blot analysis. TEM indicated that the exosomes derived from hUC-MSCs were dish-shaped membranous vesicles uniform in size and showed low electron density components in the cavity ()). Nanosight showed an average exosome diameter of 130 nm, and the particle size of most exosomes was concentrated at a diameter of 80–150 nm ()). Flow cytometry was performed to detection the expression of PE-labeled CD105, FITC-labeled CD34, APC-labeled CD44, and PE-cy5-labeled CD45 on exosomes and it was shown that exosomes were small and carried CD105 and CD44 molecules on the surface instead of CD34 and CD45 molecules ()). Western blot analysis was used to detect the expression of protein markers (CD81, CD9 and CD63) of hUC-MSCs and hUC-MSC-derived exosomes, and it was found that CD81, CD9 and CD63 expression in exosomes elevated in relation to hUC-MSCs (all P < 0.05; )).
MiR-133b is down-regulated and SGK1 is up-regulated in placental tissues of PE patients; miR-133b expression is inversely related to SGK1 expression in HTR8-S/Vneo and HPT-8 cells co-cultured with hUC-MSC-derived exosomes
MiR-133b and SGK1 expression in placental tissues of PE patients and normal pregnant women was determined by RT-qPCR and Western blot analysis. There were obvious decrease in miR-133b expression and visible enhancement in SGK1 expression in the PE group versus the normal group (both P < 0.05; ,b)).
Figure 2. MiR-133b is downregulated and SGK1 is upregulated in placental tissues of PE patients; miR-133b expression is inversely related to SGK1 expression in HTR8-S/Vneo and HPT-8 cells co-cultured with hUC-MSC-derived exosomes. a. Detection of miR-133b and SGK1 mRNA expression in placental tissues of PE patients and normal pregnant women by RT-qPCR; b. Detection of SGK1 protein expression in placental tissues of PE patients and normal pregnant women by Western blot analysis; c. Detection of miR-133b and SGK1 mRNA expression in HPT-8 cells and HTR8-S/Vneo cells after normal culture and co-culture with exosomes; d. Detection of SGK1 protein expression in HPT-8 cells and HTR8-S/Vneo cells after normal culture and co-culture with exosomes; e. Detection of miR-133b and SGK1 mRNA expression of HTR8-S/Vneo cells cultured with exosomes in each group by RT-qPCR; f. Detection of SGK1 protein expression of HTR8-S/Vneo cells cultured with exosomes in each group by Western blot analysis; g. Detection of miR-133b and SGK1 mRNA expression of HPT-8 cells cultured with exosomes in each group by RT-qPCR; h. Detection of SGK1 protein expression of HPT-8 cells cultured with exosomes in each group by Western blot analysis; &, P < 0.05 vs the Blank group; *, P < 0.05 vs the mimics-NC-Exo group; #, P < 0.05 vs the inhibitors-NC-Exo group; the data in the figure were all measurement data expressed as mean ± standard deviation; comparison between two groups were analyzed by independent sample t-test, and that among multiple groups by one-way ANOVA, after which pairwise comparison was performed with Tukey’s multiple comparisons test.
RT-qPCR and western blot analysis were performed to detect the expression of miR-133b and SGK1 in normally cultured HTR8-S/Vneo cells, HPT-8 cells, and HTR8-S/Vneo cells and HPT-8 cells after co-culture with exosomes. The results showed that, as compared to the Blank group, the expression of miR-133b in the Blank-Exo group was increased while the expression of SGK1 was decreased (all P < 0.05) (,d)).
RT-qPCR and Western blot analysis were adopted to detect miR-133b and SGK1 expression in the HTR8-S/Vneo and HPT-8 cell lines co-cultured with exosomes in each group. In HTR8-S/Vneo and HPT-8 cells, in relation to the respective NC groups, miR-133b expression elevated while SGK1 expression decreased in the miR-133b mimics-Exo group, and miR-133b and SGK1 expression in the miR-133b inhibitors-Exo group showed an opposite trend (all P < 0.05; -h)).
Exosomes promotes HTR8-S/Vneo and HPT-8 cell proliferation, migration and invasion abilities, cell cycle entry and inhibits apoptosis
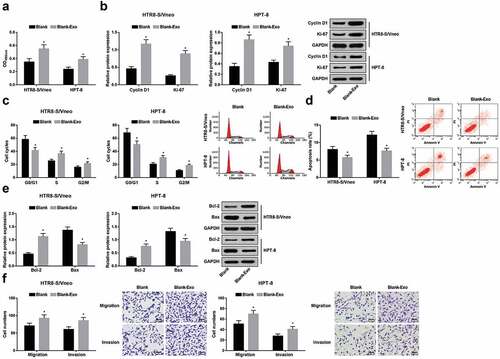
MTT, Transwell assays, flow cytometry, and western blot analysis were used to detect proliferation, migration and invasion abilities, cell cycle distribution, apoptosis rate, as well as the protein expression of Cyclin D1, Ki-67, Bcl-2 and Bax in normally cultured HTR8-S/Vneo and HPT-8 cells and HTR8-S/Vneo and HPT-8 cells co-cultured with exosomes. The results found that an increase exhibited in proliferation, migration and invasion abilities, the cell ratio in S, G2/M phases and the protein expression of Cyclin D1, Ki-67 and Bcl-2, while a decrease was presented in the cell ratio in G0/G1 phase, apoptosis rate, and the protein expressions of Bax in the Blank-Exo group versus the Blank group (all P < 0.05) (-f)).
Figure 3. Exosomes elevates HTR8-S/Vneo and HPT-8 cell proliferation, migration, invasion abilities, and cell cycle entry and represses apoptosis. a.) Detection of HTR8-S/Vneo and HPT-8 cell proliferation in each group by MTT assay; b. Detection of Cyclin D1 and Ki-67 protein expression of HTR8-S/Vneo and HPT-8 cells in each group by Western blot analysis; c. Detection of HTR8-S/Vneo and HPT-8 cell cycle distribution in each group by flow cytometry; d. Detection of apoptosis of HTR8-S/Vneo and HPT-8 cells in each group by flow cytometry; e. Detection of Bcl-2 and Bax protein expression of HTR8-S/Vneo and HPT-8 cells in each group by Western blot analysis; f. Detection of HTR8-S/Vneo and HPT-8 cell migration and invasion abilities by Transwell assay. *, P < 0.05 vs the Blank group; Measurement data were expressed as mean ± standard deviation and those subjected to normal distribution between two groups were compared with independent sample t-test.
Elevated exosome-derived miR-133b from hUC-MSCs boosts HTR8-S/Vneo and HPT-8 cell proliferation
Proliferation ability, and Cyclin D1 and Ki-67 protein expression of HTR8-S/Vneo and HPT-8 cells co-cultured with hUC-MSC-derived exosomes in each group were detected by MTT assay and Western blot analysis. In both kinds of cells, proliferation ability, and Cyclin D1 and Ki-67 expression all demonstrated an increase in the miR-133b mimics-Exo group versus the mimics-NC-Exo group and a reduction in the miR-133b inhibitors-Exo group versus the inhibitors-NC-Exo group (all P < 0.05; -d)).
Figure 4. Elevated exosome-derived miR-133b from hUC-MSCs boosts HTR8-S/Vneo and HPT-8 cell proliferation. a) Detection of HTR8-S/Vneo cell proliferation in each group by MTT assay; b. Detection of Cyclin D1 and Ki-67 protein expression of HTR8-S/Vneo cells in each group by Western blot analysis; c. Detection of HPT-8 cell proliferation in each group by MTT assay; d. Detection of Cyclin D1 and Ki-67 protein expression of HPT-8 cells in each group by Western blot analysis; *, P < 0.05 vs the mimics-NC-Exo group; #, P < 0.05 vs the inhibitors-NC-Exo group; the data in the figure were all measurement data expressed as mean ± standard deviation; comparison among multiple groups was analyzed by one-way ANOVA, after which pairwise comparison was performed with Tukey’s multiple comparisons test.
Elevated exosome-derived miR-133b from hUC-MSCs contributes to cell cycle progression and limits apoptosis of HTR8-S/Vneo and HPT-8 cells
Cell cycle alterations of HTR8-S/Vneo and HPT-8 cells co-cultured with hUC-MSC-derived exosomes in each group were detected by flow cytometry. In the miR-133b mimics-Exo group, HTR8-S/Vneo and HPT-8 cell ratio showed a decline in phase G0/G1 and a rise in phase S and G2/M versus the mimics-NC-Exo group; in relation to the inhibitors-NC-Exo group, cell ratio indicated an increase in phase G0/G1 and a reduction in phase S and G2/M (all P < 0.05, -d)).
Figure 5. Elevated exosome-derived miR-133b from hUC-MSCs contributes to cell cycle progression and limits apoptosis of HTR8-S/Vneo and HPT-8 cells. a. Quantitative results of HTR8-S/Vneo cell cycle in each group; b. Detection of HTR8-S/Vneo cell cycle by flow cytometry; c. Quantitative results of HPT-8 cell cycle in each group; d. Detection of HPT-8 cell cycle by flow cytometry; e. Quantitative results of HTR8-S/Vneo cell apoptosis in each group; f. Detection of HTR8-S/Vneo cell apoptosis in each group by flow cytometry; g. Quantitative results of HPT-8 cell apoptosis in each group; h. Detection of HPT-8 cell apoptosis in each group by flow cytometry; i. Detection of Bcl-2 and Bax protein expression of HTR8-S/Vneo cells in each group by Western blot analysis; j. Detection of Bcl-2 and Bax protein expression of HPT-8 cells in each group by Western blot analysis; *, P < 0.05 vs the mimics-NC-Exo group; #, P < 0.05 vs the inhibitors-NC-Exo group; the data in the figure were all measurement data expressed as mean ± standard deviation; comparison among multiple groups was analyzed by one-way ANOVA, after which pairwise comparison was performed with Tukey’s multiple comparisons test.
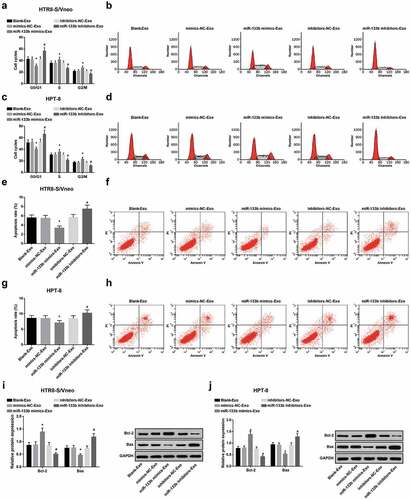
Apoptosis of HTR8-S/Vneo and HPT-8 cells co-cultured with hUC-MSC-derived exosomes in each group was detected by flow cytometry. HTR8-S/Vneo and HPT-8 cell apoptotic rates suggested a fall in the miR-133b mimics-Exo group versus the mimics-NC-Exo group, and augmentation in the miR-133b inhibitors-Exo group in relation to the inhibitors-NC-Exo group (all P < 0.05; ,h)).
Bcl-2 and Bax protein expression in HTR8-S/Vneo and HPT-8 cells co-cultured with hUC-MSC-derived exosomes in each group was detected by Western blot analysis. In both types of cells, there was enhancement in Bcl-2 expression and a drop in Bax expression in the miR-133b mimics-Exo group versus the mimics-NC-Exo group, and versus the inhibitors-NC-Exo group, Bcl-2 was downregulated while Bax was upregulated in the miR-133b inhibitors-Exo group (all P < 0.05; ,j)).
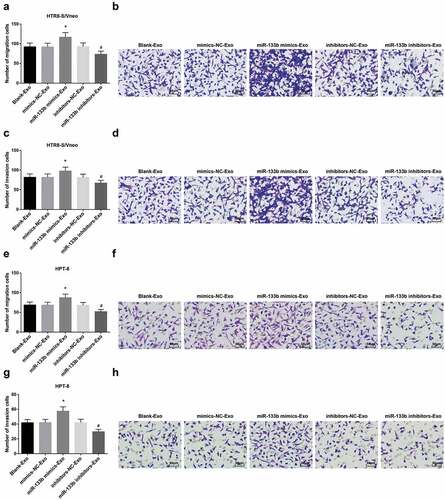
Elevated exosome-derived miR-133b from hUC-MSCs facilitates HTR8-S/Vneo and HPT-8 cell migration and invasion
Migration and invasion abilities of HTR8-S/Vneo and HPT-8 cells co-cultured with hUC-MSC-derived exosomes in each group were detected by Transwell assay. Cell migration and invasion abilities suggested an elevation in the miR-133b mimics-Exo group and diminution in the miR-133b inhibitors-Exo group versus the NC groups (both P < 0.05; -h)).
Figure 6. Elevated exosome-derived miR-133b from hUC-MSCs facilitates HTR8-S/Vneo and HPT-8 cell migration and invasion. a. Quantitative results of HTR8-S/Vneo cell migration in each group; b. Detection of HTR8-S/Vneo cell migration in each group by Transwell assay; c. Quantitative results of HTR8-S/Vneo cell invasion in each group; d. Detection of HTR8-S/Vneo cell invasion in each group by Transwell assay; e. Quantitative results of HPT-8 cell migration in each group; f. Detection of HPT-8 cell migration in each group by Transwell assay; g. Quantitative results of HPT-8 cell invasion in each group; h. Detection of HPT-8 cell invasion in each group by Transwell assay; *, P < 0.05 vs the mimics-NC-Exo group; #, P < 0.05 vs the inhibitors-NC-Exo group; the data in the figure were all measurement data expressed as mean ± standard deviation; comparison among multiple groups was analyzed by one-way ANOVA, after which pairwise comparison was performed with Tukey’s multiple comparisons test.
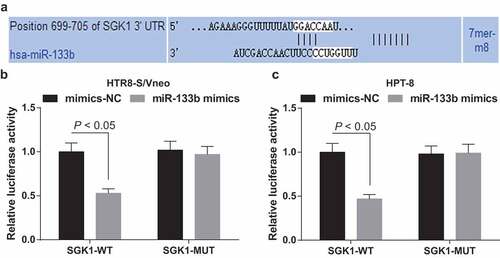
MiR-133b targets SGK1
Bioinformatics software predicted a targeted site between miR-133b and SGK1 ()). Dual-luciferase reporter gene assay showed that after HTR8-S/Vneo and HPT-8 cells were co-transfected with SGK1-WT and miR-133b mimics, cell relative luciferase activity suggested a notable decline (P < 0.05); after HTR8-S/Vneo and HPT-8 cells were co-transfected with SGK1-MUT and miR-133b mimics, the relative luciferase activity demonstrated no change (P > 0.05; ,c)), indicating that SGK1 is miR-133b’s target gene.
Figure 7. MiR-133b targets SGK1. a. Prediction of the binding site of miR-133b and SGK1 at bioinformatics website; b. Validation of the regulatory relationship between miR-133b and SGK1 in HTR8-S/Vneo cells by dual-luciferase reporter gene assay; c. Validation of the regulatory relationship between miR-133b and SGK1 in HPT-8 cells by dual-luciferase reporter gene assay; the data in the figure are all measurement data, using the mean ± standard deviation form; comparison between two groups were analyzed by independent sample t-test.
Discussion
PE is a multisystem disease only occurring during pregnancy that makes 3–8% of all pregnancies complex [Citation16]. Unless treated, PE may progress into severe eclampsia and lead to stroke [Citation17]. In recent years, miRNAs with altered expression have been proposed to change PE-related processes via targeting signaling pathway-associated genes [Citation18], which inspires us to make a study of the mechanism of miR-133b from exosomes in hUC-MSCs on trophoblast cell development in PE. All in all, we demonstrate that miR-133b is downregulated and SGK1 is upregulated in PE, and exosomal miR-133b from hUM-MSCs promotes trophoblast cell proliferation, migration and invasion in PE through restriction on SGK1.
To know how miR-133b and SGK1 expressed in PE, we initially conducted RT-qPCR and Western blot analysis and found that miR-133b was lowly expressed while SGK1 was highly expressed in placental tissues of PE patients. Similar to our findings, a prior research has recorded that miR-133b expression is diminished in PE [Citation10]. Evidences have suggested that attenuated miR-133b expression is also found in other diseases, such as gastric cancer and ovarian cancer [Citation19,Citation20]. There have been studies showing that SGK1 expression is augmented in hypoxic lung cancer cells and CRC [Citation15,Citation21]. Moreover, further assays performed revealed that miR-133b targeted SGK1, and miR-133b expression was inversely related to SGK1 expression in HTR8-S/Vneo and HPT-8 cells co-cultured with hUC-MSC-derived exosomes. A previous report has indicated that in Ishikawa cells, SGK1 is miR-133b’s target gene, and there is a notable inverse correlation of miR-133b expression with SGK1 expression [Citation13]. Liu W et al. have demonstrated that depletion of SGK1 is capable of inducing autophagy-dependent apoptosis of prostate cancer cells through the mTOR-Foxo3a pathway [Citation22]. It has also been proposed that downregulation of SGK1 is able to attenuate hyperglycemia through reduction of glucose absorption [Citation23].
To further explore the function of exosomal miR-133b in PE trophoblast cell development, we co-cultured HTR8-S/Vneo and HPT-8 cells with exosomes from hUC-MSCs treated with miR-133b overexpression or low expression plasmids, and discovered that elevated exosome-derived miR-133b from hUC-MSCs boosts HTR8-S/Vneo and HPT-8 cell proliferation, cell cycle progression, migration and invasion and limits cell apoptosis. In a prior study, miR-133b has been suggested to block breast cancer pathogenesis and metastasis through modulating Sox9 [Citation24]. Literature has also shown the suppressive role of miR-133b in human gastric cancer growth through knockdown of pyruvate kinase muscle-splicer polypyrimidine tract-binding protein 1 [Citation25]. Another report on the molecular mechanism of miR-133b on nasopharyngeal carcinoma has illustrated that miR-133b controls cancer cell proliferation by modulating S1PR1 [Citation26]. In addition, Li D et al. have proffered that miR-133b-modified MSC-derived exosomes contributes to recovery from spinal cord injury (SCI) by activating ERK1/2, STAT3, and CREB [Citation27]. Also, other researchers have revealed that exosomes derived from miR-133b-modified adipose-derived stem cells is capable of greatly facilitating the recovery of SCI animals’ neurological function through modulating the signaling pathway correlated with axon regeneration and NF, GAP-43, GFAP and MBP expression [Citation28]. Besides, multipotent mesenchymal stromal cell-derived exosome-mediated transfer of miR-133b catalyzes neurite outgrowth in neural cells [Citation29]. These findings all accord with our results obtained.
To conclude, we demonstrate that miR-133b is downregulated and SGK1 is upregulated in PE, and exosomal miR-133b from hUM-MSCs facilitates trophoblast cell proliferation, migration and invasion in PE by decreasing SGK1 expression. Study of miR-133b in PE trophoblast cell development yields a better understanding of the role of exosomal miR-133b/SGK1 axis in PE and provides new effective treatment for PE. However, more investigations have to be made to further elucidate the exact role of hUM-MSC-derived exosome-mediated transfer of miR-133b in trophoblast cell development of PE.
Authors’ contributions
Leilei Wang finished study design, Dan Wang and Quan Na finished experimental studies, Dan Wang and Gui yu Song finished data analysis, Dan Wang finished manuscript editing. All authors read and approved the final manuscript.
Ethical statement
This study was approved and supervised by the animal ethics committee of Shengjing Hospital of China medical University. The treatment of animals in all experiments conforms to the ethical standards of experimental animals.
Acknowledgments
We would like to acknowledge the reviewers for their helpful comments on this paper.
Disclosure statement
The authors declare that they have no conflicts of interest.
Additional information
Funding
References
- Steegers EA, von Dadelszen P, Duvekot JJ, et al. Pre-eclampsia. Lancet. 2010;376(9741):631–644.
- Dhariwal NK, Lynde GC. Update in the Management of Patients with Preeclampsia. Anesthesiol Clin. 2017;35(1):95–106.
- Pillay P, Moodley K, Moodley J, et al. Placenta-derived exosomes: potential biomarkers of preeclampsia. Int J Nanomedicine. 2017;12:8009–8023.
- Hansson SR, Naav A, Erlandsson L. Oxidative stress in preeclampsia and the role of free fetal hemoglobin. Front Physiol. 2014;5:516.
- Lu X. The Role of Exosomes and Exosome-derived microRNAs in Atherosclerosis. Curr Pharm Des. 2017;23(40):6182–6193.
- Alenquer M, Amorim MJ. Exosome Biogenesis, Regulation, and Function in Viral Infection. Viruses. 2015;7(9):5066–5083.
- Sun L, Li D, Song K, et al. Exosomes derived from human umbilical cord mesenchymal stem cells protect against cisplatin-induced ovarian granulosa cell stress and apoptosis in vitro. Sci Rep. 2017;7(1):2552.
- Zhang J, Li S, Li L, et al. Exosome and exosomal microRNA: trafficking, sorting, and function. Genomics Proteomics Bioinformatics. 2015;13(1):17–24. .
- Tang L, Yin Y, Liu J, et al. MiR-124 Attenuates Osteoclastogenic Differentiation of Bone Marrow Monocytes Via Targeting Rab27a. Cell Physiol Biochem. 2017;43(4):1663–1672. .
- Hu TX, Guo X, Wang G, et al. MiR133b is involved in endogenous hydrogen sulfide suppression of sFlt-1 production in human placenta. Placenta. 2017;52:33–40.
- Wang X, Bu J, Liu X, et al. miR-133b suppresses metastasis by targeting HOXA9 in human colorectal cancer. Oncotarget. 2017;8(38):63935–63948. .
- Zhen Y, Liu J, Huang Y, et al. miR-133b Inhibits Cell Growth, Migration, and Invasion by Targeting MMP9 in Non-Small Cell Lung Cancer. Oncol Res. 2017;25(7):1109–1116. .
- Kong C, Sun L, Zhang M, et al. miR-133b Reverses the Hydrosalpinx-induced Impairment of Embryo Attachment Through Down-regulation of SGK1. J Clin Endocrinol Metab. 2016;101(4):1478–1489. .
- Talarico C, Dattilo V, D’Antona L, et al. SGK1, the New Player in the Game of Resistance: chemo-Radio Molecular Target and Strategy for Inhibition. Cell Physiol Biochem. 2016;39(5):1863–1876. .
- Liang X, Lan C, Jiao G, et al. Therapeutic inhibition of SGK1 suppresses colorectal cancer. Exp Mol Med. 2017;49(11):e399. .
- Witcher PM. Preeclampsia: acute Complications and Management Priorities. AACN Adv Crit Care. 2018;29(3):316–326.
- Song X, Luo X, Gao Q, et al. Dysregulation of LncRNAs in Placenta and Pathogenesis of Preeclampsia. Curr Drug Targets. 2017;18(10):1165–1170. .
- Skalis G, Katsi V, Miliou A, et al. MicroRNAs in Preeclampsia. MicroRNA. 2019;8(1):28–35. .
- Cheng Y, Jia B, Wang Y, et al. miR-133b acts as a tumor suppressor and negatively regulates ATP citrate lyase via PPARgamma in gastric cancer. Oncol Rep. 2017;38(5):3220–3226. .
- Yang L, Hou J, Cui X-H, et al. MiR-133b regulates the expression of CTGF in epithelial-mesenchymal transition of ovarian cancer. Eur Rev Med Pharmacol Sci. 2017;21(24):5602–5609. .
- Matschke J, Wiebeck E, Hurst S, et al. Role of SGK1 for fatty acid uptake, cell survival and radioresistance of NCI-H460 lung cancer cells exposed to acute or chronic cycling severe hypoxia. Radiat Oncol. 2016;11:75.
- Liu W, Wang X, Liu Z, et al. SGK1 inhibition induces autophagy-dependent apoptosis via the mTOR-Foxo3a pathway. Br J Cancer. 2017;117(8):1139–1153. .
- Li P, Hao Y, Pan F-H, et al. SGK1 inhibitor reverses hyperglycemia partly through decreasing glucose absorption. J Mol Endocrinol. 2016;56(4):301–309. .
- Wang QY, Zhou C-X, Zhan M-N, et al. MiR-133b targets Sox9 to control pathogenesis and metastasis of breast cancer. Cell Death Dis. 2018;9(7):752. .
- Sugiyama T, Taniguchi K, Matsuhashi N, et al. MiR-133b inhibits growth of human gastric cancer cells by silencing pyruvate kinase muscle-splicer polypyrimidine tract-binding protein 1. Cancer Sci. 2016;107(12):1767–1775. .
- Cheng N, Wang GH. miR-133b, a microRNA targeting S1PR1, suppresses nasopharyngeal carcinoma cell proliferation. Exp Ther Med. 2016;11(4):1469–1474.
- Li D, Zhang P, Yao X, et al. Exosomes Derived From miR-133b-Modified Mesenchymal Stem Cells Promote Recovery After Spinal Cord Injury. Front Neurosci. 2018;12:845.
- Ren ZW, Zhou J-G, Xiong Z-K, et al. Effect of exosomes derived from MiR-133b-modified ADSCs on the recovery of neurological function after SCI. Eur Rev Med Pharmacol Sci. 2019;23(1):52–60. .
- Xin H, Li Y, Buller B, et al. Exosome-mediated transfer of miR-133b from multipotent mesenchymal stromal cells to neural cells contributes to neurite outgrowth. Stem Cells. 2012;30(7):1556–1564.