
ABSTRACT
Studies have found that LINC00467 is an important regulator of cancer. However, the function of LINC00467 in glioma cell is unclear. Therefore, this experimental design based on LINC00467 to explore its mechanism of action in glioma cell. RT-qPCR was used to detect the expression of LINC0046 and miR-200a in glioma cell lines. MTT assay, Edru assay and Transwell assay and flow cytometry were used to detect the effects of LINC0046 and miR-200a on PC cell proliferation, migration and apoptosis. Target gene prediction and screening, luciferase reporter assays were used to validate downstream target genes for LINC0046 and miR-200a. Western blotting was used to detect the protein expression of E2F3. The tumor changes in mice were detected by in vivo experiments in nude mice. LINC00467 was up-regulated in glioma cells. Knockdown of LINC00467 inhibited the viability, migration and invasion of glioma cells. In glioma cells, miR-200a was significantly reduced, while E2F3 was significantly rised. LINC00467 negatively regulated the expression of miR-200a in gliomas, while miR-200a negatively regulated the expression of E2F3 in gliomas. INC00467 promoted the development of glioma by inhibiting miR-200a and promoting E2F3 expression. LINC00467 may be a potential therapeutic target for gliomas.
Introduction
Glioma is the most common tumor in the central nervous system. Its invasiveness and recurrence rate are higher than other intracranial tumors [Citation1,Citation2]. At the same time, due to its poor prognosis and recurrence, it has a serious impact on the survival of patients [Citation3]. With the continuous development of science and technology, the standard treatment of malignant glioma using standard surgery, radiotherapy and chemotherapy is still not optimistic [Citation4,Citation5]. However, with the advancement of precision medicine, new diagnostic systems based on molecular genetic characteristics are gaining popularity [Citation6,Citation7]. To control or inhibit the occurrence and development of glioma by regulating key regulatory factors and to achieve targeted treatment of glioma is the development goal of precise cancer therapy nowadays [Citation3,Citation8]. Therefore, it is of great significance for the effective treatment of malignant sputum glioma to understand the molecular mechanism of regulation during the development of malignant glioma and identify target molecules that inhibit glioma.
Long-chain non-coding RNAs (lnc RNAs) have no apparent protein coding ability [Citation9,Citation10]. Lnc RNAs can regulate the expression of adjacent genes by cis-acting, or affect the distant genes through trans-acting, thereby achieving the purpose of regulating the biological processes of tumor cells [Citation11]. In recent years, more and more researchers have devoted themselves to the study of lnc RNAs, and have found that lnc RNAs are dysregulated in a variety of tumors and are diverse in many biological processes such as carcinogenesis, metastasis, and angiogenesis [Citation12,Citation13]. Studies have found that a variety of lnc RNA are abnormally expressed in glioma, and they regulate the development of glioma by stimulating or inhibiting biological processes [Citation14,Citation15]. LINC00467 is a recently discovered new lnc RNA. Studies have found that it plays an critical role in the regulation of the development of neuroblastoma, colorectal cancer and lung adenocarcinoma [Citation16,Citation17]. However, the mechanism of action of LINC00467 in glioma remains unclear.
The competitive regulatory network formed between LncRNA and mRNA plays an critical regulatory role in the metastasis and apoptosis of glioma [Citation18]. MicroRNA (mi RNA) are key nodes in the network that regulate the life function of signaling in cells [Citation19,Citation20]. Mi RNA-mediated post-transcriptional regulation is involved in the regulation of many cell life processes such as cell cycle progression, differentiation and stress response [Citation21,Citation22]. The expression of mi RNAs is tissue-specific and it has been shown to be significantly abnormal in the expression of various cancers [Citation23,Citation24]. It has been reported in the literature that miR-200a participates in the occurrence and development of tumors by affecting the biological processes of tumor cell migration through the target gene [Citation25,Citation26]. Studies have shown that the expression level of miR-200a in cervical cancer tissues is significantly higher [Citation27]. However, the current expression, role and target of miR-200a in gliomas are still unclear. In recent years, several studies have found that lnc RNA may regulate downstream target genes through miRNA adsorption processes [Citation28]. The E2F family was first discovered in the adenovirus E2 gene [Citation29]. At present, eight E2F members have been found. Due to structural differences, the functions of different members are not the same. E2F3 is closely related to the occurrence of tumors such as liver cancer, breast cancer and colon cancer [Citation30]. It is considered to be an important biomarker for malignant tumors and an important target for treatment [Citation31]. Therefore, it was speculated that LINC00467 may regulate the progression of glioma through miR-200a/E2F3. The main purpose of this study was to explore the mechanism of LINC00467 regulation of glioma, and provide a theoretical basis for the search for new drug targets.
Materials and method
Cell line culture
The glioma cell lines (U87, U251, SHG-44 and U-118 MG), the human astrocyte cell line (HA) were obtained from the BeNa Culture Collection (Beijing, China). All cells were passaged in high glucose DMEM (Invitrogen, Carlsbad, CA, USA) containing 10% FBS(Invitrogen, Carlsbad, CA, USA). All cells were incubated at 37°C in a cell incubator containing 5% CO2.
QRT-PCR
Total RNA in cells was extracted by TRIzol reagent (Boyao, Shanghai, China). After the reverse transcription reaction, qRT-PCR was performed using a ViiATM 7 real-time PCR system (Life Technologies, Grand Island, NY). The expression levels of LINC00467 and miR-200a were calculated by the 2-ΔΔCT method. The expression level of LINC00467 was normalized to GADPH, while the level of miR-200a was normalized to U6. qRT-PCR specific experimental methods were performed with reference to the literature [Citation32]. The primer sequences were as follows:
GAPDH forward 5′- GTC AAC GGA TTT GGT CTG TATT-3′;
reverse 5′- AGT CTT CTG GGT GGC AGT GAT-3′
U6 forward CTCGCTTCGGCAGCACA
reverse AACGCTTCACGAATTTGCGT
miR-200a forward TAACACTGTCTGGTAACGATGT
reverse ATCGTTACCAGACAGTGTTATT
LINC00467 forward GCGTAGGCCGGACATTTCTA
reverse CCTGCCATGTTGGAAACTGC
Cell transfection
Negative control (NC), miR-200a mimetic, miR-200a inhibitor, sh-NC, si-LINC00467, pcDNA3.1 plasmid and pcDNA3.1-E2F3 were all obtained from Genepharma. The cell suspension was prepared and incubated for 24 hours. Three hours before transfection, glioma cells were incubated with serum-free medium and transfected with Lipofectamine 2000.Synthetic oligonucleotide primers. A fragment targeting linc00467 inserted into a lentiviral vector was used as a linc00467-shRNA, and a non-targeting fragment inserted into a lentiviral vector was used as a control-shRNA.
Dual luciferase reporter assay
The wild-type or mutant LINC00467 or E2F3 3ʹ UTR sequence and the miR-200a mimic or miR NC pcDNA3.1 plasmid vector were co-transfected with U87 cells. The LINC00467 and E2F3 WT and MUT 3ʹ UTR were purchased from Gene-Pharma (Shanghai, China). After 48 h of transfection, the luciferase activity was measured using a dual luciferase assay system (Promega)
MTT assay
The log phase transfected glioma cells were collected, the cell suspension concentration was adjusted, 96-well plates were taken, and the density of the cells to be tested was adjusted to 103 to 104 per well. The cells were incubated for 24 h. Each well was incubated with 20 μL of MTT solution for 4 h. 150 μL of DMSO was added and shaken to dissolve the crystals sufficiently. The absorbance of each well was measured at 570 nm.
Transwell assay
Each group of cells was treated with 2.5 μg/mL mitomycin C for 24 h to inhibit cell division. After the culture, appropriate amount of trypsin digestion was added, washed with PBS buffer and resuspend the cells in serum-free medium. The cells were cultured in the basement with complete medium for 24 hours. The superfluous medium was discarded. The cells were fixed with 4% polyformaldehyde for 30 minutes. Then cells were stained with 0.1% crystal violet for 10 minutes. Six visual fields were observed under microscope and randomly selected for photography and counting.
Flow cytometry (FCM) apoptosis assay
Apoptosis was measured by FITC Annexin V Apoptosis Detection Kit (BD, Franklin Lakes, NJ, USA). After the transfected cells were collected for washing, they were incubated with 500 μl of binding buffer, 5 μl of FITC Annexin V and 10 μl of propidium iodide (PI). The apoptotic rate was determined by using flow cytometry (FACS Calibur, USA). Specific experimental methods are carried out in reference to the literature [Citation33].
Tumor xenograft
Male athymic BALB/c nude mice were purchased from the National Experimental Animal Center (Beijing, China). All experiments in nude mice were carried out in strict accordance with the protocol approved by the Experimental Animal Protection Management Group of Zhuhai People’s Hospital. Mouse xenograft models were constructed by subcutaneous injection of 5 × 10⁷ GSC-U87 and non-GSC-U87 cells (n = 5 per group). Tumor size was measured twice a week. All nude mice were sacrificed after 2 weeks and tumors were dissected for qPCR or Western blot analysis experiments. Animal experiments were carried out in strict accordance with the recommendations of the National Institutes of Health Laboratory Animal Care and Use Guidelines.
RIP pull down assay
The miR-200a, miR-200a-mut and negative control (NC) probes were synthesized by GenePharma (Shanghai, China). RNA pulldown assays were performed using a magnetic RNA protein pull-down kit (Thermo Fisher, NY, USA). U87 cells were transfected with biotinylated miRNAs and then incubated with M-280 streptavidin magnetic beads (Invitrogen, Carlsbad, Calif., USA). Finally, the level of lncRNA LINC00467 was determined by qRT-PCR.
EdU assay
24 hours after transfection, the cells were digested and seeded into 96-well plates at a density of 30–40%. After a further 24 hours of culture, the EdU proliferation assay was performed using an EdU Apollo in vitro imaging kit (RiboBio, Guangzhou, China).
Immunohistochemistry
All tissues were fixed with 10% formalin, routinely dehydrated, embedded in paraffin, and serially sectioned at 4 μm thick. After heat-induced epitope repair, incubation with monoclonal antibodies against human Ki-67 (1:200, Abcam) was performed. Sections were assessed by light microscopy, and two pathologists assessed the cellular localization and immunostaining levels of the proteins in the sections.
Western blot analysis
The transfected cells were collected, total protein was extracted, and the protein concentration was quantified using the BCA Protein As-say Kit. It was incubated with anti-EZH2 antibody (1:500, Proteintech, Chicago, USA) and anti-GAPDH antibody (1:1000, Shidai, Beijing, China) overnight. Then 1:5 000 labeled anti-rabbit secondary antibody was added to incubate with for 1 h. Western blot analysis Specific experimental methods were performed with reference to the literature [Citation34].
TUNEL analysis
After the tissue was fixed with 4% paraformaldehyde, it was embedded in paraffin, sliced, dewaxed, hydrated, and then tested according to the kit instructions(YEASEN,Shanghai,China).
Statistical methods
The monitoring data were analyzed by SPSS19.0 statistical software. The results of data analysis were showed as mean ± standard deviation (mean ±SD). Multigroup data analysis was based on one-way ANOVA. LSD test was used for subsequent analysis. P < 0.05 meant the difference was significant.
Result
LINC00467 was up-regulated in glioma cell lines and LINC00467 knockdown suppressed the viability, migration and invasion of glioma cells
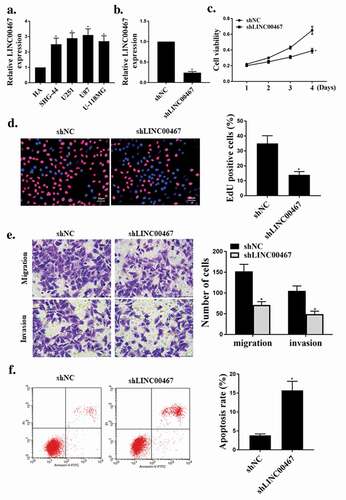
First, the expression levels of LINC00467 in four glioma cell lines (U87, U251, SHG44, U-118 MG) were analyzed. As shown in ), contrasted with the normal cell line HA, the expression level of LINC00467 was significantly rised in glioma cell line (U87, U251, SHG44, U-118 MG) (P < 0.05). As shown in ), the expression level of LINC00467 was significantly reduced in the si LINC00467 group contrasted with that in the shNC group (P < 0.05), indicating successful transfection. As shown in ), knockdown of LINC00467 significantly reduced viability and cell proliferation of glioma cells (P < 0.05). At the same time, knockout of LINC00467 also significantly inhibited the migration and invasion activity of glioma cells (P < 0.05) ()), and knockdown of LINC00476 significantly increased apoptosis (P < 0.05) ()). These results indicated that knockdown of LINC00476 effectively inhibited the growth and invasion of glioma cells and induced apoptosis.
Figure 1. shLINC00476 inhibited viability, migration and invasion of glioma cells.(a). Relative expression level of shLINC00476 in glioma cell lines. (b). mRNA expression level of shLINC00476 in U87 cells. (c). MTT assay for cell viability. (d). Edu for cell proliferation. E. transwell measured cell migration and invasion. (f). Flow cytometry determined apoptosis. N = 3, * p < 0.01, ** p < 0.05
LINC00467 targeted miR-200a and miR-200a targeted E2F3
We predicted by the online prediction tool Starbase v2.0 and miR-200a was identified as a potential target for LINC00467 ()). The luciferase reporter gene assay showed that the luciferase activity of the miR-200a mimetic and the LINC00467-wt co-transfected U87 cells was significantly decreased, but the luciferase activity of LINC00467-mut did not change significantly()). The RIP pull-down assay further validated the luciferase reporter gene assay results ()). As shown in ), the expression level of miR-200a was significantly increased in the sh LINC00467 group compared with that in the shNC group (P < 0.05), which further confirmed the relationship between LINC00467 and miR-200a.
Figure 2. LINC00467 targeted miR-200a.miR-200a targets E2 F3.(a). MiR-200a was predicted to be a potential target for LINC00467. (b). Relative luciferase activity in cells co-transfected with and miR-200a mimics and LINC00467. (c). RIP pulldown assay. (d). The expression level of miR-200a mRNA in U87 cells. (e). E2 F3 was a target gene of miR-200a. (f). Analysis of relative luciferase activity in miR-200a mimics and E2 F3-co-transfected cells. (g) and (h).E2 F3 protein expression levels in U87 cells. N = 3, * p < 0.01, ** p < 0.05
In addition, we predicted by the online prediction tool Starbase v2.0 and E2F3 was identified as a potential target for miR-200a ()). The luciferase reporter gene assay showed a significant decrease in luciferase activity in U87 cells co-transfected with miR-200a mimics and E2F3-wt. There was no significant change in luciferase activity of E2F3-mut ()). Meanwhile, in glioma cells, miR-200a mimic and sh-LINC00467 significantly down-regulated E2F3 protein expression levels (P < 0.05) contrasted with that in the control group ()). It demonstrated the negative regulatory effect of microRNA-200a on E2F3 expression.
miR-200a overexpression suppressed the viability, migration and invasion of glioma cells
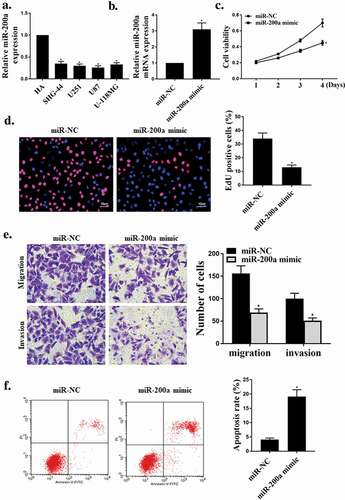
Next, the expression levels of miR-200a in four glioma cell lines (U87, U251, SHG44, U-118 MG) were analyzed. As shown in ), contrasted with the normal cell line HA, the expression level of miR-200a was significantly reduced in the tumor cell lines (P < 0.05). As shown in ), the expression level of miR-200a was significantly increased in the miR-200a mimic group contrasted with that in the miR-NC group (P < 0.05), indicating successful transfection. As shown in ), miR-200a mimic significantly reduced viability and cell proliferation of glioma cells (P < 0.05). At the same time, miR-200a mimic also significantly inhibited the migration and invasion activity of glioma cells (P < 0.05) ()), and miR-200a mimic significantly increased apoptosis (P < 0.05) ()). These results indicated that miR-200a overexpression effectively inhibited the growth and invasion of glioma cells and induced apoptosis.
Figure 3. Overexpression of miR-200a inhibited viability, migration and invasion of glioma cells. (a). Relative expression levels of miR-200a in glioma cell lines. (b). mRNA expression level of miR-200a in U87 cells. (c). MTT assay for cell viability. (d). Edu analyzed cell proliferation. (e). transwell measured cell migration and invasion. (f). Flow cytometry determined apoptosis. N = 3, * p < 0.01, ** p < 0.05
The effects of shLIN00476 on cell growth was mediated by miR-200a
As shown in ), shLINC00467 significantly reduced cell viability and cell proliferation compared with that in the control group (P < 0.05), while co-transfection of shLINC00467 and miR-200a inhibitors reversed the effect of shLINC00467 on cell viability and proliferation. (P < 0.05). As shown in ), the shLINC00476 significantly reduced cell migration and invasion in U87 cells (P < 0.05), while co-transfection of shLINC00467 and miR-200a inhibitors reversed the effect of shLINC00467 on cell migration and invasion (P < 0.05). As shown in ), shLINC00476 significantly increased apoptosis (P < 0.05), and co-transfection of shLINC00467 and miR-200a inhibitors reversed the effect of shLINC00467 on apoptosis (P < 0.05).
Figure 4. shLIN00476 affected cell growth through street miR-200a. (a). MTT measured cell viability. (b). Edu measured cell proliferation. (c). transwell measured cell migration and invasion. (d). Flow cytometry to determine apoptosis. N = 3, * p < 0.01, ** p < 0.05
The effects of miR-200a mimic on cell growth was mediated by E2F3
As shown in ), contrasted with the control group, miR-200a mimic significantly reduced cell viability and cell proliferation(P < 0.05), while co-transfection of miR-200a mimic with pcDNA-E2F3 reversed the effects of miR-200a mimic on cell viability and proliferation (P < 0.05). As shown in ), miR-200a mimic significantly reduced cell migration and cell invasion (P < 0.05), while co-transfection of miR-200a mimic with pcDNA-E2F3 reversed the effect of miR-200a mimic on cell migration and invasion (P < 0.05). As shown in ), miR-200a mimic significantly increased apoptosis (P < 0.05), while co-transfection of miR-200a mimic with pcDNA-E2F3 reversed the effect of miR-200a mimic on apoptosis (P < 0.05).
Figure 5. E2 F3 mediated the effect of miR-200a on cell growth. (a). MTT measured cell viability. (b). Edu measured cell proliferation. (c). transwell measured cell migration and invasion. (d). Flow cytometry to determine apoptosis. N = 3, * p < 0.01, ** p < 0.05
LINC00467-miR-200a axis regulated glioma cell tumor growth in vivo
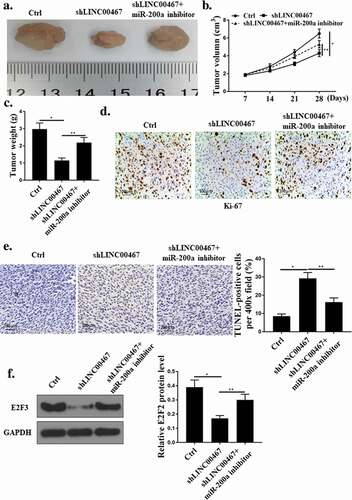
As shown in –c), the tumor volume and weight of the mice in the shLINC00467 group were significantly lower than those in the Ctrl group (P < 0.05), while co-transfection of shLINC00467 with miR-200a inhibitors reversed the effect of shLINC00467 on weight and volume of mouse tumors (P < 0.05). In addition, as shown in ), the number of Ki67-positive cells in the tumor tissues collected in the shLINC00467 group was reduced (P < 0.05), and the Ki67-positive cells in the tumor tissues were significantly increased after co-transfection with shLINC00467 and miR-200a inhibitors (P < 0.05). ShLINC00467 was able to induce apoptosis (P < 0.05), while the apoptosis rate was significantly reduced after co-transfection of shLINC00467 with miR-200a inhibitors ()). As shown in ), the expression level of E2F3 protein in shLINC00467 group was significantly decreased (P < 0.05), while co-transfection of shLINC00467 with miR-200a inhibitors significantly up-regulated E2F3 protein expression (P < 0.05).
Figure 6. LINC00467-miR-200a axis regulated the growth of glioma cell tumors. (a). Image of tumor tissue. (b). Tumor volume. (c). Tumor weight. (d). Ki67 immunohistochemical staining. (e). TUNEL staining. F. E2 F3 protein expression level. N = 3, * p < 0.01, ** p < 0.05
Discussion
Glioma is the most common primary neurological malignancy and is still one of the worst prognosis in systemic tumors [Citation35,Citation36]. Because traditional treatment methods have not effectively improved the prognosis of gliomas, more and more scholars are constantly looking for new targets for the treatment of glioma [Citation37]. Despite surgery, radiotherapy and temozolomide-based adjuvant chemotherapy, the median survival time of low-grade gliomas is 11.6–16.7 years [Citation18,Citation38]. There is still no ideal treatment. Studies have shown that malignant gliomas exhibit the characteristics of proliferation, migration and invasion at an early stage [Citation39]. Therefore, in view of the characteristics of tumor invasion, it is urgent to find new targets for inhibiting the growth of glioma, which is of great significance for guiding clinical diagnosis, treatment and prognosis.
Recent studies have shown that Lnc RNA can act as a regulator of almost all cellular processes [Citation40]. Recent studies have shown that lnc RNAs have multiple biological functions in cell growth, and the expression of some lnc RNAs in cancer development and progression is significantly changed [Citation41]. Studies have shown that lnc RNAs are a key factor in the pathogenesis of gliomas, and some lnc RNAs may be potential biomarkers and drug therapeutic targets for gliomas [Citation42]. For example, studies have found that upregulation of lnc RNA AB073614 expression is associated with lower survival rates in glioma patients. Inhibition of AB073614 expression reduces cellular invasion of vimentin expression by increasing E-cadherin and reducing cell invasion [Citation43]. In addition, studies have found that LncRNA CCAT1 is involved in the proliferation of glioma by targeting miR-410 [Citation44]. LncRNA Linc00467 is located at 1q32.3. Studies have shown that LINC00467 is highly expressed in colorectal cancer and promotes the migration and proliferation of colon cancer [Citation16]. The results of this study showed that the expression of LINC00467 was significantly increased in glioma cells. Knockout of LINC00467 was reduced the viability, proliferation, migration and invasion of glioma cells and induced apoptosis. Knockdown of LINC00467 inhibited tumor growth in mice. So LINC00467 can be used as an oncogene to control the development of glioma.
Recent studies have shown that the interaction between mi RNAs and lnc RNAs can regulate each other’s expression, thus plays an critical role of cells [Citation44,Citation45]. In recent years, studies have found that a variety of mi RNAs are abnormally expressed in gliomas, which are closely related to the biological characteristics of gliomas [Citation46]. For example, quantitative analysis of miRNAs in glioma revealed that there are significant differences in the expression of 13 kinds of microRNAs, of which the difference was most obvious in the up-regulation of miR-21 and the down-regulation of miR-128-l [Citation47]. miR-200a plays an critical role in the formation of epithelial cells. The miR-200 family members can inhibit the formation of epithelial cells [Citation48]. In this study, it was found that miR-200a was a target gene of LINC00467, and miR-200a was rised in glioma cells. Overexpression of miR-200a significantly reduced the activity, proliferation, migration and invasion of glioma cells and induced cells apoptosis. Co-transfection of siLINC00467 and with inhibitors reversed the effects of siLINC00467 on cell viability, proliferation, migration, invasion and apoptosis. In vivo mouse experiments indicated that co-transfection of siLINC00467 with miR-200a inhibitor reversed the effect of shLINC00467 on tumor weight and volume in mice. These results indicated that LINC00467 may promote glioma growth by modulating miR-200a.
In recent years, there have been reports of interactions between micRNA and IncRNA, targeting and regulating related pathways, thus affecting the occurrence and development of tumors [Citation49]. The E2F transcription factor family consists of eight members (E2F1-8) that activate the early region 2 (E2) promoter and participate in cell growth and differentiation by regulating the cell cycle [Citation50]. The nuclear transcription factor E2F3 is involved in cell growth and differentiation, thereby regulating tumorigenesis and development [Citation31]. However, there are few studies on E2F3 in gliomas. In this study, it was found that E2 F3 was a potential target for miR-200a. In addition, co-transfection of miR-200a mimic with pcDNA-E2F3 reversed the effects of miR-200a mimic on cell viability, proliferation, migration, invasion and apoptosis. The expression level of E2F3 protein was significantly decreased in siLINC00467 group, while co-transfection of sILINC00467 with miR-200a inhibitor was able to significantly upregulate E2F3 protein expression levels. The results indicated that LINC00467 was able to promote glioma proliferation by modulating the miR-200a/E2F3 axis.
Conclusion
LINC00467 can promote the development of glioma by regulating miR-200a/E2F3 axis, suggesting that LINC00467 may be a potential oncogene of glioma. It would experimental basis for clinical prognosis judgment and further targeted interventional therapy of this tumor.
Acknowledgments
Not applicable.
Disclosure statement
The authors declare that they have no competing interests.
Additional information
Funding
References
- Bush NAO, Chang SM, Berger MS. Current and future strategies for treatment of glioma. Neurosurg Rev. 2017;40(1):1–14.
- Khain E, Sander LM, Stein AM. A model for glioma growth. Complexity. 2017;11(2):53–57.
- Yang Y, Gao X, Zhang M, et al. Novel role of FBXW7 circular RNA in repressing glioma tumorigenesis. J Natl Cancer Inst. 2018;110:3.
- Klein M, Duffau H, De WHPC. Cognition and resective surgery for diffuse infiltrative glioma: an overview. J Neurooncol. 2012;108(2):309–318.
- Pessina F, Navarria P, Cozzi L, et al. Value of surgical resection in patients with newly diagnosed grade III glioma treated in a multimodal approach: surgery, chemotherapy and radiotherapy. Ann Surg Oncol. 2016;23(9):1–7.
- Reifenberger G, Weber T, Weber RG, et al. Chordoid glioma of the third ventricle: immunohistochemical and molecular genetic characterization of a novel tumor entity. Brain Pathol. 2010;9(4):617–626.
- Zhang SS, Lin YU. Research progress of MRI in glioma grading and molecular genetic biomarkers. Chin J Contemp Neurol Neurosurg. 2017;1:83–87.
- Gu G, Li W, Zhang J, et al. MicroRNA-384 inhibits proliferation migration and invasion of glioma by targeting at CDC42. Onco Targets Ther. 2018;11:4075–4085.
- Richards EJ, Zhang G, Li ZP, et al. Long non-CODING RNAs (LncRNA) regulated by transforming growth factor (TGF) β LncRNA-HIT-MEDIATED TGFβ-INDUCED EPITHELIAL TO MESENCHYMAL TRANSITION IN MAMMARY EPITHELIA. J Biol Chem. 2015b;290(11):6857.
- Xiong Y, Jia M, Yuan J, et al. STAT3-regulated long non-coding RNAs lnc-7SK and lnc-IGF2-AS promote hepatitis C virus replication. Mol Med Rep. 2015;12(5):6738.
- Goyal N, Kesharwani D, Datta M. Lnc-ing non-coding RNAs with metabolism and diabetes: roles of lncRNAs. Cell Mol Life Sci Cmls. 2018;75(Suppl):1.
- Kalmar A, Nagy ZB, Galamb O, et al. Abstract 165: common long noncoding RNAs (lncRNA) with altered expression levels in colorectal adenoma and carcinoma. Cancer Res. 2015;75(15 Supplement): 165–165.
- Richards EJ, Zhang G, Li ZP, et al. Long non-coding RNAs regulated by TGFβ: lncRNA-HIT mediated TGFβ-induced epithelial to mesenchymal transition in mammary epithelia. J Biol Chem. 2015a;290(11):6857–6867.
- Cui Y, Yi L, Zhang MM, et al. WITHDRAWN: knockdown of LncRNA HOXA11 antisense promotes glioma cell apoptosis via sponging MiR-140-5p. Oncol Res. 2017. DOI:https://doi.org/10.3727/096504017X14972669062547
- Kiang MY, Zhang XQ, Leung KK. Long non-coding RNAs: the key players in glioma pathogenesis. Cancers (Basel). 2015;7(3):1406–1424.
- Atmadibrata B, Liu PY, Sokolowski N, et al. The novel long noncoding RNA linc00467 promotes cell survival but is down-regulated by N-Myc. Plos One. 2014;9(2):e88112.
- Guo S, Pridham K, Zhi S. Abstract A04: LINC00467 regulates the autophagy signaling pathway STK11/AMPK. Cancer Res. 2016;76(6 Supplement):A04–A04.
- Ke Z, Chi Z, Hui Y, et al. Knockdown of long non-coding RNA NEAT1 inhibits glioma cell migration and invasion via modulation of SOX2 targeted by miR-132. Mol Cancer. 2018;17(1):105.
- Amin M, Lam AK. Current perspectives of mi-RNA in oesophageal adenocarcinoma: roles in predicting carcinogenesis, progression and values in clinical management. Exp Mol Pathol. 2015;98(3):411–418.
- Ashraf NM, Imran K, Kastner DW, et al. Potential involvement of mi-RNA 574-3p in progression of prostate cancer: A bioinformatic study. Mol Cell Probes. 2017;36:21–28.
- Chakraborty C, Sharma AR, Sharma G, et al. Therapeutic miRNA and siRNA: moving from bench to clinic as next generation medicine. Mol Ther Nucleic Acids. 2017;8(C):132–143.
- Zeng Y, Wang KX, Xu H, et al. Integrative miRNA analysis identifies hsa‐miR‐3154, hsa‐miR‐7‐3, and hsa‐miR‐600 as potential prognostic biomarker for cervical cancer. J Cell Biochem. 2018;119:2.
- Dou Z, Lin S, Dai C, et al. Pooling-analysis for diagnostic and prognostic value of MiRNA-100 in various cancers. Oncotarget. 2017;8(37):62703–62715.
- Mollaie HR, Monavari SH, Arabzadeh SA, et al. RNAi and miRNA in viral infections and cancers. Asian Pac J Cancer Prev Apjcp. 2013;14(12):7045–7056.
- Uhlmann S, Zhang JD, Schwäger A, et al. miR-200bc/429 cluster targets PLCγ1 and differentially regulates proliferation and EGF-driven invasion than miR-200a/141 in breast cancer. Oncogene. 2010;29(30):4297–4306.
- Wang B, Koh P, Winbanks C, et al. miR-200a Prevents renal fibrogenesis through repression of TGF-β2 expression. Diabetes. 2011;60(1):280–287.
- Zhu H, Zheng T, Yu J, et al. LncRNA XIST accelerates cervical cancer progression via upregulating Fus through competitively binding with miR-200a. Biomed Pharmacothe. 2018;105:789.
- Ye S, Yang L, Zhao X, et al. Bioinformatics method to predict two regulation mechanism: TF-miRNA-mRNA and lncRNA-miRNA-mRNA in pancreatic cancer. Cell Biochem Biophys. 2014;70(3):1849–1858.
- Sang XB, Zong ZH, Wang LL, et al. E2F-1 targets miR-519d to regulate the expression of the ras homolog gene family member C. Oncotarget. 2017;8(9):14777–14793.
- Kort EJ, Farber L, Tretiakova M, et al. The E2F3-oncomir-1 axis is activated in Wilms’ tumor. Cancer Res. 2008;68(11):4034–4038.
- Olsson AY, Feber A, Edwards S, et al. Role of E2F3 expression in modulating cellular proliferation rate in human bladder and prostate cancer cells. Oncogene. 2007;26(7):1028–1037.
- Guénin S, Mauriat M, Pelloux J, et al. Normalization of qRT-PCR data: the necessity of adopting a systematic, experimental conditions-specific, validation of references. J Exp Bot. 2009;60(2):487–493.
- Xu XY, Nie XC, Ma HY, et al. Flow cytometry method analysis of apoptosis: no significant difference between EDTA and EDTA-free trypsin treatment procedure. Technol Cancer Res Treat. 2015;14(2):237.
- Utermann G. Apolipoprotein E phenotyping from serum by Western blotting. Electrophoresis. 2010;7(11):492–495.
- Murthy V, Le H, Samaras D, et al. Center-focusing multi-task CNN with injected features for classification of glioma nuclear images. In IEEE Winter Conf Appl Comput Vis, vol. 1; 2017. pp. 834–841.
- Shi W, Cui X, Shi J, et al. Overcoming the blood–brain barrier for glioma-targeted therapy based on an interleukin-6 receptor-mediated micelle system. RSC Adv. 2017;7(44):27162–27169.
- Papagiannakopoulos T, Friedmannmorvinski D, Neveu P, et al. Pro-neural miR-128 is a glioma tumor suppressor that targets mitogenic kinases. Oncogene. 2012;31(15):1884.
- Honda N, Yagi K, Ding GR, et al. Radiosensitization by overexpression of the nonphosphorylation form of IκB-α in human glioma cells. J Radiat Res. 2018;43(3):283–292.
- Giladi M, Munster M, Schneiderman RS, et al. Tumor treating fields (TTFields) delay DNA damage repair following radiation treatment of glioma cells. Radiat Oncol. 2017;12(1):206.
- Guan YX, Zhang ZM, Chen XZ, et al. Lnc RNA SNHG20 participated in proliferation, invasion and migration of breast cancer cells via miR-495. J Cell Biochem. 2018;119. DOI:https://doi.org/10.1002/jcb.26588
- Grote P, Wittler L, Hendrix D, et al. The tissue-specific lncRNA Fendrr is an essential regulator of heart and body wall development in the mouse. Dev Cell. 2013;24(2):206–214.
- Wang W, Yang F, Zhang L, et al. LncRNA profile study reveals four-lncRNA signature associated with the prognosis of patients with anaplastic gliomas. Oncotarget. 2016;7(47):77225–77236.
- Hu L, Lv QL, Chen SH, et al. Up-regulation of long non-coding RNA ab073614 predicts a poor prognosis in patients with glioma. Int J Environ Res Public Health. 2016;13(4):433.
- Zhang S, Xiao J, Chai Y, et al. LncRNA-CCAT1 promotes migration, invasion, and EMT in intrahepatic cholangiocarcinoma through suppressing miR-152. Dig Dis Sci. 2017;62(11):1–9.
- Zhang G, Sun H, Zhang Y, et al. Characterization of dysregulated lncRNA-mRNA network based on ceRNA hypothesis to reveal the occurrence and recurrence of myocardial infarction. Cell Death Discov. 2018;4(1):35.
- Li N, Long B, Han W, et al. microRNAs: important regulators of stem cells. Stem Cell Res Ther. 2017;8(1):110.
- Ping Y, He X, Li X, et al. Identification of miR-128 and miR-21 in the cerebrospinal fluid as biomarker for the diagnosis of glioma. Int J Lab Med. 2014;18:46-47, 50.
- Eades G, Yao Y, Yang M, et al. miR-200a regulates SIRT1 expression and epithelial to mesenchymal transition (EMT)-like transformation in mammary epithelial cells. J Biol Chem. 2011;286(29):25992–26002.
- Qin L, Yang Y, Liu Q, et al. IncRNA F630028O10Rik contributes to suppress lung cancer in mice through inhibiting miR-223-3p and VEGF signaling pathway. Chest. 2016;149(4):A304–A304.
- Wang L, Chen H, Wang C, et al. Negative regulator of E2F transcription factors links cell cycle checkpoint and DNA damage repair. Proc Natl Acad Sci U S A. 2018;115(16):201720094.