
ABSTRACT
Purpose
This study aimed to explore the effect of GANT61 on regulating cell proliferation, cell apoptosis and cell cycle, and to investigate whether GANT61 would function in multiple myeloma (MM) via inhibiting Notch pathway. Methods: RPMI-8226 and U266 cells were treated by GANT61 (0, 2.5, 5.0, 10.0, 20.0, 30.0, 40.0, 50.0 μmol/L) for 18, 24 and 36 hours (h), and cell proliferation was detected by Cell Counting Kit 8. Then these cells were treated by GANT61 at 0, 2.5, 5.0, 10.0 μmol/L for 24 h or treated by 10.0 μmol/L GANT61 for 0, 18, 24 and 36 h, and cell apoptosis rate, apoptosis markers and cell cycle were detected by AV/PI, Western blot, and PI staining. Notch1, Jagged1, Jagged2 and Hes1 expressions were detected by qPCR and Western blot. Further rescue experiments were conducted by upregulating Notch1. Results: In RPMI-8226 and U266 cells, GANT61 inhibited cell proliferation, increased cell apoptosis rate and cell percentage of G1/G0 phase while decreased cell percentage of S phase in a dose- and time-dependent manner. Besides, GANT61 inhibited Notch1, Jagged1, Jagged2 and Hes1 expressions in a dose- and time-dependent manner as well. In rescue experiments, Notch1 upregulation attenuated the inhibition of cell proliferation, promotion of cell apoptosis, induction of G1/G0 cycle retardation and repression of Notch signaling pathway induced by GANT61 treatment in RPMI-8226 and U266 cells. Conclusions: GANT61 suppresses cell proliferation, promotes cell apoptosis and induces G1/G0 cycle retardation with a dose- and time-dependent manner through inhibiting Notch pathway in MM.
Abbreviations
MM: Multiple myeloma; Hh: Hedgehog; EMT: epithelial mesenchymal transition; AML: acute myeloid leukemia; GANT61: GLI antagonist; DMSO: dimethyl sulfoxide; CCK-8: Cell Counting Kit 8; C-Caspase 3: Cleaved Caspase 3; Bcl-2: B-cell lymphoma-2; RT-qPCR: real-time quantitative polymerase chain reaction; OD: optical density; PTCH1: Patched1
Introduction
Multiple myeloma (MM), a B-cell malignancy characterized by proliferation of malignant plasma cells in the bone marrow, leads to approximately 86,000 new cases annually worldwide, and accounts for around 1% of neoplastic diseases and about 13% of hematologic malignancies [Citation1–Citation4]. With the advent of therapeutic strategies such as proteasome inhibitors, immunomodulatory agents, corticosteroids, alkylators, as well as improvements in supportive care, treatment outcomes of MM have been improved with 5-year median survival of over 50%, while there are still patients who relapse and becoming resistant to current therapies. Thus, deeper understanding about underlying mechanisms of MM and exploring additional, efficient treatment options are imperative to improve the treatment outcomes [Citation2].
Gli family transcription factors are regarded as primary activators of Hedgehog (Hh) pathway, which is a highly conserved signaling pathway regulating the progenitor cell fate in normal development and homeostasis [Citation5,Citation6]. As a Gli inhibitor, GANT61 blocks the Gli function and acts downstream of cyclopamine to repress the Hh transcriptional regulation, which exhibits good efficiency in diminishing several cancers such as neuroblastoma, colon carcinoma and gastric cancer via multiple mechanisms including inhibiting p21 mediated cell cycle progression, promoting Fas signaling stimulated cell apoptosis, repressing DNA damage repair and epithelial mesenchymal transition [Citation7–Citation9]. Besides, GANT61 also presents potential as treatment for hematologic malignancies including myelodysplastic syndromes and acute myeloid leukemia (AML) [Citation5,Citation10,Citation11]. However, no study about the effect of GANT61 on treating MM has been reported. Considering the therapeutic effect of GANT61 on solid tumors and hematologic malignancies, we hypothesized that GANT61 might possess anti-tumor effect in MM as well. Furthermore, genetic or pharmacological inhibition of Notch pathway impedes the accumulation of Gli protein, which indicates that there might be a crosstalk between Notch and Hh pathways, and Notch signaling is considered as a critical pathway implicated in MM development and progression [Citation12–Citation14]. Thus, we further hypothesized that GANT61 might be efficient in treating MM via blocking Notch signaling pathway, while no evidence has been uncovered yet.
Therefore, we conducted this study to explore the effect of GANT61 on regulating cell proliferation, cell apoptosis and cell cycle. More importantly, we further investigated whether GANT61 function via inhibiting Notch pathway in MM.
Methods
Cells source and culture
MM cell lines RPMI-8226 and U266 were purchased from American Type Culture Collection (Manassas, USA) and cultured in Roswell Park Memorial Institute (RPMI) 1640 medium (Gibco, USA) supplemented with 10% fetal bovine serum (FBS) (Gibco, USA) and penicillin/streptomycin (10 mg/mL solution with dilution 1:100) (Thermo Fisher Scientific, USA) under 95% air and 5% CO2 condition at 37°C.
Drug preparation
GLI antagonist (GANT61) was purchased from Sigma-Aldrich Company (Missouri, USA), and dissolved in dimethyl sulfoxide (DMSO) (Sigma-Aldrich, USA) to an original concentration of 10 mM and stored at −20°C. The original solution was diluted to the final concentration and used to treat the cells in the following experiments.
Effect of GANT61 on cell proliferation, apoptosis and cell cycle in RPMI-8226 and U266 cells
RPMI-8226 and U266 cells seeded into 96-well plates, and were treated by GANT61 at final concentrations of 0, 2.5, 5.0, 10.0, 20.0, 30.0, 40.0, 50.0 μmol/L for 18, 24 and 36 hours (h), respectively. Then in each group, cell proliferation was detected using Cell Counting Kit 8 (CCK-8) (Dojindo Laboratories, Japan), and proliferation inhibition rate was calculated with 0 μmol/L GANT61 group as control. Besides, RPMI-8226 and U266 cells were seeded into 6-well or 24-well plates, and were treated by 0, 2.5, 5.0, 10.0 μmol/L GANT61 for 24 h. Then cell apoptosis rate was detected using Annexin V-FITC Apoptosis Detection Kit (BD, USA) and flow cytometry (BD, USA), cell apoptosis marker protein Cleaved Caspase 3 (C-Caspase 3), B-cell lymphoma-2 (Bcl-2), Bax and Survivin were detected by Western Blot, and cell cycle was detected using Tali™ Cell Cycle Kit (Invitrogen, USA) and flow cytometry (BD, USA), meanwhile, Cyclin D was detected by Western Blot. Furthermore, RPMI-8226 and U266 cells were seeded into 6-well or 24-well plates, and were treated by 10.0 μmol/L GANT61 for 0, 18, 24 and 36 h, then cell apoptosis rate, cell apoptosis markers and cell cycle were detected.
Effect of GANT61 on Notch signaling pathway in RPMI-8226 and U266 cells
PMI-8226 and U266 cells were seeded into 6-well plates, and were treated by 0, 2.5, 5.0, 10.0 μmol/L GANT61 for 24 h, then protein and mRNA expressions of Notch signaling pathway-related factors including Notch1, Jagged1, Jagged2, Hes1 were detected in each treatment group by Western Blot and real-time quantitative polymerase chain reaction (RT-qPCR). Besides, RPMI-8226 and U266 cells were also treated by 10.0 μmol/L GANT61 for 0, 18, 24 and 36 h, and protein as well as mRNA expressions of Notch1, Jagged1, Jagged2, Hes1 were also detected in each group. In order to confirm the influence of GANT61 on Gli 1, RPMI-8226 and U266 cells were treated by 10.0 μmol/L GANT61 for 24 h (GANT61 group), meanwhile, cells treated by DMSO with the similar conditions were used as the control (NC group), and protein expression of Gli 1 was detected by Western Blot.
Effect of Notch1 overexpression on attenuating GANT61 efficacy in RPMI-8226 and U266 cells
In order to further validate whether GANT61 functions in MM cells via inhibiting Notch signaling pathway, compensation experiments were performed. In brief, (1) the Notch1 overexpression plasmid and control overexpression plasmid were constructed by Shanghai GenePharma Company (Shanghai, China) using the vector pEX-1. (2) The Notch1 overexpression plasmid and control overexpression plasmid were transfected into RPMI-8226 and U266 cells with HilyMax (Dojindo, Japan), and were treated with or without 10.0 μmol/L GANT61. According to the transfected plasmids and treatment, cells were categorized into four groups: Control group (control overexpression plasmids transfection without GANT61 treatment), Notch1 group (Notch1 overexpression plasmids transfection without GANT61 treatment), Control+GANT61 group (control overexpression plasmids transfection with GANT61 treatment) and Notch1+ GANT61 group (Notch1 overexpression plasmids transfection with GANT61 treatment); (3) cell proliferation in each group was detected at 0, 18, 24 and 36 h after transfection using CCK8 (Dojindo Laboratories, Japan), cell apoptosis rate was detected at 24 h by Annexin V-FITC Apoptosis Detection Kit (BD, USA) and flow cytometry (BD, USA), cell apoptosis marker protein C-Caspase 3 and Bcl-2 were detected at 24 h by Western Blot, and cell cycle was detected at 24 h by Tali™ Cell Cycle Kit (Invitrogen, USA) and flow cytometry (BD, USA). (4) protein and mRNA expressions of Notch signaling pathway-related factors including Notch1, Jagged1, Jagged2, Hes1 were detected at 24 h by Western Blot and RT-qPCR.
qPCR
qPCR assay was conducted with the following steps: (1) total RNA was extracted by TRIzol (Invitrogen, USA); (2) transcription to cDNA was performed with PrimeScript™ RT reagent Kit (Takara, Japan); (3) PCR was performed using TB Green™ Fast qPCR Mix (Takara, Japan). β-actin was used as the internal reference. And primers information is displayed in .
Table 1. Primers applied in qPCR.
Western Blot
Western Blot assay was conducted with the following steps: (1) total protein was extracted with RIPA Lysis and Extraction Buffer (Thermo, USA), and the concentration was determined by Pierce™ BCA Protein Assay Kit (Thermo, USA); (2) electrophoresis was performed, and proteins were transferred to membranes, followed by incubation with primary antibody and secondary antibody; (3) the bands were visualized by Pierce™ECL Plus Western Blotting Substrate (Thermo, USA) and X-ray film (Kodak, USA). The antibodies used are listed in .
Table 2. Antibodies applied in Western Blot.
CCK-8
Cells were washed by PBS and added with 10 μL CCK-8 (Dojindo, Japan) as well as 100 μL serum-free medium. Then, cells were incubated for 2 h, and the optical density value was measured.
AV/PI
Trypsinization was performed with 0.25% Tyrisin (Sigma, USA). After washed by PBS, 100 μL suspension was prepared and Annexin V-FITC Apoptosis Detection Kit (BD, USA) was added in darkness. Then, flow cytometer (BD, USA) was applied to evaluate the cell apoptosis rate.
Cell cycle
Cells were collected, resuspended and subsequently fixed with 75% alcohol at 4°C for 24 h. After centrifugation and wash by PBS, cells were added with 500 μL Tali™ Cell Cycle Kit (Invitrogen, USA) and incubated for 30 min. Flow cytometer (BD, USA) was used to measure cell count.
Statistics
Statistical analysis was performed using SPSS 21.0 Software (IBM, USA) and statistical graphs were made using GraphPad 7.01 Software (GraphPad Inc, USA). Data were mainly presented as mean value ± standard deviation. Comparison among groups was determined by one-way ANOVA test followed by multiple comparisons test, comparison between the two groups was determined by t-test. P value < 0.05 was considered as significant.
Results
Effect of GANT61 on inhibition of cell proliferation
To investigate the effect of GANT61 on cell proliferation, RPMI-8226 cells and U266 cells were treated with different concentrations (2.5, 5, 10, 20, 30, 40, 50 μmol/L) of GANT61 and incubated for 18, 24 as well as 36 h, respectively. Then, cell proliferation was measured and proliferation inhibition rate was calculated. In both RPMI-8226 cells and U266 cells, GANT61 with different concentrations (2.5, 5, 10, 20, 30, 40, 50 μmol/L) were able to inhibit cell proliferation, and the inhibition rate was elevated along with increased GANT61 concentration (). Besides, the inhibition rate was also raised along with the increased treatment time (). These data indicated that GANT61 effectively inhibited cell proliferation in a dose- and time-dependent manner in MM.
Figure 1. GANT61 inhibited cell proliferation in MM cells. Proliferation inhibition rate by GANT61 in RPMI-8226 cells (a). Proliferation inhibition rate by GANT61 in U266 cells (b). Comparison among groups were determined by one-way ANOVA test followed by multiple comparisons test. P value < 0.05 was considered significant. *, P < 0.05; **, P < 0.01; ***, P < 0.001. MM, multiple myeloma.
Effect of GANT61 on promotion of cell apoptosis
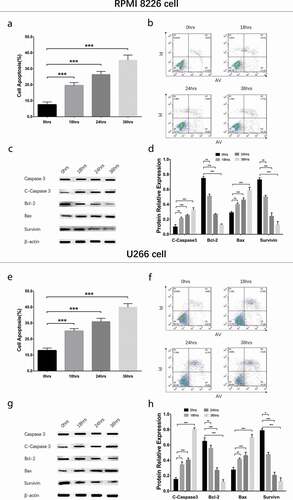
To evaluate the effect of GANT61 with different concentrations on cell apoptosis, 0, 2.5, 5, 10 μmol/L GANT61 were used to treat RPMI-8226 cells and U266 cells for 24 h to evaluate the effect of GANT61 with different concentrations on cell apoptosis. Cell apoptosis rate was increased in 2.5 μmol/L group, 5 μmol/L group and 10 μmol/L group compared to 0 μmol/L group (all P < 0.05) in both RPMI-8226 cells () and U266 cells (), and it was elevated along with increased GANT61 concentration. Besides, apoptotic marker C-Caspase 3 and Bax as well as anti-apoptosis marker Bcl-2 and Survivin showed the same trends in a dose-dependent manner (all P < 0.05) (). As to the effect of GANT61 with different treatment time on cell apoptosis, RPMI-8226 cells and U266 cells were treated with 10 μmol/L GANT61 for 0, 18, 24 and 36 h. As displayed in , cell apoptosis rate was increased in 18-h group, 24-h group and 36-h group compared to 0-h group (all P value < 0.05) in both RPMI-8226 cells () and U266 cells (), and it was raised along with the increased treatment time. Furthermore, apoptotic marker C-Caspase 3 and Bax as well as anti-apoptosis marker Bcl-2 and Survivin presented the similar results in a time-dependent manner (all P value < 0.05) (). These data suggested that GANT61 enhanced cell apoptosis in a dose- and time-dependent manner in MM.
Figure 2. Cell apoptosis in MM cells treated by different concentrations of GANT61. Cell apoptosis rate after treated by various concentrations (0, 2.5, 5, 10 μmol/L) of GANT61 at 24 h in RPMI-8226 cells (a, b). Expressions of C-Caspase 3, Bcl-2, Bax and Survivin after treated by various concentrations (0, 2.5, 5, 10 μmol/L) of GANT61 at 24 h in RPMI-8226 cells (c, d). Cell apoptosis rate after treated by various concentrations (0, 2.5, 5, 10 μmol/L) of GANT61 at 24 h in U266 cells (e, f). Expressions of C-Caspase 3, Bcl-2, Bax and Survivin after treated by various concentrations (0, 2.5, 5, 10 μmol/L) of GANT61 at 24 h in U266 cells (g, h). Comparison between two groups was determined by t-test. P value < 0.05 was considered significant. *P < 0.05; **P < 0.01; ***P < 0.001. MM, multiple myeloma; C-Caspase 3, Cleaved Caspase 3; Bcl-2, B-cell lymphoma-2.
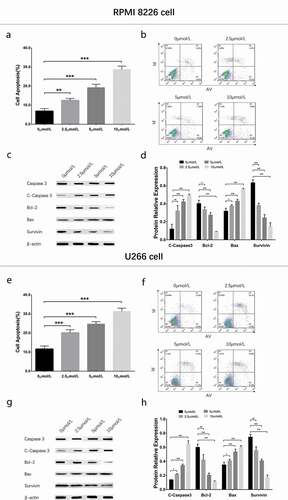
Figure 3. Cell apoptosis in MM cells treated by GANT61 with different treatment times. Cell apoptosis rate after treated by 10 μmol/L GANT61 with different treatment times (0, 18, 24, 36 h) in RPMI-8226 cells (a, b). Expressions of C-Caspase 3, Bcl-2, Bax and Survivin after treated by 10 μmol/L GANT61 with different treatment times (0, 18, 24, 36 h) in RPMI-8226 cells (c, d). Cell apoptosis rate after treated by 10 μmol/L GANT61 with different treatment times (0, 18, 24, 36 h) in U266 cells (e, f). Expressions of C-Caspase 3, Bcl-2, Bax and Survivin after treated by 10 μmol/L GANT61 with different treatment times (0, 18, 24, 36 h) in U266 cells (g, h). Comparison between two groups was determined by t-test. P value < 0.05 was considered significant. *P < 0.05; ***P < 0.001. MM, multiple myeloma; C-Caspase 3, Cleaved Caspase 3; Bcl-2, B-cell lymphoma-2.
Effect of GANT61 on regulation of cell cycle
To evaluate the effect of GANT61 with different concentrations on cell cycle, RPMI-8226 cells and U266 cells were treated with 0, 2.5, 5 and 10 μmol/L GANT61 for 24 h. Cell percentage of G1/G0 phase was increased, while cell percentage of S phase was decreased in 2.5 μmol/L group, 5 μmol/L group and 10 μmol/L group compared to 0 μmol/L group (all P value < 0.05) in both RPMI-8226 cells () and U266 cells (), and the variations of cell percentage were elevated along with increased GANT61 concentration. Moreover, the protein expression of Cyclin D decreased along with the increased GANT61 concentration (). Besides, cell percentage of G2/M phase was non-differentiated in 2.5 μmol/L group, 5 μmol/L group and 10 μmol/L group compared to 0 μmol/L group (all P value > 0.05). As to the effect of GANT61 with different treatment time on cell cycle, RPMI-8226 cells and U266 cells were treated by 10 μmol/L GANT61 for 18, 24 and 36 h. In both RPMI-8226 cells () and U266 cells (), cell percentage of G1/G0 phase was increased but cell percentage of S phase was decreased in 18-h group, 24-h group and 36-h group compared to 0-h group (all P value < 0.05), and the fluctuations were elevated along with the increased treatment time. Meanwhile, cell percentage of G2/M phase was non-differentiated in 18 h group, 24-h group compared to 0-h group (all P value > 0.05), and decreased in 36-h group compared to 0-h group (all P value < 0.05). The protein expression of Cyclin Dc reduced along with the increased treatment time (all P value < 0.05) (). These data implied that GANT61 caused G1/G0 cycle retardation in a dose- and time-dependent manner in MM.
Figure 4. Cell cycle analysis in MM cells treated by different concentrations of GANT61. Statistical graph of cell cycle analysis after treated by various concentrations (0, 2.5, 5, 10 μmol/L) of GANT61 at 24 h in RPMI-8226 cells (a). Cell cycle analysis by flow cytometer after treated by various concentrations (0, 2.5, 5, 10 μmol/L) of GANT61 at 24 h in RPMI-8226 cells (b). Expression of Cyclin D after treated by various concentrations (0, 2.5, 5, 10 μmol/L) of GANT61 at 24 h in RPMI-8226 cells (c, d). Statistical graph of cell cycle analysis after treated by various concentrations (0, 2.5, 5, 10 μmol/L) of GANT61 at 24 h in U266 cells (e). Cell cycle analysis by flow cytometer after treated by various concentrations (0, 2.5, 5, 10 μmol/L) of GANT61 at 24 h in U266 cells (f). Expression of Cyclin D after treated by various concentrations (0, 2.5, 5, 10 μmol/L) of GANT61 at 24 h in U266 cells (g, h). Comparison between two groups was determined by t-test. P value < 0.05 was considered significant. **P < 0.01; ***P < 0.001; NS, no significance; MM, multiple myeloma.
Figure 5. Cell cycle analysis in MM cells treated by GANT61 with different treatment times. Statistical graph of cell cycle analysis after treated by 10 μmol/L GANT61 with different treatment times (0, 18, 24, 36 h) in RPMI-8226 cells (a). Cell cycle analysis by flow cytometer after treated by 10 μmol/L GANT61 with different treatment times (0, 18, 24, 36 h) in RPMI-8226 cells (b). Expression of Cyclin D after treated by 10 μmol/L GANT61 with different treatment times (0, 18, 24, 36 h) in RPMI-8226 cells (c, d). Statistical graph of cell cycle analysis after treated by 10 μmol/L GANT61 with different treatment times (0, 18, 24, 36 h) in U266 cells (e). Cell cycle analysis by flow cytometer after treated by 10 μmol/L GANT61 with different treatment times (0, 18, 24, 36 h) in U266 cells (f). Expression of Cyclin D after treated by 10 μmol/L GANT61 with different treatment times (0, 18, 24, 36 h) in U266 cells (f, g). Comparison between two groups was determined by t-test. P value < 0.05 was considered significant. **P < 0.01; ***P < 0.001; NS, no significance. MM, multiple myeloma.
Effect of GANT61 on inhibition of Notch pathway
To evaluate the effect of GANT61 with different concentrations on Notch pathway, 0, 2.5, 5, 10 μmol/L GANT61 were used to treat RPMI-8226 cells and U266 cells for 24 h to evaluate the effect of GANT61 with different concentrations on Notch pathway. In both RPMI-8226 cells and U266 cells, mRNA expressions () and protein expressions () of Notch1, Jagged1, Jagged2 and Hes1 were decreased in 2.5 μmol/L group, 5 μmol/L group and 10 μmol/L group compared to 0 μmol/L group (all P value < 0.05), and these expressions were decreased along with the increased GANT61 concentration. For the effect of GANT61 with different treatment time on Notch pathway, RPMI-8226 cells and U266 cells were treated by 10 μmol/L GANT61 for 18, 24 and 36 h. As described in , mRNAs () and protein expressions () of Notch1, Jagged1, Jagged2 and Hes1 were decreased in 18-h group, 24-h group as well as 36-h group compared to 0-h group (all P value < 0.05), and these expressions were reduced along with the increased treatment time. These data indicated that GANT61 inhibited Notch pathway in a dose- and time-dependent manner in MM.
Figure 6. Regulation of Notch pathway in MM cells treated by different concentrations of GANT61. mRNA expressions of Notch pathway-related factors (including Notch1, Jagged1, Jagged2, Hes1) after treated by various concentrations (0, 2.5, 5, 10 μmol/L) of GANT61 at 24 h in RPMI-8226 cells (a). Protein expressions of Notch pathway-related factors (including Notch1, Jagged1, Jagged2, Hes1) after treated by various concentrations (0, 2.5, 5, 10 μmol/L) of GANT61 at 24 h in RPMI-8226 cells (b, c). mRNA expressions of Notch pathway-related factors (including Notch1, Jagged1, Jagged2, Hes1) after treated by various concentrations (0, 2.5, 5, 10 μmol/L) of GANT61 at 24 h in U266 cells (d). Protein expressions of Notch pathway-related factors (including Notch1, Jagged1, Jagged2, Hes1) after treated by various concentrations (0, 2.5, 5, 10 μmol/L) of GANT61 at 24 h in U266 cells (e, f). Comparison between two groups was determined by t-test. P value < 0.05 was considered significant. *P < 0.05; **P < 0.01; ***P < 0.001. MM, multiple myeloma.
Figure 7. Regulation of Notch pathway in MM cells treated by GANT61 with different treatment times. mRNA expressions of Notch pathway-related factors (including Notch1, Jagged1, Jagged2, Hes1) after treated by 10 μmol/L GANT61 with different treatment times (0, 18, 24, 36 h) in RPMI-8226 cells (a). Protein expressions of Notch pathway-related factors (including Notch1, Jagged1, Jagged2, Hes1) after treated by 10 μmol/L GANT61 with different treatment times (0, 18, 24, 36 h) in RPMI-8226 cells (b, c). mRNA expressions of Notch pathway-related factors (including Notch1, Jagged1, Jagged2, Hes1) after treated by 10 μmol/L GANT61 with different treatment times (0, 18, 24, 36 h) in U 266 cells (d). Protein expressions of Notch pathway-related factors (including Notch1, Jagged1, Jagged2, Hes1) after treated by 10 μmol/L GANT61 with different treatment times (0, 18, 24, 36 h) in U266 cells (e, f). Comparison between two groups was determined by t-test. P value < 0.05 was considered significant. *P < 0.05; **P < 0.01; ***P < 0.001. MM, multiple myeloma.
Effect of GANT61 on Gli 1 expression
To confirm the regulation of GANT61 on Gli in MM cells, Gli 1 protein was detected after treated by GANT61 (Supplementary Figure 1). In both RPMI-8226 cells as well as U266 cells, Gli 1 protein expression was reduced in GANT61 group compared to NC group, suggesting that GANT61 did inhibit Gli in MM cells.
Notch pathway in rescue experiments
In order to investigate whether GANT61 functioned in MM cells via inhibiting Notch pathway, rescue experiments were carried out. And we observed that in both RPMI-8226 cells () and U266 cells (), Notch1, Jagged1, Jagged2 and Hes1 mRNA and protein expressions were elevated in Notch1+ GANT61 group compared to Control+GANT61 group, as well as increased in Notch1 group compared with Control group (all P value < 0.05). These data implied that Notch1 overexpression attenuated the inhibition of Notch signaling pathway in GANT61 treated MM cells.
Figure 8. Regulation of Notch pathway after transfection with Notch1 overexpression plasmids in MM cells. mRNA expressions of Notch pathway-related factors (including Notch1, Jagged1, Jagged2, Hes1) after transfection with Notch1 overexpression plasmids in RPMI-8226 cells (a). Protein expressions of Notch pathway-related factors (including Notch1, Jagged1, Jagged2, Hes1) after transfection with Notch1 overexpression plasmids in RPMI-8226 cells (b, c). mRNA expressions of Notch pathway-related factors (including Notch1, Jagged1, Jagged2, Hes1) after transfection with Notch1 overexpression plasmids in U266 cells (d). Protein expressions of Notch pathway-related factors (including Notch1, Jagged1, Jagged2, Hes1) after transfection with Notch1 overexpression plasmids in U266 cells (e, f). Comparison between two groups was determined by t-test. P value < 0.05 was considered significant. **, P < 0.01; ***, P < 0.001; NS, no significance. MM, multiple myeloma. C-Caspase 3, Cleaved Caspase 3; Bcl-2, B-cell lymphoma-2.
Cell proliferation, cell apoptosis and cell cycle in rescue experiments
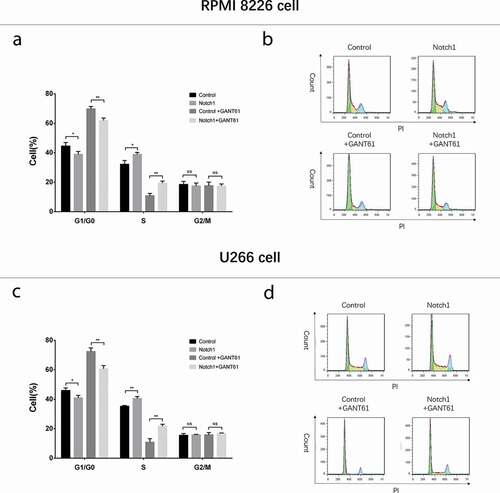
In both RPMI-8226 cells and U266 cells, cell proliferation () was increased but cell apoptosis rate () was decreased in Notch1+ GANT61 group compared to Control+GANT61 group, and in Notch1 group compared to Control group (all P value < 0.05). Meanwhile, apoptotic marker C-Caspase 3 expression was decreased while anti-apoptosis marker Bcl-2 expression was increased in Notch1+ GANT61 group compared to Control+GANT61 group, and in Notch1 group compared to Control group (all P value < 0.05) (). Additionally, cell percentage of G1/G0 phase was decreased but cell percentage of S phase was increased in Notch1+GANT61 group compared to Control+GANT61 group, and in Notch1 group compared to Control group (all P value < 0.05) (). These data suggested that GANT61 suppressed cell proliferation, promoted cell apoptosis and induced G1/G0 cycle retardation through inhibiting Notch signaling pathway in MM.
Figure 9. Cell proliferation and cell apoptosis after transfection with Notch1 overexpression plasmids in MM cells. Cell proliferation after transfection with Notch1 overexpression plasmids in RPMI-8226 cells (a). Cell apoptosis rate after transfection with Notch1 overexpression plasmids in RPMI-8226 cells (b, c). Expressions of apoptotic marker C-Caspase 3 and anti-apoptosis marker Bcl-2 after transfection with Notch1 overexpression plasmids in RPMI-8226 cells (d, e). Cell proliferation after transfection with Notch1 overexpression plasmids in U266 cells (f). Cell apoptosis rate after transfection with Notch1 overexpression plasmids in U266 cells (g, h). Expressions of apoptotic marker C-Caspase 3 and anti-apoptosis marker Bcl-2 after transfection with Notch1 overexpression plasmids in U266 cells (i, j). Comparison between two groups was determined by t-test. P value < 0.05 was considered significant. *, P < 0.05; **, P < 0.01; ***, P < 0.001; NS, no significance. MM, multiple myeloma. C-Caspase 3, Cleaved Caspase 3; Bcl-2, B-cell lymphoma-2.
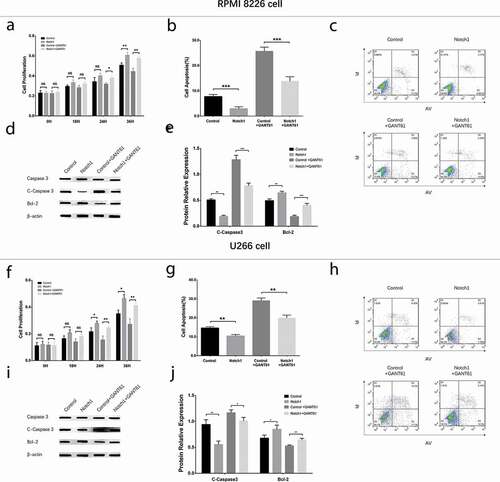
Figure 10. Cell cycle after transfection with Notch1 overexpression plasmids in MM cells. Cell cycle analysis after transfection with Notch1 overexpression plasmids in RPMI-8226 cells (a, b). Cell cycle analysis after transfection with Notch1 overexpression plasmids in U266 cells (c, d). Comparison between two groups was determined by t-test. P value < 0.05 was considered significant. *, P < 0.05; **, P < 0.01; NS, no significance.
Discussion
Our results indicated that: (1) GANT61 inhibited cell proliferation, promoted cell apoptosis and induced G1/G0 cycle retardation in a dose- and time-dependent manner in MM; (2) GANT61 presented with good treating effect via inhibiting Notch pathway in MM.
Hh pathway is essential for embryonic development and adult hemostasis, while aberrant activation of Hh pathway is implicated in tumorigenesis, and tumors with activated mutations in this pathway present sensitivity to Hh inhibitors, which may provide an effective approach to impede initiation and development of tumors [Citation15]. One of the common strategies to establish Hh inhibitors is to repress Gli, which is an important participator in Hh pathway [Citation6,Citation16–Citation19]. GANT61, as a Gli inhibitor, blocks Gli function and further inhibits Hh signaling pathway, thereby represses cell proliferation in several cancers [Citation6,Citation16–Citation19]. Based on the previous studies, GANT61 exerts inhibitory effect on Gli through the following mechanisms: (1) interacts with nucleus to impair Gli function; (2) disrupts Gli1- and Gli2-mediated transcription; (3) suppresses Gli1 DNA binding activity [Citation6,Citation18]. Recently, the influence of GANT61 in tumor cells has been displayed in some experiments [Citation16,Citation17,Citation19]. For instance, one interesting study reveals that GANT61 application promotes cell apoptosis via inducing mitochondrial superoxide generation and downregulating Gli1, Gli2 as well as Patched1 (PTCH1) in malignant mesothelioma cells [Citation16]. Besides, GANT61 results in decreased estradiol-induced cancer stem cell proliferation as well as Gli1(or Gli2) overexpression in estrogen receptor (ER)-positive breast cancer cells [Citation17]. Furthermore, GANT61 induces DNA damage via activating ATM/Chk2 axis, thereby inhibits Gli/Gli2 and decreases cell proliferation in human colon carcinoma cells [Citation19]. These studies indicate that GANT61 application may be an efficient therapeutic option in these tumors.
For hematologic malignancies, GANT61 has been investigated in a few previous studies [Citation10,Citation11,Citation20]. For example, a study shows that the use of GANT61 decreases cell proliferation and colony formation in myelodysplastic syndromes cells, and another two studies disclose that GANT61 suppresses cell proliferation as well as promotes cell apoptosis in AML cells [Citation10,Citation20]. Besides, an interesting study applying various concentrations of GANT61 in leukemic cells displays that GANT61 promotes cell apoptosis by a dose-dependent manner [Citation11]. For the effect of GANT61 on cell cycle, a study shows that GANT61 blocks the cell cycle at G1/G0 phase in AML cells [Citation20]. These explorations indicate that GANT61 has antiproliferative or proapoptotic effect on cells in these hematologic malignancies, while the related evidence of GANT61 in MM cells is rarely reported. In order to explore the effect of GANT61 on killing MM cells, we treated RPMI-8226 cells as well as U266 cells with different concentrations of GANT61 for various treatment time, and the following CCK8 assay, AV/PI assay, qPCR assay, Western Blot assay as well as PI assay were conducted to assess the effect of GANT61 on cell proliferation, cell apoptosis and cell cycle in these MM cells. We found that GANT61 inhibited cell proliferation but enhanced cell apoptosis and induced G1/G0 cycle retardation in RPMI-8226 cells as well as U266 cells, and these influences in MM cells presented with a dose- and time-dependent manner. These data suggested that GANT61 might serve as a tumor suppressor through regulating cell proliferation, cell apoptosis and cell cycle in RPMI-8226 cells as well as U266 cells.
Notch pathway, as a cell-fate determinant, regulates self-renewal and differentiation in several tissues and cell types. Moreover, the role of Notch pathway in cancers is widely studied, and its hyperactivation has been regarded as oncogenic in several cancers such as breast cancer and T-cell acute lymphoblastic leukemia [Citation21–Citation23]. Emerging studies have disclosed that Notch pathway facilitates cell proliferation in MM cells, and have proposed Notch pathway as a promising target in treatment of MM [Citation14,Citation24,Citation25]. For instance, a study displays that expressions of Notch pathway-related factors including Notch 1, Notch 2 and Jagged 1 are elevated in primary MM cells, and Notch pathway activation (by Jagged 1 stimulation) accelerates the cell proliferation in MM [Citation14]. Additionally, a study discloses that Notch pathway suppression (by γ-secretase inhibitor) inhibits cell viability and enhances cell apoptosis in MM [Citation24]. Furthermore, another study observes that Notch suppression (by γ-secretase inhibitor) inhibits cell proliferation by a dose- and time-dependent manner and induces G0/G1 cell cycle arrest in MM cells (RPMI 8226 cells) [Citation25]. All these studies imply that Notch pathway plays a crucial role in the cancer-promoting mechanisms in MM, and interfering Notch pathway may serve as an efficient treatment approach.
Considering that GANT61 exerts anti-tumor effect in a proportion of solid tumors and several hematologic malignancies through blocking Hh pathway and may exert killing effect in MM, moreover, Notch pathway participates in the pathogenesis of MM and there may be interaction between Hh and Notch pathways uncovered in a previous study, we hypothesized that GANT61 might exert anti-tumor effect in MM cells through inhibiting Notch pathway [Citation5,Citation10–Citation12,Citation20,Citation26,Citation27]. However, the evidence about the interaction between GANT61 and Notch pathway in MM is seldomly reported. To investigate whether GANT61 functioned in MM cells through inhibiting Notch pathway, we assessed the influence of GANT61 on Notch pathway and conducted rescue experiments in RPMI-8226 cells as well as U266 cells. We found that GANT61 inhibited Notch pathway in a dose- and time-dependent manner. Furthermore, Notch pathway activation enhanced cell proliferation, reduced cell apoptosis and decreased G1/G0 cycle retardation in RPMI-8226 cells as well as U266 cells. These data suggested that GANT61 suppressed cell proliferation, promoted cell apoptosis and induced G1/G0 cycle retardation through inhibiting Notch pathway, which might provide important reference for the further exploration of therapeutic strategy in MM. Additionally, there were still some limitations in our study: (1) the expressions between mRNAs and proteins might present with some distinctions, which might result from that the protein transcription was affected by many factors, and meanwhile, the quantification methods of mRNA and protein were different, however, the mRNA and protein expressions showed the same overall trend; (2) this was a primary study, we mainly intended to explore whether GANT61 presented with killing effect in MM via regulating Notch pathway, while more explorations with other Notch inhibitors were not included in this present study; (3) in vivo experiments were not included in this present study due to the insufficiency of funds; (4) human normal cell lines were not applied, whose application might help to make sure that the effects of GANT61 were specific to MM cell lines instead of normal cells. Therefore, future study that includes in vivo experiments and human normal cell lines is needed, which may validate our findings and provide more indications for the treatment of MM.
In conclusion, the Gli inhibitor GANT61 suppresses cell proliferation, promotes cell apoptosis and induces G1/G0 cycle retardation with a dose- and time-dependent manner through inhibiting Notch pathway in MM.
Supplemental Material
Download PDF (192.5 KB)Disclosure statement
No potential conflict of interest was reported by the authors.
Supplementary material
Supplemental data for this article can be accessed here.
Additional information
Funding
References
- Rollig C, Knop S, Bornhauser M. Multiple myeloma. Lancet. 2015;385(9983):2197–2208.
- Palumbo A, Anderson K. Multiple myeloma. N Engl J Med. 2011;364(11):1046–1060.
- Moreau P, Attal M, Facon T. Frontline therapy of multiple myeloma. Blood. 2015;125(20):3076–3084.
- Becker N. Epidemiology of multiple myeloma. Recent Results Cancer Res. 2011;183:25–35.
- Long B, Wang LX, Zheng FM, et al. Targeting GLI1 Suppresses Cell Growth and Enhances Chemosensitivity in CD34+ Enriched Acute Myeloid Leukemia Progenitor Cells. Cell Physiol Biochem. 2016;38(4):1288–1302.
- Mazumdar T, DeVecchio J, Agyeman A, et al. The GLI genes as the molecular switch in disrupting Hedgehog signaling in colon cancer. Oncotarget. 2011;2(8):638–645.
- Shi T, Mazumdar T, Devecchio J, et al. cDNA microarray gene expression profiling of hedgehog signaling pathway inhibition in human colon cancer cells. PLoS One. 2010;5(10). DOI:https://doi.org/10.1371/journal.pone.0013054
- Gonnissen A, Isebaert S, Haustermans K. Targeting the Hedgehog signaling pathway in cancer: beyond Smoothened. Oncotarget. 2015;6(16):13899–13913.
- Chakrabarti J, Holokai L, Syu L, et al. Hedgehog signaling induces PD-L1 expression and tumor cell proliferation in gastric cancer. Oncotarget. 2018;9(100):37439–37457.
- Lau BW, Huh K, Madero-Marroquin R, et al. Hedgehog/GLI1 activation leads to leukemic transformation of myelodysplastic syndrome in vivo and GLI1 inhibition results in antitumor activity. Oncogene. 2019;38(5):687–698.
- Pan D, Li Y, Li Z, et al. Gli inhibitor GANT61 causes apoptosis in myeloid leukemia cells and acts in synergy with rapamycin. Leuk Res. 2012;36(6):742–748.
- Ringuette R, Atkins M, Lagali PS, et al. A Notch-Gli2 axis sustains Hedgehog responsiveness of neural progenitors and Muller glia. Dev Biol. 2016;411(1):85–100.
- Mirandola L, Apicella L, Colombo M, et al. Anti-Notch treatment prevents multiple myeloma cells localization to the bone marrow via the chemokine system CXCR4/SDF-1. Leukemia. 2013;27(7):1558–1566.
- Jundt F, Probsting KS, Anagnostopoulos I, et al. Jagged1-induced Notch signaling drives proliferation of multiple myeloma cells. Blood. 2004;103(9):3511–3515.
- Brechbiel J, Miller-Moslin K, Adjei AA. Crosstalk between hedgehog and other signaling pathways as a basis for combination therapies in cancer. Cancer Treat Rev. 2014;40(6):750–759.
- Lim CB, Prele CM, Baltic S, et al. Mitochondria-derived reactive oxygen species drive GANT61-induced mesothelioma cell apoptosis. Oncotarget. 2015;6(3):1519–1530.
- Kurebayashi J, Koike Y, Ohta Y, et al. Anti-cancer stem cell activity of a hedgehog inhibitor GANT61 in estrogen receptor-positive breast cancer cells. Cancer Sci. 2017;108(5):918–930.
- Lauth M, Bergstrom A, Shimokawa T, et al. Inhibition of GLI-mediated transcription and tumor cell growth by small-molecule antagonists. Proc Natl Acad Sci U S A. 2007;104(20):8455–8460.
- Mazumdar T, Devecchio J, Agyeman A, et al. Blocking Hedgehog survival signaling at the level of the GLI genes induces DNA damage and extensive cell death in human colon carcinoma cells. Cancer Res. 2011;71(17):5904–5914.
- Masetti R, Bertuccio SN, Astolfi A, et al. Hh/Gli antagonist in acute myeloid leukemia with CBFA2T3-GLIS2 fusion gene. J Hematol Oncol. 2017;10(1):26.
- Lobry C, Oh P, Mansour MR, et al. Notch signaling: switching an oncogene to a tumor suppressor. Blood. 2014;123(16):2451–2459.
- Acar A, Simoes BM, Clarke RB, et al. A Role for Notch Signalling in Breast Cancer and Endocrine Resistance. Stem Cells Int. 2016;2016:2498764.
- Weng AP, Ferrando AA, Lee W, et al. Activating mutations of NOTCH1 in human T cell acute lymphoblastic leukemia. Science. 2004;306(5694):269–271.
- Schwarzer R, Nickel N, Godau J, et al. Notch pathway inhibition controls myeloma bone disease in the murine MOPC315.BM. model. Blood Cancer J. 2014;4:e217.
- Hu J, Zhu X, Lu Q. Antiproliferative effects of gamma-secretase inhibitor, a Notch signalling inhibitor, in multiple myeloma cells and its molecular mechanism of action. J Int Med Res. 2013;41(4):1017–1026.
- Colombo M, Mirandola L, Platonova N, et al. Notch-directed microenvironment reprogramming in myeloma: a single path to multiple outcomes. Leukemia. 2013;27(5):1009–1018.
- Colombo M, Thummler K, Mirandola L, et al. Notch signaling drives multiple myeloma induced osteoclastogenesis. Oncotarget. 2014;5(21):10393–10406.