
ABSTRACT
Prostate cancer (PC) is the most common malignancy in men. As per recent findings, microRNA-300 (miR-300) were found to be overexpressed in numerous types of cancers. In this study, we aimed to explore the effects of miR-300 on the adhesion, invasion, and migration of PC cells by targeting Disabled 1 (DAB1). Firstly, the regulatory role of miRNAs on DAB1 was predicted by screening PC-related differentially expressed genes (DEGs). Immunohistochemistry was applied to determine the positive protein expression of DAB1, after which the target relationship between miR-300 and DAB1 was examined. Loss-of-function and gain-of-function experiments were conducted to determine cell proliferation, adhesion, migration, invasion capability, and cell cycle of PC cells. Our data illustrated that DAB1 had a low expression, while miR-300 was expressed at a relatively high level in PC tissues. Moreover, our clinicopathological analysis revealed that there was a correlation between miR-300 and tumor, node, metastases stage, Gleason score, and lymph node metastasis of PC patients. DAB1 was also found to be poorly expressed in PC based on the findings from the microarray analysis. The results from dual-luciferase reporter gene assay corroborated that miR-300 interacts with DAB1. Importantly, overexpression of miR-300 and/or si-DAB1 resulted in the enhancement of RAC1, MMP2, MMP9, CyclinD1, and CyclinE expressions, whereas the expression of DAB1 and Rap was reduced in PC cells, thus suggesting that down-regulated miR-300 suppressed proliferation, adhesion, migration, and invasion of PC cells. Collectively, our results provided evidence that down-regulation of miR-300 inhibits the adhesion, migration, and invasion of PC cells.
Introduction
Prostate cancer (PC) is frequently diagnosed malignancy and the second most frequent cancer diagnosis made in men and the fifth leading cause of death worldwide [Citation1,Citation2]. Currently, the main therapeutic strategy for PC is through androgen blockade, which includes a decrease in circulating testosterone levels and disruption of androgen-androgen receptor interaction; however, PC gradually develops resistance to this form of treatment [Citation3]. Nonetheless, despite a good prognosis following medical or surgical castration, the development of castration-resistance remained prevalent, with approximately 40% of cases of PC presenting with cancer metastasis [Citation4]. On the other hand, additional risk factors such as smoking, older age, family medical history of PC or breast cancer, enhance the risk of developing PC [Citation5,Citation6]. Fortunately, long-term survival has been observed in patients with localized PC, primarily due to the efficacy of treatment options available such as surgical resection and radiotherapy [Citation7]; however, erectile and sexual dysfunctions are common long-term side effects in these patients [Citation8]. Therefore, new and more effective therapeutic alternatives are required for PC.
The oncogenic potential of microRNAs (miRNAs) has been highlighted numerous times in several studies in recent years, with their dysregulated expression observed in a range of cancers including PC [Citation9]. miR-300 has been reported to localize in the Dlk1-Dio3 microRNA cluster, region 14q32.31 [Citation10]. Intriguingly, miR-300 is characterized as a multi-influential oncogene, and it can play either a tumor promoter or suppressor role in different types of cancer, an example of which includes its tumor inhibitory role in non-small cell lung cancer [Citation11]. More specifically, miR-300 was found with significantly enhanced expression in colorectal cancer (CRC) tissues and potentiated CRC cell proliferation, migration, and invasion in-vitro [Citation12]. Moreover, previous studies have reported that miR-300 suppresses the proliferation, migration, and invasion while increasing the rate of apoptosis in PC cells [Citation13].
Moreover, Disabled 1 (DAB1), a human homolog of the Drosophila disabled locus, has been implicated in neuronal migration and lamination in the developing cerebral cortex and observed to be diminished in primary tumor tissues and several cancer-derived cell lines, particularly in the brain and endometrial cancers [Citation14]. Huang et al. (2004) demonstrated that DAB1 plays a crucial role in the Reelin signaling pathway by acting as an essential adapter protein that guides neurogenic events [Citation15]. In breast cancer, DAB1 was found to be decreased while its decline was attributed to triple-negative breast cancer phenotype, poor differentiation, and lymph node metastasis [Citation16]. Peculiarly, DAB1 was identified to hinder the cell-cell adhesion between chain-forming neuroblasts [Citation17]. Based on the aforementioned findings, we hypothesized that miR-300 may regulate DAB1 expression in PC, resulting in changes in adhesion, invasion, and migration of PC.
Materials and methods
Ethics statement
The study was approved by the Institutional Review Board of Tangshan Gongren Hospital. Participants provided written informed consent to participate in this study.
Microarray-based gene expression analysis
The Gene Expression Omnibus (GEO) database (https://www.ncbi.nlm.nih.gov/geo/) was used to retrieve the PC-related microarrays, after which GSE55945 containing 8 normal control samples and 13 PC samples was obtained. The R-language “limma” package was applied to search the differentially expressed genes (DEGs) in PC samples and normal control samples with the screening threshold of |log foldchange| > 2 and p-value < 0.05. The R-language “pheatmap” package was used to plot the heatmap for the DEGs.
MalaCards (http://www.malacards.org/) is an integrated database of human diseases with annotations and modeled on the architecture and richness of the popular GeneCards database of human genes. Herein, the MalaCards database was applied to retrieve the PC-related biological processes using the keyword “prostate cancer”. The biological process involved in PC-related DEGs was retrieved from the David (https://david.ncifcrf.gov/) database.
Moreover, the UALCAN (http://ualcan.path.uab.edu/index.html) is a user-friendly and interactive web resource for analyzing cancer transcriptome data and could be employed to retrieve the expression of specific genes in the Cancer Genome Atlas (TCGA) database. The website was adopted to retrieve the expression of DAB1 in PC.
Finally, the microRNA.org (http://34.236.212.39/microrna/home.do), TargetScan (http://www.targetscan.org/vert_71/), and mirDIP (http://ophid.utoronto.ca/mirDIP/index.jsp#r) databases were utilized to predict miRNAs that could potentially regulate DAB1. All the predicted miRNAs in microRNA.org, the top 100 predicted miRs in the TargetScan, and the top 50 predicted miRs in miRDIP were collated to plot a Venn map by using the Venn website (http://bioinformatics.psb.ugent.be/webtools/Venn/) to finally obtain the intersection in predicted miRNAs.
Study subjects
From January 2013 to December 2016, prostatic tissues were collected from 102 patients who received surgery or needle biopsy in the Tangshan Gongren Hospital. In addition, 62 tissues were obtained from benign prostatic hyperplasia (BPH) patients (aged 37–75 years with a mean age of 57 years) and 40 tissues from PC patients (aged 47–86 years with a mean age of 68 years). According to the Gleason scoring method, among the 40 PC cases, 13 of them were highly-differentiated (2–4 points), 7 moderately differentiated (5–7 points), and 20 poorly differentiated (8–10 points) [Citation18]. Afterward, tissues were cut to pieces, and immediately frozen in liquid nitrogen.
Immunohistochemistry
Paraffin-embedded sections were conventionally dewaxed and dehydrated with gradient alcohol. After undergoing microwave heating for antigen retrieval in 0.02 mol/L citrate buffer (pH = 6.0), sections were immersed in 3% H2O2 for 10 minutes and blocked with 10% goat serum (C-0005, Shanghai Haoran Bio Technologies Co., Ltd., Shanghai, China) for 30 minutes. Then, the primary antibody, rabbit polyclonal antibody to DAB1 (1:500, ab189426, Abcam, Cambridge, UK) was added for incubation in a wet box at 4°C overnight. Sections were then probed with the secondary antibody, goat anti-rabbit (1:2000, ab205718, Abcam, Cambridge, UK) at room temperature for 1 hour avoiding exposure to light, stained with diluted 4′,6-diamidino-2-phenylindole 2hci (DAPI; 1:100) at room temperature for 20–30 minutes avoiding exposure to light, and mounted with 60% glycerin. The sections were observed and photographed under a microscope (GFM: 600, Shanghai Guangmi Instrument Co., Ltd., Shanghai, China). The positive cells were regarded as those that exhibited brown or brownish-yellow particles in the cell membrane or cytoplasm. Four high power fields (× 400) were randomly selected from each section (each field counted about 200 cells). The positive cells/PC cells > 10% served as positive, with the remaining regarded as negative [Citation19]. The experiment was conducted in triplicates.
Dual-luciferase reporter gene assay
The biological prediction website MicroRNA.org was used to predict the potential target genes of miR-300, and dual-luciferase reporter gene assay was applied to verify whether DAB1 was a direct target gene of miR-300. DNA was extracted in accordance with the instructions provided on the TIAN amp Genomic DNA Kit instructions (TIANGEN Biotech Co., Ltd., Beijing, China) to construct the luciferase reporter vector. Luciferase activity was measured using the Dual-Luciferase Reporter Gene Assay System (Promega Corporation, Madison, WI, USA). After transfection for 48 hours, the cells in each well were vibrated with 100 μL passive lysis buffer (PLB) for 15 minutes at room temperature. The pre-reading time of the program was set for 2 seconds, and the reading time was at 10 seconds. The loading volume of LARII Stop & Glo® Reagent (Promega Corporation, Madison, WI, USA) was 100 μL. The prepared LARII Stop & Glo® Reagent, and the cell lysate of the luminous tube or plate (20 μL of each sample) were placed on the bioluminescence detection instrument. The program was started, with the data recorded once fluorescence reading was completed.
Cell culture, grouping, and transfection
Human PC cell lines PC-3 and LNCap purchased from the Institute of Biochemistry and Cell Biology, Chinese Academy of Sciences (Shanghai, China) were conventionally cultured in Roswell Park Memorial Institute (RPMI) 1640 medium (SP1355, Shanghai Shifeng Biological Technology Co., Ltd., Shanghai, China) containing 10% fetal bovine serum (FBS), 100 U/mL penicillin and 100 mg/mL streptomycin, followed by incubation (DHP-9162, Jie Cheng Experimental Apparatus Company, Shanghai, China) at 37°C with 5% CO2. The medium was renewed every 1–2 days, and the cells were passaged when cell confluence reached 80%-90%. The cells were treated with 0.25% trypsin for 2–5 minutes, resuspended in 5 mL Dulbecco’s modified Eagle’s medium (DMEM; 190,040, Gibco BRL, Gaithersburg, MD, USA), and passaged.
PC cells in logarithmic growth phase were assigned into the blank (without any transfection), negative control (NC) (transfected with miR-300 NC sequences), miR-300 mimic (transfected with miR-300 mimic), miR-300 inhibitor (transfected with miR-300 inhibitor), siRNA-DAB1 (transfected with siRNA-DAB1), miR-300 mimic + siRNA-DAB1 (transfected with both miR-300 mimic and siRNA-DAB1), and miR-300 inhibitor + siRNA-DAB1 (transfected with both miR-300 inhibitor and siRNA-DAB1) groups. Cells in the logarithmic growth phase were seeded into a 6-well plate with approximately 30%-50% cell confluence. Cell transfection was conducted according to the instructions of the Lipofectamine 2000 (11,668,019, Invitrogen Inc., Carlsbad, CA, USA). Afterward, the miR-300 mimic, miR-300 inhibitor, siRNA-DAB1, miR-300 mimic + siRNA-DAB1, and NC freeze-dried powders (YDSW-D18; Invitrogen, Carlsbad, CA, USA) underwent centrifugation and were dissolved in ribonuclease (RNase)-free water. Cells were further cultured for 24–48 hours followed by extraction of RNA and protein for subsequent experiments.
Adhesion assay
After 48 hours of transfection, cells were detached with 0.25% trypsin, centrifuged, and resuspended in serum-free DMEM. The cell concentration was adjusted into 1 × 10⁶ cells/mL. The cells in a 96-well plate were incubated with 50 μL fibronectin (FN; 20 mg/L) for 2 hours at 37°C and blocked with 2 mg/L bovine serum albumin (BSA) for 30 minutes at 37°C. The cell suspension (100 μL) were seeded into each well with 5 parallel wells in each group, after which incubation was carried out at 37°C for 30 minutes, 60 minutes and 90 minutes, respectively, followed by gentle washing with 150 μL phosphate buffer saline (PBS) to remove non-adhesive cells. Cells were incubated with 50 μL 3-(4,5-dimethylthiazol-2-yl)-2,5-diphenyltetrazolium bromide (MTT) solution (1 mg/mL) at 37°C for 3 hours. After each well was added with 100 μL dimethyl sulfoxide (DMSO), the absorbance value (A-value) of each well was determined at a wavelength of 490 nm. The A-value represented the adhesion capacity of cells, and the higher A-value reflects stronger adhesion capacity of cells.
Reverse transcription-quantitative polymerase chain reaction (RT-qPCR)
Total RNA was extracted using an ultrapure RNA extraction kit (D203-01, Beijing GenStar Biosolutions Co., Ltd., Beijing, China). The concentration and purity of RNA in tissues and cells were determined with the application of ultraviolet spectrophotometry (UV1901, Shanghai Aucy Instrument Co., Ltd., Shanghai, China). The primers of miR-300, DAB1, Rap1, Rac family small GTPase 1 (RAC1), matrix metallopeptidase 2 (MMP2), MMP9, CyclinD1, CyclinE, and glyceraldehyde-3-phosphate dehydrogenase (GAPDH) were designed and synthesized by Takara Co., Ltd. (Dalian, Liaoning, China) (). The reverse transcription was carried out based on the instructions of the TaqMan MicroRNA Assays Reverse Transcription Primer (4,366,596, Thermo Fisher Scientific, Waltham, MA, USA). RT-qPCR was conducted using the reaction mixture according to the instructions provided on the SYBR® Premix ExTaqTM II kit (RR820A, Xingzhi Biotech, Co. Ltd, Guangzhou, China) instructions in ABI PRISM® 7300 system (Applied Biosystems, Foster City, CA, USA). Differential gene expression between the control group and the experimental group was determined using the 2−ΔCt method: ΔCT = Ct miR-300 – Ct U6. Each experiment was conducted in triplicates.
Table 1. Primer sequences for RT-qPCR
Western blot analysis
Cells were lysed with protein lysis buffer containing 60% radioimmunoprecipitation assay lysate (RIPA), 39% sodium dodecyl sulfate (SDS), and 1% protease inhibitor at 4°C for 30 minutes, vibrating every 10 minutes. Following centrifugation at 25,764 × g at 4°C for 20 minutes, the protein concentration of each sample was measured by the bicinchoninic acid (BCA) kit (20201ES76; Yeasen Biotechnology Co. Ltd., Shanghai, China). The protein samples were then separated by electrophoresis, transferred onto nitrocellulose membranes, and blocked overnight with 5% skim milk powder at 4°C. The membranes were incubated overnight with the primary antibodies, rabbit polyclonal antibodies to DAB1 (ab111684, 1:1000), Rap1 (ab32373, 1:10,000), RAC1 (ab155938, 1:1000), MMP2 (ab92536, 1:1000), MMP9 (ab38898, 1:1000), CyclinD1 (ab134175, 1:50,000), and CyclinE (ab3927, 1:1000). The primary antibodies were all purchased from Abcam Inc., (Cambridge, UK). Subsequently, the membranes were incubated with the secondary antibody, horseradish peroxidase (HRP)-conjugated goat anti-rabbit antibody to IgG (ab109489, 1:10,000; Boster Biological Technology Co., Ltd., Wuhan, Hubei, China) for 1 hour at 37°C. Membranes were immersed in enhanced chemiluminescence (ECL) reagent (Pierce Waltham, MA, USA) for 1 minute at room temperature. Afterward, the membranes were covered with the plastic wrap, developed and fixed under dark conditions. The GAPDH was used as the internal reference and the relative protein expression was regarded as the ratio of gray values of target bands to the internal reference bands.
MTT assay
PC cell proliferation was detected by MTT assay. After 48 hours of transfection, cells were seeded in a 96-well plate (5 × 10³ cells/200 μL). There were four 96-well plates, with eight parallel wells in each group. Then, four different time points (0 h, 24 h, 48 h, and 72 h) were set. In each time point, cells in each well were cultured with 20 μL MTT solution (Sigma-Aldrich, St. Louis, MO, USA) at 37°C for 4 hours. Subsequently, cells in each well were added with 150 μL DMSO and gently mixed for 10 minutes in an enzyme-linked immunosorbent assay (ELISA). The optical density (OD) value of cells was detected in each well at the wavelength of 490 nm using a microplate reader (Multiskan GO, Thermo Fisher Scientific Inc., Waltham, MA, USA). The cell survival curve was plotted with time as the X-axis and the OD value as the Y-axis. Each experiment was conducted in triplicate.
EdU assay
Cells were seeded in a 24-well plate. Three replicates were set for each group of cells. EdU solution was added to the culture medium to a concentration of 10 µmol/L. Next, cells were cultured for 2 hours. The cells were fixed in PBS solution containing 4% paraformaldehyde for 15 minutes at room temperature, followed by incubation with PBS containing 0.5% Triton-100 for 20 minutes at room temperature. Then, each well was added with 100 μL Apollo®567 (Guangzhou RiboBio Co., Ltd., Guangdong, China) for 30 minutes at room temperature. DAPI was added to stain the nucleus for 5 minutes, and the number of positive cells in each field was observed and recorded under the fluorescence microscope (FM-600, Shanghai Puda Optical Instrument Co., Ltd., Shanghai, China). Under the microscope, it was observed that total cells were stained blue and the positive cells were stained red. Three visual fields were randomly selected from each well to calculate the proportion of EdU positive cells. The positive rate of EdU = (EdU positive nucleus/total nucleus) × 100% [Citation20].
Scratch test
Cells were seeded in a 6-well plate. The original culture medium was renewed by serum-free DMEM upon the successful attachment of the cells to the wells. As cell confluence reached 90% to 100%, 4 to 5 scratches in each well were created along the center of each well with a 10 μL pipette tip perpendicular to the bottom of the 6-well plate (the width of each scratch was the same). Then the cells received three washes with PBS to remove the debris. The migration distance at the 0th and 24th hours post scratching was observed using an inverted microscope and analyzed with the IPP 7.0 software (Media Cybernetics, Inc., Bethesda, MD, USA). Several visual fields were randomly selected and photographed. Three parallel wells were set in each group, and the experiment was repeated three times.
Transwell assay
The Transwell chamber was transferred to a 24-well plate, the upper membrane surface of the basement membrane was coated with Matrigel (diluted at a ratio of 1:8) and air-dried at room temperature. The PC cells were detached and resuspended with RPMI 1640 medium. The cell density was adjusted into 1 × 10⁶ cell/mL. Cell suspension (200 μL) was added to the apical chamber coated with Matrigel, while the 600 μL RPMI 1640 medium containing 20% FBS was added in the basolateral chamber. After undergoing incubation for 24 hours and 48 hours, cells in the apical chamber were wiped away, fixed by 4% paraformaldehyde for 15 minutes, and then stained with 0.5% crystal violet for 15 minutes. Five fields were randomly selected and the number of cells crossing through the chamber was counted using an inverted fluorescence microscope (XDS-800D, Shanghai CaiKon Optical Instrument Co., Ltd., Shanghai, China). Wells were in triplicates in each group and the experiment was repeated three times, with the mean value obtained.
Flow cytometry
After transfection for 48 hours, cells were centrifuged and re-suspended in PBS. The concentration of cells was adjusted to 1 × 10⁵ cells/mL, and 1 mL 75% pre-cooled ethanol at −20°C ice was added to fix cells for 1 hour at 4°C. Cells were centrifuged for the removal of cold ethanol, after which the cells were water-bathed with 100 μL RNase-A under conditions void of light at 37°C for 30 minutes. Then cells were stained with 400 μL propidium iodide (PI, D0820, Sigma, San Francisco, CA, USA) for 30 minutes at 4°C under dark conditions. A flow cytometer (Gallios, Beckman Coulter Inc., South Kraemer Boulevard Brea, CA, USA) was used to obtain results and read the fluorescence at the excitation wavelength of 488 nm was excited to detect cell cycle progression.
Apoptosis was detected according to the instructions of Annexin-V-FITC apoptosis detection kit (K201-100, Biovision, Mountain View, CA, USA). Annexin-V-FITC/PI solution was prepared by mixing Annexin-V-FITC, PI, and HEPES buffer according to the ratio of 1:2:50. 1 × 10⁵ cells per 100 μL of staining solution were resuspended and gently shaken. Following incubation at room temperature for 15 minutes, 1 mL of HEPES buffer (PB180325, Procell, Wuhan, Hubei, China) was added for shaking and mixing. The fluorescence of FITC and PI was detected by excitation of 525 nm and 620 nm band-pass filter at 488 nm. The experiment was repeated three times.
Statistical analysis
Statistical analyses were conducted using the SPSS 21.0 (IBM Corp. Armonk, NY, USA). The counting data and positive rates of PC tissues and adjacent normal tissues were expressed in the number and percentage of cases and were analyzed by the chi-square test. Measurement data were expressed as the mean ± standard deviation. Unpaired design data were analyzed by unpaired t test. Multiple groups were compared by one-way analysis of variance (ANOVA), followed by Tukey’s post hoc test. The two-way ANOVA was used to compare the data at different time points. Pearson correlation analysis was used to analyze the data correlation between indicators. A value of p < 0.05 was considered to be statistically significant.
Results
Hsa-miR-300 affects PC progression by interacting with DAB1
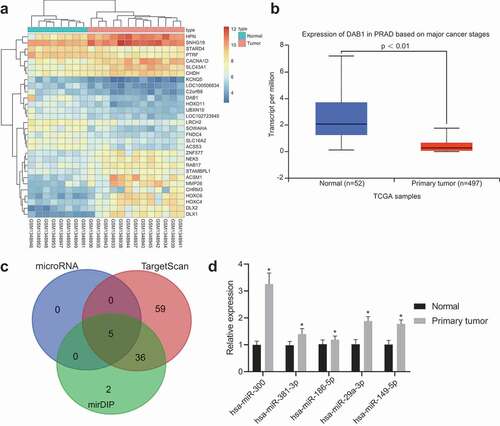
Initially, the GEO database was used to retrieve the PC-related datasets, and finally, the GSE55945 was obtained. After the differential gene analysis for the PC and normal control samples, 532 DEGs were obtained, of which 184 genes were overexpressed and 348 under expressed in PC samples. The heatmap for the top 30 DEGs with a significant difference was shown in ). To further screen out PC-related genes, data were run through the MalaCards database, the findings of which found that the negative regulation of axonogenesis was the most relevant biological process to PC (). Additionally, the GO items involved 532 DEGs in GSE55945 were analyzed and the results showed that only DAB1, ANGPT1, and SNAI2 were included in the negative regulation of axonogenesis. Among the three genes, DAB1 showed the biggest and multiple differences in the GSE55945 dataset. Afterward, the expression of DAB1 in PC samples of the TCGA database was examined ()), and our results showed it was down-regulated. To further elucidate the mechanism of DAB1 in PC, the miRNA target prediction database was used to predict possible miRNAs that interact with DAB1 ()). In the microRNA.org database, only 5 miRNAs were found (). The top 100 miRNAs in the TargetScan database and the top 43 miRNAs in the mirDIP database were found to have all 5 miRNAs in the microRNA.org database in common. Moreover, this analysis indicated that hsa-miR-381-3p and hsa-miR-300 were miRNAs most likely to interact with DAB1. hsa-miR-381-3p has been previously demonstrated to be involved in the migration and invasion of PC and was considered to be a potential target for its novel treatment [Citation21,Citation22]. However, hsa-miR-300 was rarely mentioned. At the same time, hsa-miR-381-3p, hsa-miR-300, hsa-miR-186-5p, hsa-miR-29a-3p, and hsa-miR-149-5p expressions were determined in prostate cancer using RT-qPCR. The results showed that hsa-miR-300 was upregulated most significantly ()). The results of the above analyses suggest that the hsa-miR-300 is highly likely to participate in the progression of PC by regulating the expression of DAB1.
Table 2. The PC-related biological processes
Table 3. Binding of miRs and DAB1
Figure 1. Bioinformatics reveals that Hsa-miR-300 affects PC progression by interacting with DAB1.
PC tissues exhibit a decreased positive expression rate of DAB1 protein
To determine the differential expression of miR-300 and DAB1 in PC, we first examined the expression of DAB1 in PC tissues and BPH tissues by immunohistochemistry, and our data revealed that DAB1 protein was mainly expressed in the cytoplasm, demonstrated as the yellowish-brown or pale brown particles ()). Following statistical analysis, the relative expression of DAB1 protein in BPH and PC tissues was 54.84% and 22.50%, respectively ()), indicating that DAB1 was reduced in PC tissues relative to BPH tissues (p < 0.05).
Figure 2. miR-300 targets DAB1 and exhibits an important role in the progression of PC tissues indicated by dual-luciferase reporter gene assay, immunohistochemistry, and RT-qPCR
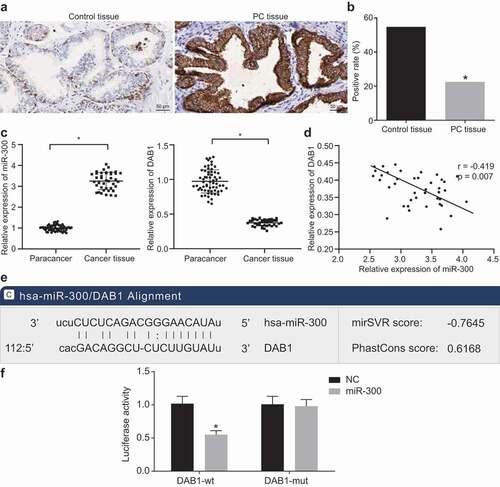
Next, we examined the expression of miR-300 and DAB1 in PC tissues and BPH tissues by RT-qPCR and found that the expression of miR-300 in PC tissues was significantly increased compared with BPH tissue ()). Pearson correlation analysis revealed a clear negative correlation between the expression of miR-300 and DAB1 in PC tissues (p = 0.007; R = −0.419; )).
Thereafter, we analyzed the relationship between miR-300 and pathological characteristics of patients with PC. Our data from the biological prediction website microRNA.org implied that miR-300 could target DAB1 ()). The results from dual-luciferase reporter gene assay verified this prediction as shown in ) that the miR-300 mimic group exhibited decreased luciferase activity of DAB1-wt (p < 0.05), as compared to the NC group, while no significant differences were detected in luciferase activity in DAB1-mut. This suggested that miR-300 could specifically bind to DAB1. DAB1 was a target gene of miR-300.
Finally, our results on clinical data shown in () indicated that the expression of miR-300 was correlated with the tumor, node, metastases stage, Gleason score, and lymph node metastasis, but not with age and prostate-specific antigen (PSA) expression ().
Table 4. The relationship between miR-200 and pathological characteristics of patients with PC
Downregulation of miR-300 decreased the expression of RAC1, MMP2, MMP9, CyclinD1, and CyclinE as well as increased the expression of DAB1 and Rap1 in PC cells
To determine the mechanism through which miR-300 regulates the mRNA and protein expression of the downstream relevant genes by mediating DAB1, we first observed the changes in the expression of the relevant genes after the transfection by RT-qPCR and Western blot analysis. Our results ()) revealed that the expression of miR-300, DAB1, Rap1, RAC1, MMP2, MMP9, CyclinD1, and CyclinE did not exhibit any significant difference between the blank and NC groups (all p> 0.05). However, the mRNA and protein expression of RAC1, MMP2, MMP9, CyclinD1, and CyclinE were significantly increased, while expression of DAB1 and Rap1 were decreased in the miR-300 mimic, siRNA-DAB1 and miR-300 mimic + siRNA-DAB1 groups as compared to the blank and NC groups (all p < 0.05). The expression of miR-300 was also found to be higher in the miR-300 mimic and miR-300 mimic + siRNA-DAB1 groups than the blank and NC groups (all p < 0.05). However, the expression of miR-300 did not present with any significant difference in the siRNA-DAB1 group when compared with the blank and NC groups (p > 0.05). The miR-300 inhibitor group depicted lower expression of miR-300, RAC1, MMP2, MMP9, CyclinD1, and CyclinE but higher than of DAB1 and Rap1 (all p< 0.05). The combined treatment of miR-300 inhibitor and siRNA-DAB1 contributed to a decline in the expression of miR-300, but the DAB1, Rap1, RAC1, MMP2, MMP9, CyclinD1, and CyclinE expression were all reversed, indicating that miR-300 and DAB1 were antagonistic to each other. Further detection in LNCap cells showed that the trend among groups was consistent with that of PC-3 cells ()). Based on these findings, down-regulated miR-300 could decrease the expression of RAC1, MMP2, MMP9, CyclinD1, and CyclinE, while enhance the expression of DAB1 and Rap1.
Figure 3. RT-qPCR and Western blot analysis reveals that down-regulated miR-300 reduces the expression of RAC1, MMP2, MMP9, CyclinD1, and CyclinE, but elevate the level of DAB1 and Rap1
Poorly expressed miR-300 inhibits the adhesion capability of PC cells
To observe the effect of miR-300 and DAB1 on the adhesion ability of PC cells, we initially measured the adhesion ability of PC-3 cells after transfection. The results in ) showed that the adhesion capability of PC-3 cells was not different between the blank and NC groups (p > 0.05). In comparison to the blank and NC groups, the adhesion capability of PC cells was increased in the miR-300 mimic, siRNA-DAB1, and miR-300 mimic + siRNA-DAB1 groups (all p < 0.05), and the increase of that was more pronounced in the miR-300 mimic + siRNA-DAB1 group. Conversely, the miR-300 inhibitor group exhibited suppressed adhesion capability of PC cells (p < 0.05). There was no significant difference in cell adhesion of the cells cotreated with miR-300 inhibitor and siRNA-DAB1 when compared with the blank and NC groups. Relevant experiments were repeated in PC cell line LNCap, the result of which illustrated the trend of each group was consistent with that of the PC-3 cell line ()). These results indicate that down-regulated miR-300 leads to a decrease in the adhesion of PC cells by targeting the DAB1.
Figure 4. Down-regulated miR-300 decreases the adhesion of PC cells by targeting DAB1.
Down-regulation of miR-300 inhibits the proliferation of PC cells
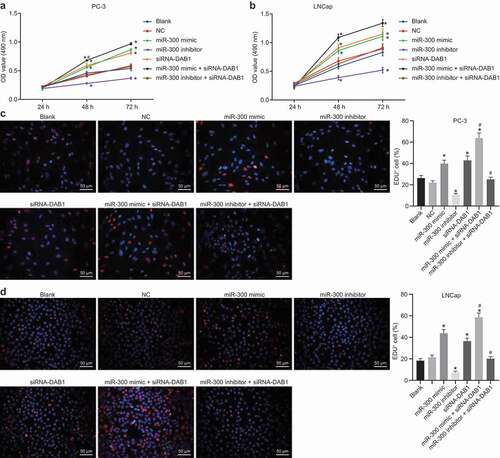
MTT assay and EdU assay were subsequently applied to examine the viability of PC cells and the results ()) indicated that there were no differences in the cell viability amongst the blank, NC, miR-300 mimic, miR-300 inhibitor, siRNA-DAB1, and miR-300 mimic + siRNA-DAB1 groups at the 24th hours (all p > 0.05). However, the cell viability was enhanced as culturing time passes. Compared with the blank and NC groups, the cell viability was higher at 48 hours and 72 hours in the miR-300 mimic, siRNA-DAB1, and miR-300 mimic + siRNA-DAB1 groups (all p < 0.05), with large variability being observed in the miR-300 mimic + siRNA-DAB1 group. Consistent with this result, the miR-300 inhibitor group showed reduced cell viability. Following treatment with miR-300 inhibitor and siRNA-DAB1, the cell viability ability of PC-3 cells was higher than that of miR-300 inhibitor treatment alone, which was not significantly different from the blank and NC groups (p > 0.05). At the same time, the experiment was repeated in LNCap cells and the trend of results in each group was consistent with that of PC-3 ()). In the EdU experiment, the results showed that the proliferation of miR-300 overexpressed or DAB1 silenced cells was increased significantly ()). These results indicate that either up-regulation of miR-300 or DAB1 silencing can result in the enhancement of cell proliferation while inhibition of miR-300 suppresses the proliferation of PC cells.
Figure 5. MTT and EdU assay reveals that the up-regulation of miR-300 or DAB1 silencing can enhance cell proliferation, while inhibition of miR-300 suppresses the proliferation of PC cells
Down-regulation of miR-300 suppresses the migration of PC cells
Scratch test was also conducted to examine the migration ability of PC-3 cells. As shown in ), there was no difference in the migration abilities of PC-3 cells between the blank and NC groups (p > 0.05). On the other hand, miR-300 mimic, siRNA-DAB1, and miR-300 mimic + siRNA-DAB1 groups presented with increased migration ability, but reduced in the miR-300 inhibitor group when compared to the blank and NC groups (all p< 0.05). The migration distance was the highest in the miR-300 mimic + siRNA-DAB1 group. After miR-300 and siRNA-DAB1 were depleted at the same time, the ability of cell migration increased to the same level as the blank and NC groups (p > 0.05). Moreover, the experiment was repeated in LNCap cells and the trend of each group was consistent with that of PC-3 ()). Therefore, overexpression of miR-300 could promote the migration of PC cells by inhibiting the DAB1expression.
Figure 6. Scratch test indicates that down-regulated miR-300 suppresses the migration of PC cells upon treatment with miR-300 mimic/inhibitor and/or siRNA-DAB1.
Down-regulation of miR-300 inhibits the invasion of PC cells
The cell invasion ability of PC-3 cells was measured using the Transwell assay ()). The cell invasion of PC cells did not differ between the blank and NC groups (p > 0.05). When compared with the blank and NC groups, the invasion ability was enhanced in PC cells in the miR-300 mimic, siRNA-DAB1, and miR-300 mimic + siRNA-DAB1 groups (all p < 0.05), and the elevation of that was more pronounced in the combination group. However, the miR-300 inhibitor group presented with diminished PC-3 cell invasion (p < 0.05), while the addition of siRNA-DAB1 counteracted the inhibitory effect of miR-300 inhibitor in PC-3 cell invasion versus the blank and NC groups (p > 0.05). Transwell assay with LNCap cells as the study subject yielded consistent results as that of PC-3 cells ()). Hence, the overexpression of miR-300 could facilitate the invasion of PC cells via the inhibition of DAB1.
Figure 7. Transwell assay reveals that down-regulated of miR-300 reduces the invasion of PC cells by up-regulating DAB1.
Down-regulation of miR-300 inhibits cell cycle progression and promotes apoptosis of PC cells
Flow cytometry and Annexin-V-FITC/PI dual staining were used to detect the cell cycle distribution ()) and apoptosis ()) of PC PC-3 cells. The progression of the PC-3 cell cycle and apoptosis did not show a significant difference between the blank and NC groups (p > 0.05). In the miR-300 mimic, siRNA-DAB1, and miR-300 mimic + siRNA-DAB1 groups, fewer cells were arrested at G0/G1 phases and more cells were found to be arrested at S and G2/M phrases, and apoptosis was less compared with the blank and NC groups, among which the changes were the most variable in the miR-300 mimic + siRNA-DAB1 group. Whereas, the miR-300 inhibitor group exhibited more cells at the G0/G1 phases and fewer at S and G2/M phases and higher apoptosis (p < 0.05). When PC-3 cells receive treatment with miR-300 inhibitor and siRNA-DAB1 simultaneously, no significant difference in the proportion of cells and apoptosis was shown relative to the blank and NC groups (p > 0.05). When we continued to detect the cell cycle of LNCap cells by flow cytometry ()) and apoptosis by Annexin-V-FITC/PI dual staining ()), trends of each group were consistent with that of PC-3 cells, indicating that overexpressed miR-300 accelerated cell cycle by inhibiting DAB1.
Figure 8. Flow cytometry assay revealed that down-regulated miR-300 reduces cell cycle and promotes apoptosis by up-regulating DAB1 expression
Discussion
PC is a commonly diagnosed malignancy and the second leading cause of cancer-related death in males [Citation23]. The clinical heterogeneity, metastatic ability and high rate of recurrence accounts for the challenges faced in the treatment of PC [Citation1]. Recently, circulating miRNAs are emerging as strong diagnostic tools and have been correlated with the progression of PC [Citation24]. Herein, we investigated the effects of miR-300 on the cell invasion, migration, proliferation, adhesion, cell cycle progression, and apoptosis of PC cells with the involvement of DAB1. Based on our findings, PC tissues presented with significantly increased miR-300 expression, and downregulated DAB1 in comparison with the levels noted in the BPH tissues. In addition, miR-300 expression was found to be significantly correlated with lymph node metastasis, Gleason score, and TNM stage, as per the results of clinicopathological analysis. Furthermore, miR-300 could potentially downregulate DAB1 expression by binding to the 3′UTR of DAB1, promoting PC cell invasion, migration, proliferation, and adhesion.
Intriguingly, our results were indicative of the high expression of miR-300 present in PC cells while DAB1 exhibited poor expression. Accordingly, previously reported data has also suggested that miR-300 is overexpressed in colorectal cancer [Citation12]. Previous studies have also highlighted the poor expression of DAB1 present in breast cancer [Citation25]. Additionally, the down-regulation of DAB1 has also been reported in glioblastoma and neuroblastoma, which also found a strong association with migration [Citation26,Citation27]. Consistently, the interaction between miR-300 and DAB1 was verified from the results obtained from dual-luciferase reporter gene assay, which found a high expression of miR-300 in PC, along with a lower expression of DAB1, which could potentially be secondary to the regulatory function of the former. Accordingly, significantly higher expression of miR-300 has been reported in laryngeal squamous cell carcinoma tissues as compared to the adjacent non-cancerous tissues, and lymph node metastasis, whereas, TNM stage were profound influencers for the expression of miR-300 [Citation28], indicating its potential role as an independent prognostic factor for patients with tumors.
Furthermore, our study reported that the downregulation of miR-300 results in the reduction of mRNA and protein expression of RAC1, MMP2, MMP9, CyclinD1, and CyclinE but conversely increased the expression of DAB1 and Rap1 in PC cells. Accordingly, RAC1 was found to be overexpressed in PC [Citation29] and involved in cell adhesion and migration as well as in increased tumor invasiveness [Citation30]. Moreover, highly expressed MMP2 has been attributed to the poor prognosis of PC [Citation31]. Whilst another study reported statistically prominent elevation in cyclin A1, MMP2, and MMP9 expression when compared with adjacent benign specimens [Citation32]. Importantly, there exists a significant positive correlation between Cyclin A1, MMP2, MMP9, and VEGF expression in PC [Citation32]. CyclinD1 is known to regulate the cell cycle by stimulating phosphorylation of the retinoblastoma protein, which subsequently triggers the transcription of various genes required for G1 progression [Citation33]. Nonetheless, overexpressed CyclinD1 results in the enhancement of tumorigenicity of LNCaP cells [Citation30].
Subsequently, our data confirmed that down-regulated miR-300 binds to DAB1 and leads to reduced invasion, migration, proliferation, and adhesion capability of PC cells. Previous work demonstrated that aberrantly expressed miRNAs were significantly involved in the regulation of invasion and metastasis of PC cells [Citation34]. Nonetheless, high expression of miR-300 contributes to increased proliferation and migration of PC cells while restricting apoptosis [Citation13], thus corroborating the connection between miRNAs and PC [Citation35]. Moreover, in gastric cancer, proliferation and metastasis are promoted by the poor expression of DAB2IP [Citation36], suggesting the inhibitory effects of highly expressed DAB2. Hence, these findings further demonstrated that inhibited miR-300 could result in the suppression of adhesion, migration, and invasion of PC cells by up-regulating the expression of DAB1. Rap1 has been reported to play multiple roles during early and late cortical development while down-regulation of Rap1 signaling by Dab2IP could have a significant importance in the later stages of cortical development [Citation37]. Further studies have reported the role of Rap1 in the regulation of cell adhesion [Citation38,Citation39]. It has been demonstrated that SIPA1 promotes tumor cell invasion and metastasis in prostate cancer cells, at least partially through the inhibition of the Rap1-mediated cell adhesion to ECM [Citation40]. Furthermore, studies have also illustrated the inhibitory effect of Rap1 signaling-related molecules on cell proliferation and invasion [Citation41]. Yet the comprehensive understanding regarding the role of Rap1 in mediating cell adhesion in tumor cell invasion and metastasis requires further studies.
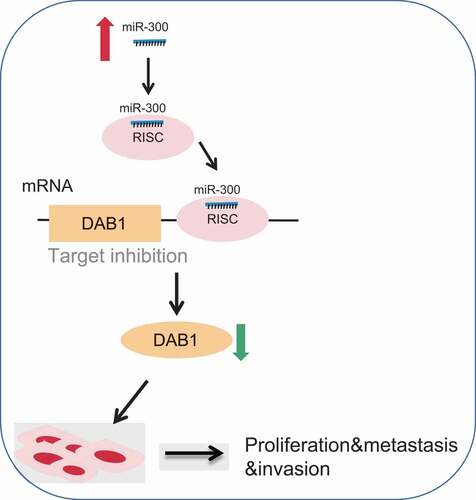
In summary, our present study demonstrated that the down-regulation of miR-300 suppressed the adhesion, migration, and invasion, while promoting apoptosis of PC via DAB1 upregulation (), providing a novel therapeutic target for PC. However, the mechanistic relationship between miR-300 and PC remains elusive and required further studies.
Figure 9. The molecular mechanism involved miR-300 targeting DAB1 in PC. MiR-300 inhibited the expression of DAB1 so that the expression of RAC1, MMP2, MMP9, CyclinD1, and CyclinE was increased. Down-regulated miR-300 suppressed proliferation, adhesion, migration, invasion, and cell cycle, but promoted apoptosis of PC cells. While down-regulation of miR-300 could reverse the above tendency and provided a therapeutic target for PC
Author’s contributions
Lin Li conceived and together with Jing Hao and Cheng-Quan Yan designed the study. He-Feng Wang, Bin Meng and Sheng-Yong Cai were involved in data collection. Lin Li, Jing Hao and Sheng-Yong Cai performed the statistical analysis and preparation of figures. Cheng-Quan, Yan He-Feng Wang and Bin Meng drafted the paper. All authors read and approved the final manuscript.
Acknowledgments
We would also like to thank all participants enrolled in the present study.
Disclosure statement
No potential conflict of interest was reported by the authors.
Additional information
Funding
References
- Taylor BS, Schultz N, Hieronymus H, et al. Integrative genomic profiling of human prostate cancer. Cancer Cell. 2010;18(1):11–22. .
- Rawla P. Epidemiology of prostate cancer. World J Oncol. 2019;10(2):63–89.
- Scher HI, Fizazi K, Saad F, et al. Increased survival with enzalutamide in prostate cancer after chemotherapy. N Engl J Med. 2012;367(13):1187–1197. .
- Beltran H, Beer TM, Carducci MA, et al. New therapies for castration-resistant prostate cancer: efficacy and safety. Eur Urol. 2011;60(2):279–290. .
- Huncharek M, Kupelnick B, Kupelnick B. Smoking as a risk factor for prostate cancer: a meta-analysis of 24 prospective cohort studies. Am J Public Health. 2010;100(4):693–701.
- Daniyal M, Siddiqui ZA, Akram M, et al. Epidemiology, etiology, diagnosis and treatment of prostate cancer. Asian Pac J Cancer Prev. 2014;15(22):9575–9578. .
- Ni J, Li Y, Li Y, et al. Epithelial cell adhesion molecule (EpCAM) is associated with prostate cancer metastasis and chemo/radioresistance via the PI3K/Akt/mTOR signaling pathway. Int J Biochem Cell Biol. 2013;45(12):2736–2748.
- Wittmann D, Northouse L, Foley S, et al. The psychosocial aspects of sexual recovery after prostate cancer treatment. Int J Impot Res. 2009;21(2):99–106. .
- Porkka KP, Pfeiffer MJ, Waltering KK, et al. MicroRNA expression profiling in prostate cancer. Cancer Res. 2007;67(13):6130–6135. .
- Cruz FM, Tome M, Bernal JA, et al. miR-300 mediates Bmi1 function and regulates differentiation in primitive cardiac progenitors. Cell Death Dis. 2015;6(10):e1953. .
- Zhang Y, Guo Y, Yang C, et al. MicroRNA-300 targets hypoxia inducible factor-3 alpha to inhibit tumorigenesis of human non-small cell lung cancer. Neoplasma. 2017;64(4):554–562. .
- Wang L, Yu P. miR-300 promotes proliferation and EMT-mediated colorectal cancer migration and invasion by targeting p53. Oncol Rep. 2016;36(6):3225–3232.
- Zhang JQ, Chen S, Gu JN, et al. MicroRNA-300 promotes apoptosis and inhibits proliferation, migration, invasion and epithelial-mesenchymal transition via the Wnt/beta-catenin signaling pathway by targeting CUL4B in pancreatic cancer cells. J Cell Biochem. 2018;119(1):1027–1040. .
- McAvoy YZ S, Perez DS, James CD, et al. Disabled-1 is a large common fragile site gene, inactivated in multiple cancers. Genes Chromosomes Cancer. 2008;47:(2):165–174.
- Huang Y, Magdaleno S, Hopkins R, et al. Tyrosine phosphorylated Disabled 1 recruits Crk family adapter proteins. Biochem Biophys Res Commun. 2004;318(1):204–212. .
- Cao KL RJ, Xing WY, Du S, et al. Disabled-1 is down-regulated in clinical breast cancer and regulates cell apoptosis through NF-kappaB/Bcl-2/caspase-9. J Cell Mol Med. 2019;23:(2):1622–1627.
- Fujikake K, Sawada M, Hikita T, et al. Detachment of chain-forming neuroblasts by Fyn-mediated control of cell–cell adhesion in the postnatal brain. J Neurosci. 2018;38(19):4598–4609. .
- Albisinni S, Joniau S, Quackels T, et al. Current trends in patient enrollment for robotic-assisted laparoscopic prostatectomy in Belgium. Cancer. 2017;123(21):4139–4146. .
- Brown RS, Wahl RL. Overexpression of Glut-1 glucose transporter in human breast cancer. An immunohistochemical study. Cancer. 1993;72:2979–2985.
- Ning H, Albersen M, Lin G, et al. Effects of EdU labeling on mesenchymal stem cells. Cytotherapy. 2013;15(1):57–63. .
- McDonald MV AC, Shen J, Sanda M, et al. Circulating microRNAs in plasma as potential biomarkers for the early detection of prostate cancer. Prostate. 2018;78(6):411–418.
- Formosa A, Markert EK, Lena AM, et al. MicroRNAs, miR-154, miR-299-5p, miR-376a, miR-376c, miR-377, miR-381, miR-487b, miR-485-3p, miR-495 and miR-654-3p, mapped to the 14q32.31 locus, regulate proliferation, apoptosis, migration and invasion in metastatic prostate cancer cells. Oncogene. 2014;33(44):5173–5182. .
- Jemal A, Xu J, Ward E. Cancer statistics. CA Cancer J Clin. 2010;60:277–300.
- Bryant RJ, Pawlowski T, Catto JW, et al. Changes in circulating microRNA levels associated with prostate cancer. British Journal of Cancer. 2012;106(4):768–774..
- Cao LIK R, Xing W, Wang Y, et al. Expression of Disabled-1 in human breast cancer cells and its role in cell cycle. J Jilin Univ. 2016;42:932–936.
- Schulze M, Violonchi C, Swoboda S, et al. RELN signaling modulates glioblastoma growth and substrate-dependent migration. Brain Pathol. 2018;28(5):695–709. .
- Becker J, Frohlich J, Perske C, et al. Reelin signalling in neuroblastoma: migratory switch in metastatic stages. Int J Oncol. 2012;41(2):681–689. .
- He FY, Liu HJ, Guo Q, et al. Reduced miR-300 expression predicts poor prognosis in patients with laryngeal squamous cell carcinoma. Eur Rev Med Pharmacol Sci. 2017;21:760–764.
- Engers R, Ziegler S, Mueller M, et al. Prognostic relevance of increased Rac GTPase expression in prostate carcinomas. Endocr Relat Cancer. 2007;14(2):245–256.
- Zins K, Lucas T, Reichl P, et al. A Rac1/Cdc42 GTPase-specific small molecule inhibitor suppresses growth of primary human prostate cancer xenografts and prolongs survival in mice. PLoS One. 2013;8(9):e74924. .
- Trudel YF D, Meyer F, Harel F, et al. Prostate cancer: MMP2, MMP9, MMP14, TIMP2 and disease-free survival. Cancer Res. 2004;64(7):1154. https://cancerres.aacrjournals.org/content/64/7_Supplement/264.1.short.
- Wegiel B, Bjartell A, Tuomela J, et al. Multiple cellular mechanisms related to cyclin A1 in prostate cancer invasion and metastasis. J Natl Cancer Inst. 2008;100(14):1022–1036. .
- Fu CW M, Pestell RG, Pestell RG, et al. Minireview: cyclin D1: normal and abnormal functions. Endocrinology. 2004;145:(12):5439–5447.
- Avci CB, Harman E, Dodurga Y, et al. Therapeutic potential of an anti-diabetic drug, metformin: alteration of miRNA expression in prostate cancer cells. Asian Pac J Cancer Prev. 2013;14(2):765–768.
- Schaefer A, Jung M, Kristiansen G, et al. MicroRNAs and cancer: current state and future perspectives in urologic oncology. Urol Oncol. 2010;28(1):4–13.
- Sun L, Yao Y, Lu T, et al. DAB2IP downregulation enhances the proliferation and metastasis of human gastric cancer cells by derepressing the ERK1/2 pathway. Gastroenterol Res Pract. 2018;2018:2968252.
- Qiao S, Homayouni R. Dab2IP regulates neuronal positioning, Rap1 activity and integrin signaling in the developing cortex. Dev Neurosci. 2015;37(2):131–141.
- Zheng H, Gao L, Feng Y, et al. Down-regulation of Rap1GAP via promoter hypermethylation promotes melanoma cell proliferation, survival, and migration. Cancer Res. 2009;69(2):449–457.
- Mathieu V, Pirker C, Schmidt WM, et al. Aggressiveness of human melanoma xenograft models is promoted by aneuploidy-driven gene expression deregulation. Oncotarget. 2012;3(4):399–413.
- Shimizu Y, Hamazaki Y, Hattori M, et al. SPA-1 controls the invasion and metastasis of human prostate cancer. Cancer Sci. 2011;102(4):828–836.
- Zhang YL, Wang RC, Cheng K, et al. Roles of Rap1 signaling in tumor cell migration and invasion. Cancer Biol Med. 2017;14(1):90–99.