
ABSTRACT
MicroRNA functions as an oncogenic regulator or tumor suppressor in various human tumors. Although bioinformatics analysis suggested that miRNA-20b-5p may be associated with the tumorigenesis, its role in colon cancer remains elusive. To investigate the role of miRNA-20b-5p, HCT116 cell, a human colon cancer cell line used in therapeutic research and drug screenings, was chosen as a model system for our in vitro studies. We first carried out bioinformatics and microarray analysis. To gain further mechanism insight, flow cytometry was performed to determine cell apoptosis and cell cycle, and western blot or immunohistochemistry were employed to check the expression of CCND1/CDK/FOXM1 axis in HCT116 cells. In addition, wound-healing migration assay and transwell assay were conducted to uncover the effect of miR-20b-5p on tumor migration and invasion. Finally, we examined the role of miR-20b-5p by subcutaneous xenograft mouse models. Our data have shown that miRNA-20b-5p inhibited the cell cycle, migration, and invasion in HCT116 cells, but had no effect on cell apoptosis. CyclinD1 (CCND1) was identified as a direct target of miR-20b-5p. Overexpression of miRNA-20b-5p downregulated CCND1 level in HCT-116 cells. Mechanically, the inhibition of cell cycle, migration, and invasion of CC cells mediated by miRNA-20b-5p are through regulating the CCND1/CDK4/FOXM1 axis. Furthermore, miRNA-20b-5p inhibited the tumorigenesis in Balb/c nude mice CC xenograft models. Our data demonstrated that miR-20b-5p may serve as a tumor suppressor in colon cancer by negatively regulating CCND1, implying that miR-20b-5p could be a potential therapeutic target for the treatment of colon cancer.
KEYWORDS:
Background
Colon cancer (CC) accounts for about 10% of the global total diagnosed of cancers each year and is the second most common cancer in women and the third most common cancer in men [Citation1]. Accordingly, CC remains one of the leading causes of cancer-related death with high worldwide mortality rates (above 40%) [Citation2,Citation3]. Thus, mechanistic understanding of the initiation, progression, and metastasis of CC is crucial to develop effective treatments for patients with CC.
MicroRNAs, a class of endogenous non-coding single-stranded RNAs which contains approximately 19–25 nucleotides in length, can specifically bind to target genes and inhibit gene expression. Due to their extensive role in regulating gene expression, microRNAs interact with many cellular networks and signaling pathways to play a crucial role in many physiological and pathophysiological processes, such as proliferation, differentiation, apoptosis, and even influence the occurrence and development of inflammation and tumors [Citation4,Citation5,Citation6].
miR-17 family, which contains six miRNAs (miR-17-5p, miR-20a-5p, miR-106b-5p, miR-20b-5p, miR-93-5p, and miR-106a-5p), is important in the development of diverse diseases including cancers and autoimmune diseases. As Oncomirs, these miRNAs promote proliferation, inhibit apoptosis, and induce tumor angiogenesis [Citation7]. Yet, in some contexts, the miR-17 family negatively regulates cell proliferation [Citation8] and inhibits cell migration and invasion [Citation9]. miR-20b-5p, a member of miR-17 family, has been reported to be abnormally expressed in many human malignancies. Mechanistically, miR-20b-5p has been reported to act as a tumor-suppressor miRNA in human breast cancer and papillary thyroid carcinoma via regulating the expression of VEGF and MAPK/ERK signaling pathways, respectively [Citation10,Citation11]. Conversely, miR-20b-5p has been demonstrated to be negatively correlated with the prognosis of gastric cancer and hepatocellular carcinoma [Citation12], indicating miR-20b-5p may play a complex role in various tumors through different target genes.
Our previous bioinformatics analysis suggested that the majority of miR-17 family members were highly expressed in gastrointestinal samples in comparison to normal intestinal tissue. However, the level of miR-20b-5p was suppressed in colorectal cancer [Citation13–15]. Intriguingly, there was a positive correlation between the expression level of miR-20b-5p and the clinical outcomes; the better overall survival and progression-free survival rate in CC patients were significantly associated with higher miR-20b-5p levels [Citation16]. So far, the underlying mechanisms of miR-20b-5p in the regulation of the pathogenesis of CC remain poorly understood. Therefore, the goal of our study was to elucidate the biological functions and mechanisms of miR-20b-5p in CCs by various in vitro and in vivo approaches.
Materials and methods
Cell culture
The human colon cancer cell line (HCT-116, SW480, and HT29), normal intestinal epithelial cell line (HIEC), 293 T cells, and 3T3 cells were all obtained from the Shanghai Institute of Biochemistry and Cell Biology, Chinese Academy of Sciences (Shanghai, P.R. China). Cells were cultured in Dulbecco’s modified Eagle’s medium supplemented with 10% fetal bovine serum and penicillin-streptomycin in cell incubator with 5% CO2 at 37°C. The culture medium was changed every other day. MicroRNA mimics or plasmids were transfected using Lipofectamine 2000 according to the manufacturer’s instruction.
Lentivirus preparation and stable-transfected cell line
MiR-20b-5p was cloned into the HBLV-ZsGreen-PURO vector (Hanbio biotechnology Co., Ltd, Shanghai, China) and its auxiliary packaging original vector plasmid (pSPAX2 and pMD2G) were prepared. These three plasmids were co-transfected into 293 T cells, and the culture media was changed to the complete media 6 h post-transfection. After Cells were cultured for another 48 and 72 h, the cell supernatant was collected to prepare lentivirus particles by centrifuging at 4°C, 2000 × g, 10 min to remove the cell debris. The pre-cleared supernatant went through ultra-centrifugation at 4°C, 82700 × g, 120 min to prepare a high titer of lentiviral particles. After HCT116 cells were in ~50% confluence, the virus was added into the culture media in the presence of 4 µg/ml polybrene. 48 h later, GFP positive cells were collected by the flow sorting technology and further expanded for downstream experiments.
RNA oligonucleotides transfection
MiR-20b-5p-mimics, miR-20b-5p inhibitor (Shanghai Tuoran Biological Technology Co., Ltd.), CCND1 siRNA, or nonspecific siRNA (Santa Cruz Biotechnology) were transfected into the colon cancer cells using Lipofectamine 2000 (Invitrogen, USA) according to the manufacturer’s protocol, respectively. The sequences of the siRNA oligonucleotides were listed in . 48 h after transfection, RNA, and protein were isolated for the following experiments.
Table 1. Primer sequences used in the present study
Apoptosis and cell cycle assay
Annexin V/7-AAD Apoptosis Detection Kit from BD was used to detect the apoptosis following the manufacturer’s instruction. Anti-Ki67 and Hoechst were stained for the cell cycle experiment. All flow cytometric analyses were performed using an LSR II Fortessa cytometer (BD Biosystems), and the data were analyzed by FlowJo software.
CCK8 assay
After transfection with negative control miR-20b-5p inhibitor, or pCMV-CCND1 for 24 h, 1*103 HCT-116 cells were seeded per well in 96-well plates. The Cell Counting Kit-8 (Beyotime Institute of Biotechnology, Haimen, China) was added to each well and incubated for 2 h at 37°C. Absorbance was measured at 24, 48, 72 and 96 h at 450 nm using a multi-well spectrophotometer according to the manufacturer’s protocol.
Wound-healing migration assay
Cells (1 × 10⁵) were seeded into the culture insert (ibidi, German) in the middle of a 24-well plate Dish. After the cells were confluence in the insert area, the insert was removed with tweezers, a 500 μm wide scratch was generated. The plate was incubated at 37°C in a serum-free medium. The migration of cells into the wounded area was recorded every 4–6 h using an inverted microscope (magnification, 20×).
Cell transwell assays
Cells (5 × 10⁴) were re-suspended in serum-free medium and seeded at the upper chamber. The lower portion of the well was filled with 500 μl medium with 10% FBS. After 24 h of incubation, cells were stained with crystal violet-staining solution (Beyotime, Nantong, China) then counted and photographed (five views per well). All experiments were performed in triplicate.
Quantitative real-time PCR
RNA samples were isolated using TRIzol Reagent (Invitrogen), according to the manufacturer’s procedures. SYBR Green PCR reagents were purchased from Takara, and RT-PCR was performed following the manufacturer’s protocol in an ABI 7500 PCR machine (Applied Biosystems). The detailed primer sequences were listed in .
Western blotting
Cell lysates were collected in SDS lysis buffer (ddH2O 37 ml, 10% SDS 10 ml, pH7.5 Tris-HCL 3 ml). Protein concentration was quantified by BCA protein assay according to manufacturers’ instruction (Thermo Fisher Scientific, USA). Proteins were loaded on 8–12% SDS-PAGE gel and transferred to the PVDF membrane. Primary antibodies used for western blot analysis were: CCND1 (2978S, Cell Signaling Technology), CCND3 (2936, Cell Signaling Technology), CDK4 (12790S, Cell Signaling Technology), CDK6 (3136S, Cell Signaling Technology), FOXM1 (20459, Cell Signaling Technology), p-FOXM1 (14655, Cell Signaling Technology), RB1(9309, Cell Signaling Technology), phospho-Rb1(Ser807/811) (8516P, Cell Signaling Technology), TWIST(sc-81417, SANTA CRUZ Biotechnology), TGF-β1(ab92486, Abcam) and beta-actin (AC-40, Sigma-Aldrich, USA). Secondary antibodies used were HRP-linked goat anti-rabbit/mouse IgG (Cell Signaling technology, MA). Immune complexes were visualized by ECL Western Blotting Detection Reagents (Merck Millipore, USA) and captured by an image Reader (Amersham Imager 600, GE healthcare Life Sciences).
Dual-luciferase reporter system analysis
The 3’UTR sequence of CCND1 was subcloned into the pSicheck2-control vector (Promega) to construct pSicheck2-CCND1-WT. QuickChange site directed mutagenesis kit (TOYOBO) was used to construct the specifically mutated CCND1 gene 3’UTR fragment to generated different plasmids (pSicheck2-CCND1-Mut1, pSicheck2-CCND1 -Mut2, or pSicheck2-CCND1-Mut1 + 2). These plasmids were co-transfected with miR-20b-5p mimics or control into 293 T cells by using Lipofectamine 2000 (Invitrogen), before analyzed for luciferase activity using the Dual-luciferase reporter assay system (Promega). This experiment was repeated three times in triplicate.
Subcutaneous xenograft mouse models
HCT116 cells which were stably transfected with miR-20b-5p expression vector or control vector (1 × 10⁷ cells/0.2 mL PBS) were injected subcutaneously into the left and right flanks of 6-week-old female Balb/c nude mice (n = 6/group), respectively. Tumor size was measured every 2 days for 4 weeks using a digital caliper. Tumor volume (mm3) was calculated by measuring the longest (L) and shortest (W) diameters of the tumor and calculated by the following formula (tumor volume = L*W2/2). 4 weeks after implantation, mice were sacrificed and the weights of their xenograft tumors were determined. The excised tissues were fixed in 10% neutral-buffered formalin for immunohistochemistry experiment.
Immunohistochemistry
The excised tumor tissues were fixed in 10% neutral-buffered formalin, then 4% paraformaldehyde-fixed paraffin-embedded tumors were stained with anti-CCND1 (2978S, Cell Signaling Technology) antibody at a concentration of 1:100 dilution.
Microarray analysis
HCT-116 cells were transfected with miR-20b-5p-NC and miR-20b-5p-mimics according to the manufacture of lipofectamine 2000. 48 h later, total RNA was extracted using TRIzol Reagent (15596–018; Life Technologies). Array hybridization (901229) and scan (00–00212; both from Affymetrix) were performed according to the manufacturer’s instructions. Raw data were normalized using MAS 5.0 algorithm, Gene Spring Software 11.0 (Agilent Technologies, Santa Clara, CA). Gene function classification and KEGG analysis were performed by Gene Spring Software 11.0.
Bioinformatics prediction
The method we used to predict the potential target gene of miR-20b-5p was based on the online bioinformatical software including Target Scan (www.targetscan.org) and miRDB (www.mirdb.org) .
Statistical analysis
The results were expressed as mean ± SEM. Statistical analysis was performed using GraphPad Prism 8.0 software. Unpaired Student’s t-tests (only two groups), One-Way ANOVA (more than two groups), and Two-Way ANOVA (for tumor growth analysis) were used to calculate P values where appropriate. P < 0.05 was considered statistically significant. Error bars indicate the standard deviation in all the figures.
Results
miR-20b-5p was down-regulated in colon cancer cells
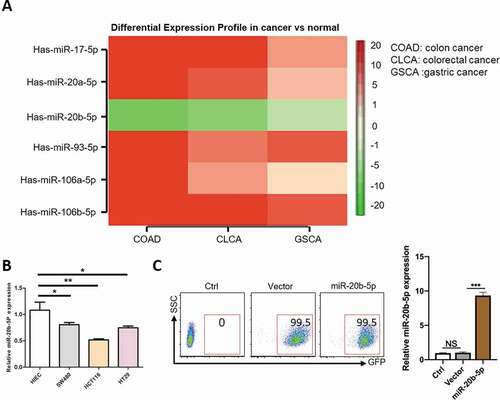
MiR20b-5p, a member of miR-17 family, is encoded by the miR-106a-363 cluster, which is located on human chromosome X [Citation17]. Through the Cancer Genome Atlas (TCGA) data and bioinformatics analysis, we identified that miR-20b-5p was the only miR-17 family member, which was significantly decreased in primary gastrointestinal tumor samples, especially in colon cancer, in comparison to normal intestinal tissue samples. In sharp contrast, the levels of other miR-17 members, including miR-17-5p, miR-20a-5p, miR-106b-5p, miR-93-5p and miR-106a-5p, were higher in gastrointestinal tumor samples ()), indicating the distinct biology of miR-20b-5p in colon cancer [Citation15]. To validate this finding, we performed a real time-PCR experiment to compare the level of miR-20b-5p in several colon cancer cell lines to that in normal intestinal epithelial cells. Consistent with the finding in primary tumor cells, the level of miR-20b-5p was lower in colon cancer cell lines, especially in HCT116 cells, than that in normal intestinal epithelial cells ()). To further study the role of miR-20b-5p in colon cancer, we chose HCT116, a human colon cancer cell line used in therapeutic research and drug screenings, for the downstream studies. We first generated a stable HCT116, which overexpressed miR-20b-5p by nearly 10-fold compared with the control group ()).
Figure 1. Reduced miR-20b-5p level in colon cancer. (a) The heatmap of expression of miR-17 family in gastrointestinal carcinoma. (b) The relative expression of miR-20b-5p in normal intestinal epithelial cells and colon cancer cell lines. (c) The representative flow cytometric analysis of transfected efficiency of anti-virus in HCT-116 cell line and the expression of miR-20b-5p was detected by Real-time PCR
MiR-20b-5p inhibits proliferation, migration, and invasion of CC cells in vitro
To understand the biology of miR-20b-5p in HCT116 cells, apoptosis, and cell cycle experiments were performed. No difference was detected from Annexin-V/7-AAD staining, suggesting miR-20b-5p had no impact on apoptosis (–b)). However, compared to the control group, significantly more cells were detected in G0 and G1 phases, while less cells in S/G2/M phases, in the miR-20b-5p overexpressed cells (-d)). The PI (Propidium iodide) staining also conducted to subdivide S and G2/M phases, and get the same results (Figure S1A-B). CCK-8 assay further demonstrated that the proliferative capacity was compromised in miR-20b-5p overexpressed group ()). The same proliferative effect is seen in HT29 cell lines (Figure S2A-C). Furthermore, decreased miR-20b-5p in HCT-116 cells slightly enhanced cell proliferation, but it was not statistically significant (Figure S3A-C). These findings suggested that miR-20b-5p inhibited the proliferation of HCT116 cell line by blocking cell cycle progression at the G1/S transition, but had no effect on cell apoptosis.
Figure 2. miR-20b-5p inhibits the cell cycle, migration and invasion, but does not affect the apoptosis in colon cancer cells. HCT-116 cells which were stably transfected with miR-20b-5p expression vector or control vector were used for following experiments. (a-b) Cell viability was determined by Annexin V/7-AAD staining. Representative flow cytometric analysis of apoptosis (a) and statistical histogram was shown at right (b). (c-d) cell proliferation assay was performed by Ki-67/Hoechst staining and flow cytometric assay. Results of flow cytometric analysis (c) and percentages of G0/G1/G2-S-M were shown (d). (e) CCK-8 was used to estimate the proliferative capacity at different time point. (f-g) Wound-healing migration assay (f) and cell transwell assay (g) were performed to examine the effect of miR-20b-5p on migration and invasion in vitro. HCT116 cells expressing miR-20b-5p or negative control were plated and representative microscopy images (20×) were shown. Data are presented as mean ± SEM from three independent experiments performed in triplicate. Data are expressed as mean ± s.e.m. *P ≤ 0.05, **P ≤ 0.01
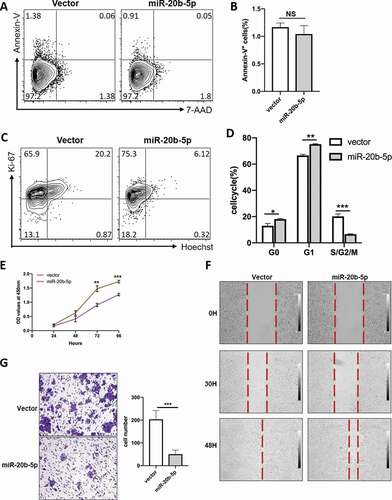
To further determine whether miR-20b-5p has any impact on migration and invasion of colon cancer cell, we conducted the wound-healing migration assay and transwell assay. As shown in -), the width of the wound was significantly broader in miR-20b-5p overexpressed CC cells compared with that in the control cells. In line with the wound-healing assay data, the results of transwell assay indicated that over-expression of miR-20b-5p inhibited the invasiveness of HCT-116 cell. Taken together, these data indicated that over-expression of miR-20b-5p inhibited cell cycle, migration, and invasion, but not apoptosis in CC cells.
MiR-20b-5p suppresses tumor growth in vivo
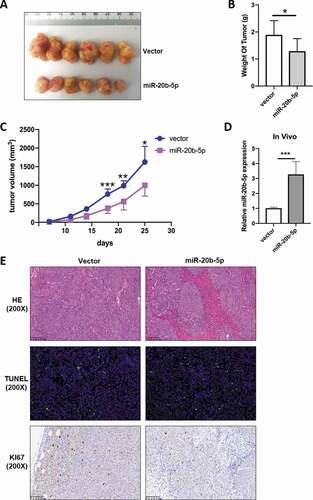
To further investigate the effect of miR-20b-5p on tumor growth in vivo, we injected miR-20b-5p-overexpressed or control HCT-116 cells into the left flank of mice and tracked the tumor growth. To serve as a good control, we also injected control HCT-116 cells into the right flank of the same mouse (n = 6). Our data showed that the tumors from miR-20b-5p-overexpressed cells grew slower than xenografts derived from control cells ()). The average weight and volume of the miR-20b-5p-overexpressed tumors were significantly lower than those of control tumors (-c)), suggesting that miR-20b-5p played an important role in inhibiting the in vivo growth of colon cancer cells. As expected, qRT-PCR data showed MiR-20b-5p mRNA level in the miR-20b-5p-overexpressed tumors was about three-fold to that in control tumors ()). Furthermore, HE, Ki67, and tunnel staining of tumors were performed in indicated groups. Less Ki67 staining signal, which was a readout of tumor cell proliferation, was detected in miR-20b-5p overexpressed tumors, while no difference in tunnel staining, an assay to measure apoptosis ()) was observed, which was consistent with the above in vitro data ().
Figure 3. MiR-20b-5p impedes tumor volume in tumor xenograft mice. 1 × 10⁷ HCT-116 cells stably transfected with miR-20b-5p expression vector or control vector were subcutaneously injected into two flanks of 6 wk female Balb/c nude mice (n = 6), and tumor volume was measured during the course of the experiment. (a) Gross images of tumor size. (b) Weight of tumors excised from 6 mice in each group. (c) The tumor volumes in the HCT116- HBLV-ZsGreen-miR-20b-5p group were lower than those in the HCT116-HBLV-ZsGreen-empty group. (d) Mir-20b-5p mRNA in tumors were measured by qRT-PCR. (e) Representative H&E staining or IHC staining with anti-KI67 antibody and tunnel staining of tumors in indicated groups
MiR-20b-5p significantly affects the cell cycle pathway in colon cancer cells
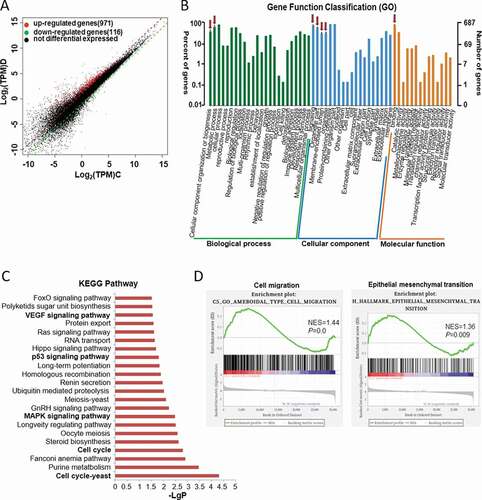
To further explore the mechanism by which miR-20b-5p suppresses the growth of colon cancer cells, we transfected miR-20b-5p mimics into HCT-116 cells, extracted RNA after 48 hours, verified the expression of miR-20b-5p by RT-PCR, and performed microarray analysis. Microarray analysis showed that, with the cutoff of more than 1.5X fold expression change, a total of 971 genes were up-regulated and 116 genes were down-regulated after overexpression of miR-20b-5p ()) . GO analysis showed that, after overexpression of miR-2b-5p, numerous of cell biological functions, cell components, and molecular functions were affected ()). We further performed KEGG analysis and found that overexpression of miR-20b-5p significantly affected the cell cycle, MAPK signaling pathway, p53 signaling pathway, and VEGF signaling pathway ()). GSEA (Gene Set Enrichment Analysis) analysis from our data also indicated that cell migration and epithelial-mesenchymal transition (EMT) correlated genes significantly enriched in the control group ()). In addition, we performed the western blot experiment to check the expression of TGF-β1 and EMT marker (TWIST). As shown in Figure S4, the expression of TGF-β1 and TWIST decreased in miR-20b-5p overexpressed group.
Figure 4. MiR-20b-5p affects multiple signaling pathways related to colon cancer, particularly the cell cycle pathway. HCT-116 cells were transfected with miR-20b-5p-mimics or negative control, and RNA was extracted for microarray analysis. (a) Scatter plot comparing global gene-expression profiles in cells overexpressing miR-20b-5p and control cells. Transcripts with a log2 (fold change) > 1.5 and adjusted P value < 0.01 are shown in red (increased expression, 971 genes) or black (decreased expression, 116 genes). (b) GO analyses of the RNAseq data was performed and data were shown. (c) Histogram showed the KEGG analysis for the signaling pathways that were significantly different between cells overexpressing miR-20b-5p and control cells. (d) GSEA analyses of the microarray data as indicated
All above data highlighted the remarkable role of miR-2b-5p in the pathogenesis and metastasis of colon cancer and consistent with our previous in vitro research results.
CCND1 is a direct target gene of miR-20b-5p
To further identify target gene(s) of miR-20b-5p, we first performed bioinformatic analysis by TargetScan (http://www.targetscan.org/) and miRanda (http://www.microrna.org/microrna/home.do). In addition, we carefully examined the expression level of genes closely related to the cell cycle G1/S transition by RT-PCR. From both analyses, CCND1 was identified as one of the putative targets of miR-20b-5p. To validate this finding, we checked CCND1’s mRNA level and protein level. As shown in ), the mRNA level of CCND1 was significantly decreased in miR-20b-5p-overexpressed group, and this finding was further confirmed by Western blot and immunohistochemistry experiments at the protein levels in both cell lines and xenograft tumors (-d)). In addition, we identified two potential miR-20b-5p binding sites in the 3’UTR of CCND1. To test this hypothesis of the direct inhibitory effect of miR-20b-5p on CCND1, luciferase reporter assays were performed. Indeed, MiR-20b-5p over-expression significantly suppressed the luciferase activity of constructs containing the wild-type 3’-UTR-CCND1 (3’-UTR WT), while this effect was largely abolished when either one of the miR-20b-5p binding sites in the 3’UTR of CCND1 were mutated (3’-UTR MUT1 and 3’-UTR MUT2, -f)). Based on the above data, we concluded that CCND1 is a direct target gene of miR-20b-5p.
Figure 5. CCND1 is a direct target of miR-20b-5p. (a) HCT116 cells were transfected with miR-20b-5p-mimic or mimic-con (final concentration, 50 nM). 48 hours later, mRNA levels of E2F1, CCND1, CDK4 and CDK6 were determined by RT-PCR and normalized to the level of GAPDH. (b) CCND1 protein level was determined by western blot and normalized to the expression level of β-actin. (c) Immunohistochemical results showed that CCND1 expression was significantly reduced in miR-20b-5p overexpressing tumor tissues. (d) Quantitative analysis of CCND1 in xenograft tumors in control and miR-20b-5p overexpressed group. (e) Schematic representation of miR-20b-5p binding to CCND1 3’UTR, and respective mutagenesis performed to disrupt miR-20b-5p binding sites. (f) 293 T cells were cotransfected with CCND1-3’UTR-WT, CCND1-3’UTR-mut1, CCND1-3’UTR-mut2, and CCND1-3’UTR-mut 1 + 2, together with miR-20b-5p-mimic or mimic-con. 48 h later, luciferase activity was determined and normalized to Renilla luciferase activity (g-i) After transfected pCMV-CCND1 into HCT116 cells overexpressing miR-20b-5p, flow cytometric assay and CCK8 assay were performed. Cells were first stained by Ki-67/Hoechst before conducting flow cytometric assay to examine the cell proliferation. Results of flow cytometric analysis (g) and percentages of G0/G1/G2-S-M were shown (h). (i) Time course of CCK-8 assay. Data are presented as the mean ± SEM from three independent experiments performed in triplicate. *P ≤ 0.05, **P ≤ 0.01
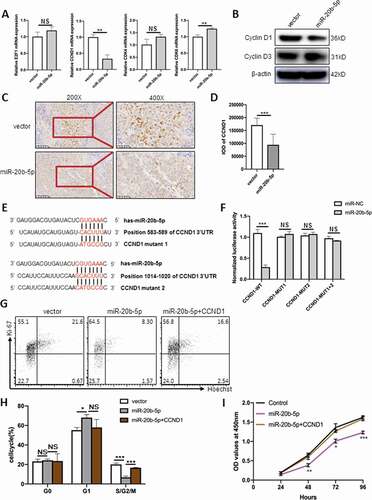
To further testify the critical role of CCND1, we did some related “rescue” experiments. We transfected pCMV-CCND1 into HCT116 cells overexpressing miR-20b-5p before performing flow cytometric assay and CCK8 assay. As shown in -i), overexpression of CCND1 almost completely rescued the suppressed proliferation mediated by miR-20b-5p in HCT116 cells.
MiR-20b-5p regulates the CCND1/CDK4/FOXM1 axis to regulate the cell cycle, migration and invasion of CC cells
CCND1 has been reported to be over-expressed in multiple solid tumors and is recognized as a driver oncogene in solid tumors [Citation18]. In our study, we found that CCND1 had a higher expression in colon cancer through the TCGA dataset analysis ()). In addition, CCND1-expression high patients have shorter survival trend compared to CCND1-expression low group (P= 0.0661, )). Previous studies suggested that CCND1 is associates with the cyclin-dependent kinases (CDKs), such as CDK4 or CDK6, to control the tumor progression through the G1-to-S phase transition. Our data showed that CCND1 retained the ability to interact with downstream protein partners and to activate CDK-kinase activity. In HCT116 cells with high miR-20b-5p expression, CDK4 expression level was decreased, which was consistent with CCND1. However, no expression change of CDK6 was detected ()).
Figure 6. miR-20b-5p is a negative regulator of CCND1/CDK4/FOXM1 signaling pathway. (a) TCGA data shown the expression of CCND1 in different colon cancer stages (http://ualcan.path.uab.edu/index.html). (b) The Kaplan–Meier estimate of survival based on CCND1-expression level in colon cancer in The Cancer Genome Atlas. Colon cancer patients with high CCND1 had worse survival than that in CCND1-low-expression group (Cutoff High 25% vs Cutoff low 75%, P= 0.0661). Data was analyzed using OncoLnc (www.oncolnc.org) [Citation19]. (c) Protein Expression of CCND1, CDK4, CDK6, Rb1, p-Rb1(Ser807/811) and β-actin were detected by western blot in miR-20b-5p ectopic expressed cells or control group. (d) Empty vector or pCMV-HA-CCND1 (CDS+3'-UTR) were transfected into stably expressed miR-20b-5p/NC-HCT116 cells, respectively. The expression of CCND1, HA-CCND1,CDK4, CDK6, FOXM1, p-FOXM1 and β-actin were detected by western blot. (e) HCT116 cells were co-transfected with siRNA-CCND1/siRNA-con and miR-20b inhibitor/inhibitor control, respectively. Samples were collected for Western blot analysis. Representative western blot showed the levels of CCND1, CDK4, CDK6, FOXM1, p-FOXM1 and β-actin
![Figure 6. miR-20b-5p is a negative regulator of CCND1/CDK4/FOXM1 signaling pathway. (a) TCGA data shown the expression of CCND1 in different colon cancer stages (http://ualcan.path.uab.edu/index.html). (b) The Kaplan–Meier estimate of survival based on CCND1-expression level in colon cancer in The Cancer Genome Atlas. Colon cancer patients with high CCND1 had worse survival than that in CCND1-low-expression group (Cutoff High 25% vs Cutoff low 75%, P= 0.0661). Data was analyzed using OncoLnc (www.oncolnc.org) [Citation19]. (c) Protein Expression of CCND1, CDK4, CDK6, Rb1, p-Rb1(Ser807/811) and β-actin were detected by western blot in miR-20b-5p ectopic expressed cells or control group. (d) Empty vector or pCMV-HA-CCND1 (CDS+3'-UTR) were transfected into stably expressed miR-20b-5p/NC-HCT116 cells, respectively. The expression of CCND1, HA-CCND1,CDK4, CDK6, FOXM1, p-FOXM1 and β-actin were detected by western blot. (e) HCT116 cells were co-transfected with siRNA-CCND1/siRNA-con and miR-20b inhibitor/inhibitor control, respectively. Samples were collected for Western blot analysis. Representative western blot showed the levels of CCND1, CDK4, CDK6, FOXM1, p-FOXM1 and β-actin](/cms/asset/c60f4287-d5c3-4532-8c9b-f4cc87cf944f/kccy_a_1829824_f0006_c.jpg)
CDK4/6 form an active complex with cyclinDs, which promotes G1-S transition of tumor cells by phosphorylating key substrates; however, the level of best-characterized substrate Retinoblastoma tumor-suppressor protein RB1 and phosphorylation of RB1 has no difference in both group ()). Previous work from Piotr Sicinski’s group identified the Forkhead Box M1 (FOXM1) transcription factor as a common critical phosphorylation target [Citation20]. FOXM1 is critically required for the cell cycle transition from G1 to S phase. Phosphorylation of FOXM1 maintains the expression of G1/S phase genes to protect cancer cells from senescence.
To further explore the molecular mechanism, we transfected the pCMV-CCND1 or empty vector into either wild-type HCT116 cells or HCT116 stably overexpressed miR-20b-5p, and found that ectopic expression of CCND1 partially restored the expression of CCND1, followed with the same tendency of FOXM1 phosphorylation, but has no effect on total FOXM1 protein level ()). Inversely, in HCT116 cells which were treated with miR-20b-5p inhibitor (antisense RNA) in conjunction with knockdown of CCND1, CDK4, and FOXM1 phosphorylation levels were positively correlated with the changes of CCND1. Furthermore, we examined the level of CCND1, FOXM1, and p-FOXM1 in tumors, and the indicated protein levels in vivo were consistent with data from the in vitro experiments (Figure S5). Therefore, we propose that miR-20b-5p regulates the CCND1/CDK4/FOXM1 axis, which leads to cell cycle arrest, inhibition of cell migration and invasion, and eventually suppresses tumor progression.
Discussion
In the past decades, multiple lines of evidence suggested that the potential role of miRNAs in different tumor tissues. miRNAs have been proposed to be either oncogenic miRNAs by inhibiting the expression of tumor-suppressor genes or as tumor-suppressive miRNAs by inhibiting oncogene expression. In our study, we uncovered that miR-20b-5p played an important role in regulating the cell cycle, migration, invasion of CC cells in vitro, and inhibited the tumor growth in vivo. To our knowledge, this is the first study to illustrate a defined role of miR-20b-5p as a tumor-suppressor miRNA in colon cancer.
Together with miR-17-92 and miR-106b-25 clusters, miRNA-20b belongs to a large family called the miR-17 family [Citation17,Citation21]. It is well known that the miR-17 family is involved in the pathogenesis of various solid tumors, such as prostate cancer and breast cancer [Citation22–24]. However, the role of miR-20b-5p in the pathogenesis of cancers remains controversial. On one hand, several studies demonstrated that miR-20b-5p played important roles in tumorigenesis of esophageal cancer via regulation of PTEN expression [Citation25], and functioned as an oncogene in breast cancer via targeting EGR1 [Citation26]. On the other hand, MiR-20b-5p was shown to have a tumor-suppressive role in gastric cancer through regulation of the PI3K/AKT/mTOR signaling pathway [Citation27]. Moreover, miR-20b-5p suppressed TGF-β1-induced migration and invasion of prostate cancer by up-regulating E-cadherin and down-regulating vimentin, leading to TGF-β1-induced inhibition of epithelial-to-mesenchymal transition (EMT) [Citation28].
There are limited data about MiR-20b-5p in colon cancer. The study performed by Xie Jianguo et al. indicated that miR-20b-5p reduced 5-FU resistance to induce apoptosis in vitro by suppressing ADAM9/EGFR in CC cells [Citation29]. Although very few data showed that miR-20b-5p is under-expressed in colon cancer [Citation14], the expression level of miR-20b-5p is negatively correlated with long progression-free survival (PFS) and overall survival (OS) [Citation16] without a clear underlying mechanism. Our study demonstrated that overexpression of miR-20b-5p inhibited cell proliferation, cell migration, and tumor growth in HCT-116 tumor xenograft experiments. Our in vitro and in vivo anti-tumor data supported the hypothesis in which miR-20b-5p may act as the tumor suppressor in CC.
Microarray results show that overexpression of miR-20b-5p can affect several signaling pathways, including some pathways that are very important for the development of colon cancer, such as the MAPK signaling pathway, p53-signaling pathway, and VEGF signaling pathway. Among them, the most obvious and pivotal pathway is the cell cycle signaling pathway. Our previous microarray analysis predicted that miR-20b-5p may regulate the cell cycle in bladder cancer without any direct experimental evidence [Citation30]. To further investigate this hypothesis, we conducted some in vitro and in vivo experiments and identified CCND1, a key player in cell cycle progression, as a target of miR-20b-5p in colon cancer. To our knowledge, we believe this is the first report to demonstrate that CCND1 is a target gene of miR-20b-5p in colon cancer.
CCND1, an important regulator of the G0/G1 transition in the cell cycle, is often abnormally expressed in cancer and is a biomarker for cancer phenotype and disease progression [Citation31]. CCND1 is a well-established human oncogene that is commonly overexpressed in tumor tissues, especially in lung cancer, melanoma, and oral squamous cell carcinoma [Citation32]. In addition, CCND1 regulates many key processes involved in cancer development and maintenance, such as the DNA-damage response [Citation33] and migration [Citation34–36]. From the TCGA dataset, we found that CCND1 expression level was elevated in colon cancer without a significant correlation with tumor stages. Although it is not statistically significant, TCGA data showed the trend between the higher CCND1 level and the shorter survival time, implying the importance of CCND1 in the development of colon cancer. The most known function of CCND1 is to activate CDK4 and CDK6 and promote cell proliferation [Citation37]. The CCND1/CDK4/6 complex can phosphorylate some transcription factors that activate or inhibit the expression of genes needed for cell cycle progression. Besides this, the migration of epithelial cells and macrophages is reduced under the circumstances of absence of CCND1 [Citation34,Citation38]. In our study, we showed that miR-20b-5p decreased the expression of CCND1, and suppressed the activation of CDK4, but not CDK6. Although our work focused on miR-20b-5p, other miRNAs have been predicted to regulate CCND1, such as miR-15a and miR-16, whose expression were shown to be inversely correlated with CCND1 expression in prostate and lung cancers [Citation39,Citation40]. Further work is needed to investigate the role of other miRNAs in regulating CCND1.
Forkhead Box M1 (FOXM1) is critically required for the cell cycle transition from G1 to S phase. Once stabilized by phosphorylation, FOXM1 maintains G1/S phase expression, suppresses the levels of reactive oxygen species (ROS), protects cancer cells from senescence, and finally promotes tumor progression [Citation41]. FOXM1 plays a critical role in the process of tumorigenesis in several cancer types [Citation42,Citation43] and the metastasis of prostate cancer [Citation44], breast cancer [Citation45], and colon cancer through the reversal of epithelial-to-mesenchymal transformation [Citation46] or maintenance of mitochondrial function [Citation47]. The previous investigation showed that, in melanoma cells, FOXM1 was phosphorylated by CCND1-CDK4/6 complexes [Citation20]. In line with that report, our study demonstrated that CCND1/CDK4 phosphorylated FOXM1 in colon cancer. However, further research is needed to explore the specific mechanism.
In conclusion, this report demonstrated that miR-20b-5p acted as a tumor-suppressor miRNA in the pathogenesis of CC via negatively regulating the CCND1/CDK4/FOXM1 axis. Our data also indicated the miR-20b-5p/CCND1 axis as a potential therapeutic target in CC.
Authors’ contributions
Hui Yang and Jian Lin designed and performed the experiments, and Hui Yang was a major contributor in writing the manuscript, data collection, and data analysis. Jinling Jiang, Jun Ji, and Chao Wang provided assistance in experiment material. Jun Zhang provided help in designing the study. All authors read and approved the final manuscript.
Supplemental Material
Download MS Word (630.5 KB)Disclosure statement
The authors declare that they have no competing interests.
Supplementary material
Supplemental data for this article can be accessed here.
Additional information
Funding
References
- Dekker E, Tanis PJ, Vleugels JLA, et al. Colorectal cancer. Lancet. 2019;394(10207):1467–1480.
- Ferlay J, Colombet M, Soerjomataram I, et al. Estimating the global cancer incidence and mortality in 2018: GLOBOCAN sources and methods. Int J Cancer. 2019;144(8):1941–1953.
- Siegel RL, Miller KD, Jemal A. Cancer statistics, 2019. CA Cancer J Clin. 2019;69:7–34.
- Oliveto S, Mancino M, Manfrini N, et al. Role of microRNAs in translation regulation and cancer. World J Biol Chem. 2017;8(1):45–56.
- Catalanotto C, Cogoni C, Zardo G. MicroRNA in control of gene expression: an overview of nuclear functions. Int J Mol Sci. 2016;17(10):1712.
- Macfarlane LA, Murphy PR. MicroRNA: biogenesis, function and role in cancer. Curr Genomics. 2010;11(7):537–561.
- Grillari J, Hackl M, Grillari-Voglauer R. miR-17-92 cluster: ups and downs in cancer and aging. Biogerontology. 2010;11(4):501–506.
- Yu Z, Wang C, Wang M, et al. A cyclin D1/microRNA 17/20 regulatory feedback loop in control of breast cancer cell proliferation. J Cell Biol. 2008;182(3):509–517.
- Chang CC, Yang YJ, Li YJ, et al. Corrigendum to “MicroRNA-17/20a functions to inhibit cell migration and can be used a prognostic marker in oral squamous cell carcinoma” [Oral Oncol. 49(9) (2013) 923-931]. Oral Oncol. 2017;72:202–203.
- Hong S, Yu S, Li J, et al. MiR-20b displays tumor-suppressor functions in papillary thyroid carcinoma by regulating the MAPK/ERK signaling pathway. Thyroid. 2016;26(12):1733–1743.
- Xu H, Li W, Luo S, et al. Adipose derived stem cells promote tumor metastasis in breast Cancer cells by stem cell factor inhibition of miR20b. Cell Signal. 2019;62:109350.
- Katada T, Ishiguro H, Kuwabara Y, et al. microRNA expression profile in undifferentiated gastric cancer. Int J Oncol. 2009;34(2):537–542.
- Li E, Ji P, Ouyang N, et al. Differential expression of miRNAs in colon cancer between African and Caucasian Americans: implications for cancer racial health disparities. Int J Oncol. 2014;45(2):587–594.
- Sarver AL, French AJ, Borralho PM, et al. Human colon cancer profiles show differential microRNA expression depending on mismatch repair status and are characteristic of undifferentiated proliferative states. BMC Cancer. 2009;9:401.
- Yang Z, Wu L, Wang A, et al. dbDEMC 2.0: updated database of differentially expressed miRNAs in human cancers. Nucleic Acids Res. 2017;45(D1):D812–D818.
- Ulivi P, Canale M, Passardi A, et al. Circulating plasma levels of miR-20b, miR-29b and miR-155 as predictors of bevacizumab efficacy in patients with metastatic colorectal cancer. Int J Mol Sci. 2018;19:1.
- Li M, Zhou Y, Xia T, et al. Circulating microRNAs from the miR-106a-363 cluster on chromosome X as novel diagnostic biomarkers for breast cancer. Breast Cancer Res Treat. 2018;170(2):257–270.
- Noel EE, Yeste-Velasco M, Mao X, et al. The association of CCND1 overexpression and cisplatin resistance in testicular germ cell tumors and other cancers. Am J Pathol. 2010;176(6):2607–2615.
- Anaya J. OncoLnc: linking TCGA survival data to mRNAs, miRNAs, and lncRNAs. PeerJ Comput Sci. 2016;2:e67.
- Anders L, Ke N, Hydbring P, et al. A Systematic screen for CDK4/6 substrates links FOXM1 phosphorylation to senescence suppression in cancer cells. Cancer Cell. 2011;20(5):620–634.
- Tan W, Li Y, Lim SG, et al. miR-106b-25/miR-17-92 clusters: polycistrons with oncogenic roles in hepatocellular carcinoma. World J Gastroenterol. 2014;20(20):5962–5972.
- Dhar S, Kumar A, Rimando AM, et al. Resveratrol and pterostilbene epigenetically restore PTEN expression by targeting oncomiRs of the miR-17 family in prostate cancer. Oncotarget. 2015;6(29):27214–27226.
- de Mayo T, Ziegler A, Morales S, et al. Identification of a rare germline heterozygous deletion involving the polycistronic miR-17-92 cluster in two first-degree relatives from a BRCA 1/2 negative chilean family with familial breast cancer: possible functional implications. Int J Mol Sci. 2018;19(1):321.
- Moi L, Braaten T, Al-Shibli K, et al. Differential expression of the miR-17-92 cluster and miR-17 family in breast cancer according to tumor type; results from the Norwegian Women and Cancer (NOWAC) study. J Transl Med. 2019;17(1):334.
- Wang B, Yang J, Xiao. B. MicroRNA-20b (miR-20b) promotes the proliferation, migration, invasion, and tumorigenicity in esophageal cancer cells via the regulation of phosphatase and tensin homologue expression. PLoS One. 2016;11(10):e0164105.
- Li D, Ilnytskyy Y, Kovalchuk A, et al. Crucial role for early growth response-1 in the transcriptional regulation of miR-20b in breast cancer. Oncotarget. 2013;4(9):1373–1387.
- Streleckiene G, Inciuraite R, Juzenas S, et al. miR-20b and miR-451a are involved in gastric carcinogenesis through the PI3K/AKT/mTOR signaling pathway: data from gastric cancer patients, cell lines and ins-gas mouse model. Int J Mol Sci. 2020;21(3):877.
- Qi JC, Yang Z, Zhang YP, et al. miR-20b-5p, TGFBR2, and E2F1 form a regulatory loop to participate in epithelial to mesenchymal transition in prostate cancer. Front Oncol. 2019;9:1535.
- Fu Q, Cheng J, Zhang J, et al. miR-20b reduces 5-FU resistance by suppressing the ADAM9/EGFR signaling pathway in colon cancer. Oncol Rep. 2017;37(1):123–130.
- Park SL, Cho TM, Won SY, et al. MicroRNA-20b inhibits the proliferation, migration and invasion of bladder cancer EJ cells via the targeting of cell cycle regulation and Sp-1-mediated MMP-2 expression. Oncol Rep. 2015;34(3):1605–1612.
- Tchakarska G, Sola B. The double dealing of cyclin D1. Cell Cycle. 2020;19(2):163–178.
- Santarius T, Shipley J, Brewer D, et al. A census of amplified and overexpressed human cancer genes. Nat Rev Cancer. 2010;10(1):59–64.
- Jirawatnotai S, Hu Y, Michowski W, et al. A function for cyclin D1 in DNA repair uncovered by protein interactome analyses in human cancers. Nature. 2011;474(7350):230–234.
- Neumeister P, Pixley FJ, Xiong Y, et al. Cyclin D1 governs adhesion and motility of macrophages. Mol Biol Cell. 2003;14(5):2005–2015.
- Li Z, Wang C, Jiao X, et al. Alternate cyclin D1 mRNA splicing modulates p27KIP1 binding and cell migration. J Biol Chem. 2008;283(11):7007–7015.
- Fuste NP, Fernandez-Hernandez R, Cemeli T, et al. Cytoplasmic cyclin D1 regulates cell invasion and metastasis through the phosphorylation of paxillin. Nat Commun. 2016;7:11581.
- Musgrove EA, Caldon CE, Barraclough J, et al. Cyclin D as a therapeutic target in cancer. Nat Rev Cancer. 2011;11(8):558–572.
- Li Z, Wang C, Jiao X, et al. Cyclin D1 regulates cellular migration through the inhibition of thrombospondin 1 and ROCK signaling. Mol Cell Biol. 2006;26(11):4240–4256.
- Bandi N, Zbinden S, Gugger M, et al. miR-15a and miR-16 are implicated in cell cycle regulation in a Rb-dependent manner and are frequently deleted or down-regulated in non-small cell lung cancer. Cancer Res. 2009;69(13):5553–5559.
- Bonci D, Coppola V, Musumeci M, et al. The miR-15a-miR-16-1 cluster controls prostate cancer by targeting multiple oncogenic activities. Nat Med. 2008;14(11):1271–1277.
- Wang IC, Chen YJ, Hughes DE, et al. FoxM1 regulates transcription of JNK1 to promote the G1/S transition and tumor cell invasiveness. J Biol Chem. 2008;283(30):20770–20778.
- Kalinichenko VV, Major ML, Wang X, et al. Foxm1b transcription factor is essential for development of hepatocellular carcinomas and is negatively regulated by the p19ARF tumor suppressor. Genes Dev. 2004;18(7):830–850.
- Liu M, Dai B, Kang SH, et al. FoxM1B is overexpressed in human glioblastomas and critically regulates the tumorigenicity of glioma cells. Cancer Res. 2006;66(7):3593–3602.
- Lin SC, Kao CY, Lee HJ, et al. Dysregulation of miRNAs-COUP-TFII-FOXM1-CENP Faxis contributes to the metastasis of prostate cancer. Nat Commun. 2016;7:11418.
- Xue J, Lin X, Chiu WT, et al. Sustained activation of SMAD3/SMAD4 by FOXM1 promotes TGF-beta-dependent cancer metastasis. J Clin Invest. 2014;124(2):564–579.
- Yang K, Jiang L, Hu Y, et al. Short hairpin RNA- mediated gene knockdown of FOXM1 inhibits the proliferation and metastasis of human colon cancer cells through reversal of epithelial-to-mesenchymal transformation. J Exp Clin Cancer Res. 2015;34:40.
- Song IS, Jeong YJ, Jeong SH, et al. FOXM1-induced PRX3 regulates stemness and survival of colon cancer cells via maintenance of mitochondrial function. Gastroenterology. 2015;149(4):1006–1016 e1009.