
ABSTRACT
Crocin is the main monomer of saffron, which is a momentous component of traditional Chinese medicine Lang Qing A Ta. Here, we tried to probe into the role of crocin in liver fibrosis. Hematoxylin-eosin staining and Sirius Red staining were used to observe the pathological changes of liver tissues. After hepatic stellate cells (HSCs) were isolated from liver tissues, lnc-LFAR1, MTF-1, GDNF, and α-SMA expressions were detected by qRT-PCR and western blot. Immunohistochemistry and immunofluorescence were used to detect α-SMA expression. Chromatin immunoprecipitation was used to analyze the binding of MTF-1 to the GDNF promoter. Moreover, the dual-luciferase reporter gene, RNA pull-down, and RNA immunoprecipitation were used to clarify the interaction between MTF-1 and GDNF, lnc-LFAR1 and MTF-1. The degree of liver fibrosis was more severe in the mice from the liver fibrosis model, while the liver fibrosis was alleviated by the injection of crocin. lnc-LFAR1, GDNF, and α-SMA were up-regulated, and MTF-1 was down-regulated in liver fibrosis tissues and cells, while these trends were reversed after the injection of crocin. Besides, lnc-LFAR1 negatively regulated MTF-1 expression, and positively regulated GDNF and α-SMA expressions, and MTF-1 was enriched in the promoter region of GDNF. Furthermore, the cellular direct interactions between MTF-1 and GDNF, lnc-LFAR1 and MTF-1 were verified. In vivo experiments confirmed the relief of crocin on liver fibrosis. Our research expounded that crocin restrained the activation of HSCs through the lnc-LFAR1/MTF-1/GDNF axis, thereby ameliorating liver fibrosis.
Introduction
Liver fibrosis is one of the common diseases worldwide and is mainly caused by chronic liver injury [Citation1]. Liver fibrosis may further develop into liver cirrhosis and even hepatocellular carcinoma, which seriously threatens the physical and mental health of humans [Citation2,Citation3]. Although clinical progress has been made in the treatment of liver fibrosis, there are still various shortcomings including poor prognosis and surgical complications [Citation4]. Therefore, there is an urgent need to probe into new strategies for the treatment of liver fibrosis. Lang Qing A Ta prescription is a well-known liver medicine prescription for Tibetan medicine and this prescription is mainly composed of artificial bezoar, saffron, et al. Crocin is isolated from saffron, which is a momentous component of Lang Qing A Ta, and crocin has a certain improvement in liver fibrosis [Citation5]. However, the specific mechanism of crocin against liver fibrosis has not yet been elucidated.
Growing evidence expound that the abnormal activation of HSCs has been widely regarded as one of the momentous factors leading to liver fibrosis [Citation6,Citation7]. Liu et al. found that restraining the activation of HSCs effectively alleviates liver fibrosis induced by CCl4 [Citation8]. Another study has confirmed that blocking the activation of HSCs is beneficial in reducing liver fibrosis and inflammation [Citation9]. Therefore, probing into the strategies that restrain the abnormal activation of HSCs has the potential to alleviate liver fibrosis.
Glial cell-derived neurotrophic factor (GDNF) is a glycosylated disulfide-linked homodimer protein and a member of the transforming growth factor-β (TGF-β) [Citation10]. Various studies have expounded that the abnormal expression of GDNF is bound up with various human diseases [Citation11,Citation12]. In recent years, the regulatory role of GDNF in liver diseases has caused widespread concern. Studies have expounded that the mRNA and protein levels of GDNF are raised in the patients with liver fibrosis, and the interference with GDNF restrains the development of liver fibrosis by restraining the activation of HSCs [Citation13].
Long noncoding RNAs (lncRNAs) are non-coding RNAs with a length greater than 200 nucleotides that cannot encode proteins. Yu F. et al expounded that lncRNA MEG3 was lessened in the liver fibrosis model, and the overexpression of lncRNA MEG3 alleviates liver fibrosis by restraining the activation of HSCs [Citation14]. Another study has expounded that NEAT1 is raised in CCl4-induced liver fibrosis in mice and the knockdown of NEAT1 restrains the development of liver fibrosis [Citation15]. Increasing evidence corroborates that lncRNAs regulate the expressions of proteins by binding to them to regulate various human diseases [Citation16]. Metallic transcription factor-1 (MTF-1) has been corroborated that boosts fibrosis [Citation17], and lnc-LFAR1 (also known as liver fibrosis-associated lncRNA 1 has been corroborated that boosts liver fibrosis [Citation18]. Moreover, it is worth noting that the online software prediction (RPISeq) showed that there were binding sites between lnc-LFAR1 and MTF-1, prompting that lnc-LFAR1 might play momentous roles in liver fibrosis by binding to MTF-1.
In summary, our results expounded that crocin ameliorated liver fibrosis in mice, and in-depth research corroborated that crocin mainly enhanced the transcriptional repression of GDNF by regulating the combination of lnc-LFAR1 and MTF-1, thereby achieving the effect of ameliorating liver fibrosis.
Materials and methods
Establishment of a mouse model of liver fibrosis
This study was approved by the Medical Ethics Committee of Jinling Hospital. Sixty male C57BL/6 mice (aged 6–8 weeks) were randomly divided into these groups: Sham group (n = 15), Hepatic fibrosis group (liver fibrosis model group, n = 15), Corcin group (n = 15), and Silymarin group (n = 15). Among them, the mice in the HF group were injected intraperitoneally with 5 μL/g body weight 10% CCl4 (diluted with olive oil) twice a week for 4 weeks, and once a week from the 5 th week to the 11 th week. The mice in the Corcin group were injected intraperitoneally with 5 μL/g body weight 10% CCl4 (diluted with olive oil) twice a week for 4 weeks, and once a week from the 5 th week to the 11 th week, and from the 5 th week to the 11 th week, simultaneous intragastric administration (25 mg/kg crocin) was administered 6 times a week. The mice in the Sham group were injected intraperitoneally with 5 μL/g body weight of olive oil. The mice in the Silymarin group received the oral administration of 100 mg/kg silymarin twice a week for 4 weeks, and once a week from the 5 th week to the 11 th week. After 11 weeks, all mice were injected intraperitoneally with 0.3 g/100 mL pentobarbital sodium and sacrificed. Serum samples were then gathered and liver HSCs were isolated for subsequent experiments.
Hematoxylin-eosin staining
Hematoxylin-eosin (HE) staining was applied to observe the pathological changes of liver tissues in mice. Briefly, liver tissues were fixed with 4% formaldehyde and embedded in paraffin. Tissue sections with a thickness of 5 μm were then prepared and HE staining was performed in view of standard procedures. The observations were made under the microscope and the images were saved.
Sirius red staining
Sirius Red staining was applied to assess liver fibrosis. Mouse liver tissue sections were prepared and cut into 5 μm, and then the sections were incubated with an aqueous solution of saturated picric acid containing 0.1% Fast Green FCF and 0.1% Direct Red for nearly 2 h at room temperature.
Immunohistochemistry assay
Immunohistochemical assays were conducted using the previously described method with minor modifications [Citation19]. The liver tissues were dewaxed and hydrated. Sections were then immersed in hydrogen peroxide and Bovine Serum Albumin (BSA) to block endogenous and nonspecific binding sites. Next, the sections were incubated with anti-α-SMA (ab5694, 1:100, Abcam) at 4°C overnight. The next day, the sections were incubated with the secondary antibody (ab205718, 1:2000, Abcam) for nearly 1 h at room temperature, then counterstained them with HE and observed under a microscope, and the results were analyzed using Image-Pro Plus software.
Detection of ALT, AST, GGT, and ALP enzyme activity
ALT, AST, GGT, and ALP activity detection kits were purchased from Abcam company. Serum samples from differently treated mice were gathered and then we tested the contents of ALT, AST, GGT, and ALP in mouse serum samples in view of the reagent manufacturer’s instructions.
Detection of T-BIL and D-BIL concentrations
Total bilirubin (T-BIL) and direct bilirubin (D-BIL) are routine indicators for liver function testing [Citation20]. In view of the reagent manufacturer’s instructions, the ELISA Quantitative Analysis Kit was applied to test the concentrations of T-BIL and D-BIL in mouse serum samples.
Quantitative reverse transcriptase PCR (qRT-PCR)
The TRIzol kit was applied to extract RNA from liver tissues or LX2 cells. Subsequently, the Primer Script RT kit was applied to reverse-transcribe RNA into cDNA. SYBR Green PCR Master Mix (Takara) and ABI Prism 7500 Sequence Detection System (BioRad, USA) were applied for real-time PCR. GAPDH was applied as an internal reference. The relative expressions of lnc-LFAR1, MTF-1, GDNF, and α-SMA were calculated using the 2−ΔΔCt method. When the difference was performed between the two groups, a two-tailed Student’s t-test was applied. When more than 2 groups were analyzed, one-way ANOVA followed by Bonferroni’s post-hoc test was applied. The primer sequences used are shown in .
Table 1. The sequences of all primers used in qRT-PCR
Western blot analysis
Liver tissues and LX2 cells were gathered and lysed with RIPA buffer with the addition of protease inhibitors to extract total protein. The BCA method was applied to quantify the total protein concentration and then placed in boiling water for 5–10 min. The denatured protein sample was separated by 10% SDS-PAGE and transferred into a PVDF membrane, and incubated the membrane with 5% skim milk for nearly 1 h at room temperature. The membrane was incubated with the primary antibodies, including anti-α-SMA (ab5694, 0.5–2 µg/ml, Abcam), anti-GDNF (ab176564, 1:1000, Abcam), anti-MTF-1 (NBP1-86380, 0.04–0.4 ug/ml, Novus Biologicals) and GAPDH (ab8245, 1:1000, Abcam) at 4°C overnight. The next day, the membrane was washed 2–3 times with Tris-buffered saline with the addition of Tween 20. Next, the membrane was incubated with the secondary antibody (ab205719, 1:2000, Abcam) for nearly 1 h at room temperature. The protein bands were tested by a chemiluminescence detection kit.
Isolation and culture of cells
The isolation of HSCs mainly referred to the previously described method [Citation21]. Mice livers were perfused with HBSS solution (excluding calcium and magnesium) and digested with collagenase digestion. The digested cell suspension was filtered (70 μm cell filter), and centrifuged at 4°C, 50 g for 5 min to eliminate hepatocytes. Subsequently, HSCs were enriched by density gradient centrifugation.
The isolated primary HSCs were placed in the Dulbecco’s modified Eagle’s medium (DMEM) with the addition of 10% fetal bovine serum (FBS) and cultured at 37°C. LX-2 cells were placed in the DMEM medium with the addition of 10% FBS and antibiotic-antifungal mixed solution and cultured at 37°C.
Cell transfection
The lentivirus containing LFAR1 (pcDNA-LFAR1), LFAR1 shRNA (sh-LFAR1), MTF-1 (pcDNA-MTF-1) and MTF-1 shRNA (sh-MTF-1) were from the pharmaceutical technology company (GenePharma, Shanghai, China). Primary HSCs with different treatments (1×10⁶ cells/well) and HSCs LX-2 (1×10⁶ cells/well) were seeded into 6-well plates, and the cells were cultured at 37 °C with 5% CO2. After growing to about 80% confluence, all the above lentivirus were applied to transfect the cells on the basis of the protocol of manufacture. After 12 h of infection, a normal medium was added to continue culturing. The sequences of shRNA were as follows: sh-LFAR1: CCTCCAAGTGCTGGGATTAAA; sh-MTF-1: GGTGAAGAGGGCTTCTTAATA.
Similarly, the lentivirus containingpcDNA-LFAR1, pcDNA-MTF-1, pcDNA-MTF-1 or/and pcDNA-LFAR1 were applied to transfect the LX-2 cells regarding the above methods.
Dual-luciferase reporter gene assay
293 T cells (2 × 10⁴ cells/well) were seeded in a 24-well plate for culture. The next day, we constructed a luciferase reporter vector containing GDNF 3ʹUTR, and the GDNF 3ʹUTR with MTF-1 binding site mutation was cloned into the same reporter vector as the control. The recombinant vector was then co-transfected into 293 T cells. After 48 h of transfection, luciferase activity was tested using a dual-luciferase reporter detection system in view of the previously described method [Citation22]. The sequences of GDNF-WT 3ʹUTR and GDNF-Mut 3ʹUTR were as follows: GNDF-WT: GTTTGCACTAGG and GNDF-Mut: TGGGTACAGCTT.
Chromatin immunoprecipitation (ChIP) assay
ChIP assays were conducted using the EZ-ChIPTM Chromatin Immunoprecipitation Kit (Millipore) in view of the reagent manufacturer’s procedures. In brief, chromatin fragments were immunoprecipitated with specific antibodies, including anti-MTF-1(NBP1-86380, 0.04–0.4 ug/ml, Novus Biologicals), anti-H3 (ab1791, 2 µg for 106 cells, Abcam) or negative control anti-IgG (ab133470, 1:1000, Abcam). The DNA released from the protein-DNA complex was gathered by beads and purified for qRT-PCR analysis.
RNA pull-down
The Pierce™ Magnetic RNA Protein Pulldown Kit was applied for RNA pull-down experiments. In view of the reagent manufacturer’s instructions, after obtaining a large number of LX2 cells transfected with biotinylated lnc-LFAR1 (ThermoFisher Scientific), LX2 cells were lysed with a lysis buffer at room temperature and incubated with biotinylated probes. Next, the cell lysate was mixed with streptavidin agarose beads overnight. The RNA-protein mixture was boiled in an SDS buffer for nearly 10 min, and then the protein level of MTF-1 in the lnc-LFAR1 pull-down complex was tested by western blot.
RNA immunoprecipitation
In view of the reagent manufacturer’s procedures, RIP experiments were conducted using the RNA binding protein immunoprecipitation kit (Millipore). Total MTF-1 binding RNA was immunoprecipitated and extracted using the MTF-1 antibody (NBP1-86380, 0.04–0.4 ug/ml, Novus Biologicals). The expression of lnc-LFAR1 in the MTF-1 pull-down complexes was tested by qRT-PCR.
Immunofluorescence technique
HSCs LX2 were fixed with 4% paraformaldehyde and blocked with 10% FBS. Cells were then incubated with primary antibodies against α-SMA (ab124964, 1:300, Abcam) at 4°C overnight. The next day, the cells were washed with PBS and incubated with the secondary antibody (ab205718, 1:2000, Abcam) for nearly 1 h at room temperature. Images were obtained through a confocal microscope.
In vivo mouse models
This study was approved by the Medical Ethics Committee of Jinling Hospital. Sixty male C57BL/6 mice (aged 6–8 weeks) were applied in experimental studies in vivo. A mouse model of liver fibrosis was constructed and the drug crocin was administered intragastrically in view of the above described methods. Ad-LFAR1 (3 × 10¹⁰), Ad-LFAR1 + Ad-MTF-1 (3 × 10¹⁰) were injected into mice via tail vein, respectively. The experiments were divided into these groups: HF group (model group, n = 15), HF + Drug group (n = 15), HF + Drug + Ad-LFAR1 group (n = 15), and HF + Drug + Ad-LFAR1 + Ad-MTF-1 group (n = 15). After 7 d, the mice were euthanized and mouse serum samples and liver tissues were gathered for subsequent testing.
Statistical analyses
SPSS 17.0 was applied for data analysis in this experiment. All data were expressed as mean ± standard deviation. When the analysis was performed between the two groups, a two-tailed Student’s t-test was applied. When more than two groups were analyzed, one-way ANOVA followed by Bonferroni’s post-hoc test was applied. A P value < 0.05 was considered statistically significant.
Results
Establishment of a mouse model of liver fibrosis and the expression changes of lnc-LFAR1, MTF-1, and GDNF
To probe into the expression changes of lnc-LFAR1, MTF-1, and GDNF in liver fibrosis, we established a mouse model of liver fibrosis and administered crocin intragastrically. As shown in , compared with the Sham group, liver fibrosis occurred more severely in the HF group, while this degree of liver fibrosis was reduced after the addition of crocin, and the results of immunohistochemical detection expounded that compared with the Sham group, α-SMA was raised in the HF group, while this raise was reversed after the addition of crocin (). ALT, AST, T-BIL, D-BIL, GGT, and ALP are all conventional indicators of liver function [Citation23,Citation24].
Figure 1. Establishment of a mouse model of liver fibrosis and the detection of lnc-LFAR1, MTF-1, and GDNF expressions. (a) Hematoxylin-eosin (HE) and Sirius Red staining were applied to observe the severity of liver fibrosis in mice (scale: 6 μm), n = 5; Immunohistochemistry was applied to test the expression of α-SMA in mouse liver tissues (scale: 6 μm), n = 5. (b-g) The kits were applied to test the contents of ALT, AST, T-BIL, D-BIL, GGT, and ALP in mouse serum samples, n = 15. (h) qRT-PCR was conducted to test the expressions of lnc-LFAR1, GDNF, MTF-1, and α-SMA in hepatic stellate cells (HSCs) isolated from mouse liver tissues, n = 5. (i) Western blot was applied to quantify the protein levels of α-SMA, GDNF, and MTF-1 in HSCs isolated from mouse liver tissues, n = 5. Experiments were performed in triplicate. Silymarin treatment group was used as a positive control. ***P < 0.001 vs. Sham group. ##P < 0.01, ###P < 0.001 vs. Hepatic fibrosis group
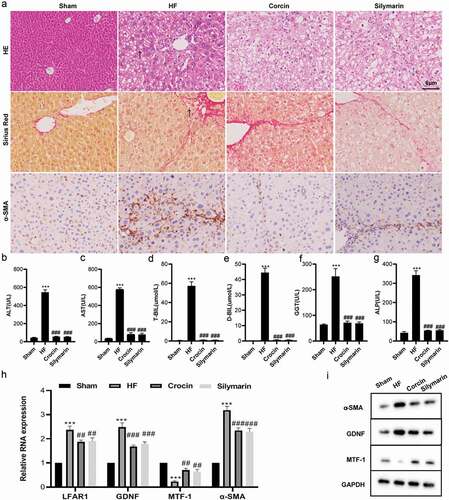
As shown in –g, compared with the Sham group, the contents of ALT, AST, T-BIL, D-BIL, GGT, and ALP were raised in the HF group, while this raise was reversed after the addition of crocin, prompting that crocin might have an improvement effect on liver fibrosis. Besides, the results of qRT-PCR and western blot expounded that compared with the Sham group, lnc-LFAR1, GDNF, and α-SMA (one of the indicators of liver fibrosis) expressions were raised in the HF group, and MTF-1 was lessened, while these effects were reversed after the addition of crocin ().
Effects of lnc-LFAR1 intervention on the expressions of MTF-1, GDNF, and α-SMA
Subsequently, pcDNA-LFAR1 or sh-MTF-1 was transfected into HSCs from the Drug groups in Experiment 1, respectively. The results of qRT-PCR expounded that compared with the HF group, lnc-LFAR1, GDNF and α-SMA expressions were lessened in the HF + Drug group and MTF-1 was raised, while these effects were reversed after the transfection of pcDNA-LFAR1 or sh-MTF-1 (). Next, pcDNA-LFAR1 and sh-LFAR1 were transfected into HSCs derived from the sham group in Experiment 1, respectively. qRT-PCR results corroborated that after the interference with lnc-LFAR1, lnc-LFAR1, GDNF and α-SMA expressions were lessened and MTF-1 was raised, and the overexpression of lnc-LFAR1 produced the opposite effect (). The results of western blot expounded that after the interference with lnc-LFAR1, the protein levels of α-SMA and GDNF were lessened, while MTF-1 was raised, and the overexpression of lnc-LFAR1 produced the opposite effect (). Besides, pcDNA-MTF-1 or sh-MTF-1 was transfected into HSCs derived from the sham group in Experiment 1, respectively. qRT-PCR results corroborated that after the interference with MTF-1, GDNF and α-SMA expressions were raised and MTF-1 was lessened, while there was no significant effect on lnc-LFAR1 expression, and the overexpression of MTF-1 produced the opposite effect (). The results of western blot corroborated that after the interference with MTF-1, the protein levels of GDNF, and α-SMA were raised, while MTF-1 was lessened, and the overexpression of MTF-1 produced the opposite effect ().
Figure 2. Effect of lnc-LFAR1 on MTF-1, GDNF and α-SMA expressions. pcDNA-LFAR1 or sh-MTF-1 was transfected into HSCs from the Drug groups in Experiment 1, respectively. (a&b) Detection of lnc-LFAR1, MTF-1, GDNF and α-SMA expressions. pcDNA-LFAR1 or sh-LFAR1 was transfected into HSCs derived from the sham group in Experiment 1, respectively. (c) Detection of lnc-LFAR1, MTF-1, GDNF and α-SMA expressions. (d) Detection of the protein levels of MTF-1, GDNF and α-SMA. pcDNA-MTF-1 or sh-MTF-1 was transfected into HSCs derived from the sham group in Experiment 1, respectively. (e) Detection of lnc-LFAR1, MTF-1, GDNF and α-SMA expressions. (f) Detection of the protein levels of MTF-1, GDNF and α-SMA. **P < 0.01, ***P < 0.001 vs. HF group or sh-NC (Negative control) group. Experiments were performed in triplicate. ##P < 0.01, ###P < 0.001 vs. Drug + pcDNA-NC or pcDNA-NC group
Validation of lnc-LFAR1-MTF-1-GDNF targeted regulation mechanism
We applied the online tool PROMO (http://alggen.lsi.upc.es/cgi-bin/promo_v3/promo/promoinit.cgi?dirDB=TF_8.3) to analyze and found that MTF-1 might be the transcription factor of GDNF, and the binding sites were AACTGCACCCAG, and we mutated it to CCAGTACAAACT. Next, we probed into the regulation of MTF-1 and lnc-LFAR1 on the luciferase activity of GDNF and the results expounded that MTF-1 negatively regulated the luciferase activity of GDNF (), while this effect was reversed after the transfection of pcDNA-LFAR1 (). The results of the ChIP assay expounded that MTF-1 was enriched in the GDNF promoter region (). Besides, the RNA pull-down and RIP assays corroborated that the interaction between lnc-LFAR1 and MTF-1(). Next, pcDNA-LFAR1, pcDNA-MTF-1, pcDNA-MTF-1 + pcDNA-LFAR1 were transfected into LX2 cell lines, respectively. As shown in , the overexpression of MTF-1 lessened the expression of α-SMA, while this lessening was reversed after the transfection of pcDNA-LFAR1.
Figure 3. Experimental verification of the lnc-LFAR1-MTF-1-GDNF regulation mechanism. (a&b) Dual-luciferase reporter gene assay was conducted to evaluate the regulation of MTF-1 and lnc-LFAR1 on the luciferase activity of GDNF. (c) Chromatin immunoprecipitation (ChIP) experiments were applied to analyze the binding of MTF-1 to the GDNF promoter region. (d) RNA pull-down and (e) RNA Immunoprecipitation assays were applied to verify the interaction between lnc-LFAR1 and MTF-1. pcDNA-MTF-1, pcDNA-LFAR1, and pcDNA-MTF-1 + pcDNA-LFAR1 were transfected into LX2 cell lines, respectively. (f&g) Detection of α-SMA expression. Experiments were performed in triplicate. *P < 0.05 vs. Negative control group or MTF-1 group or pc-NC group. **P < 0.01, ***P < 0.001 vs. IgG group. #P < 0.05 vs. pc-MTF-1 group. &P < 0.05 vs. pc-NC group
Crocin repressed the activation of HSCs through the lnc-LFAR1/MTF-1/GDNF axis
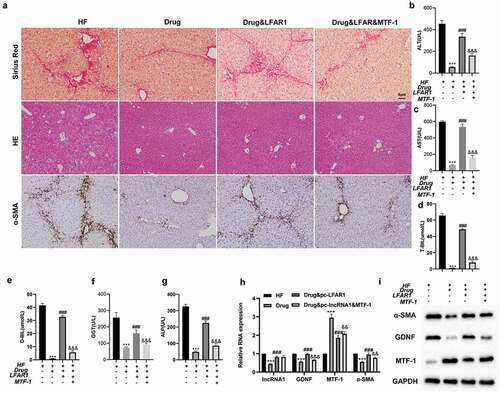
Subsequently, to further probe into whether crocin regulated the activation of HSCs through the lnc-LFAR1/MTF-1/GDNF axis in vivo, Ad-LFAR1, Ad-LFAR1 + Ad-MTF-1 were injected into mice via the tail vein. HE and Sirius Red staining expounded that compared with the HF group, liver fibrosis in mice was ameliorated after the addition of crocin, and compared with HF + Drug group, the degree of liver fibrosis was raised after the injection of Ad-LFAR1, while this effect was reversed after the injection of Ad-MTF-1 (), and the results of immunohistochemical detection of α-SMA showed the same trend (). As shown in –g, compared with the HF group, the contents of ALT, AST, T-BIL, D-BIL, GGT, and ALP were lessened in the HF + Drug group, and compared with the HF + Drug group, the contents of ALT, AST, T-BIL, D-BIL, GGT, and ALP were raised after the injection of Ad-LFAR1, while this raise was reversed after the injection of Ad-MTF-1. Mouse liver tissues were obtained and HSCs were isolated from liver tissues. The validation of the transfection efficiency of pcDNA-LFAR1 and pcDNA-MTF-1 was shown in Supplementary Figure 1. The results of qRT-PCR expounded that compared with the HF group, lnc-LFAR1, GDNF and α-SMA expressions were lessened in the HF + Drug group and MTF-1 was raised. Compared with the HF + Drug group, lnc-LFAR1, GDNF and α-SMA expressions were raised after the injection of Ad-LFAR1 and MTF-1 was lessened, while these effects were reversed after the injection of Ad-MTF-1 (). Western blot analysis corroborated that compared with the HF group, the protein levels of GDNF and α-SMA were lessened in the HF + Drug group, and MTF-1 was raised. Compared with the HF + Drug group, GDNF and α-SMA were raised after the injection of Ad-LFAR1 and MTF-1 was lessened, while these effects were reversed after the injection of Ad-MTF-1 (). Besides, sh-LFAR1 was transfected into primary HSCs for 72 h and then treated the cells with 10 ng/ml TGF-β for 24 h to probe into whether lnc-LFAR1 regulated HSC activation through the TGF-β signaling pathpay, and the results expounded that lnc-LFAR1 boosted the activation of HSCs through the TGF-β signaling pathway (Supplementary Figure 2).
Figure 4. Crocin repressed the activation of HSCs through the lnc-LFAR1/MTF-1/GDNF axis. Ad-LFAR1, Ad-LFAR1 + Ad-MTF-1 were injected into mice via the tail vein. The experiments were divided into these groups: HF, HF + Drug, HF + Drug + Ad-LFAR1, and HF + Drug + Ad-LFAR1 + Ad-MTF-1. (a) HE staining, Sirius Red staining, and immunohistochemical assays were applied to assess the degree of liver fibrosis (scale: 6 μm). (b-g) Different kits were applied to test the contents of ALT, AST, T-BIL, D-BIL, GGT, and ALP. Mouse liver tissues were obtained and HSCs were isolated from liver tissues. (h) Detection of lnc-LFAR1, GDNF, MTF-1and α-SMA expressions. (i) Detection of the protein levels of α-SMA, GDNF and MTF-1. Experiments were performed in triplicate. ***P < 0.001 vs. HF group. ###P < 0.001 vs. HF + Drug group. &&P < 0.01, &&P < 0.001 vs. HF + Drug + Ad-LFAR1 group
Discussion
Emerging evidence corroborates that crocin alleviates liver fibrosis to a certain extent, but the specific mechanism of its anti-fibrosis effect remains unclear. In this study, we found that in the mouse model of liver fibrosis, lnc-LFAR1, MTF-1, and GDNF expressions were changed after the treatment of crocin and our in-depth research corroborated that crocin restrained the activation of HSCs through the lnc-LFAR1/MTF-1/GDNF axis, and ultimately alleviating liver fibrosis in mice.
GDNF is a secreted protein and a momentous member of the TGF-β superfamily [Citation25]. More and more researches corroborate that GDNF plays momentous roles in the development of various diseases in humans [Citation26,Citation27]. Recent research corroborates that the mRNA and protein levels of GDNF are raised in the serum samples from patients with liver fibrosis, and the knockdown of GDNF restrains the activation of HSCs, thereby hindering the development of liver fibrosis [Citation13]. Another study has expounded that GDNF is negatively regulated by the transcriptional repressors HES1 and HEY1 [Citation28]. Besides, Brodbeck et al. corroborated that the GDNF promoter contains the binding sites of the transcription factor Six2, and GDNF is regulated by Six2 [Citation29]. In this study, we also found that GDNF was abnormally raised in liver fibrotic tissues or cell samples, and the crocin treatment lessened GDNF expression and our further research corroborated that the GDNF promoter contained the binding sites of the transcription factor MTF-1, and GDNF expression was also regulated by MTF-1.
Increasing evidence expounds that lncRNAs are bound up with the occurrence of various biological processes in humans [Citation30]. As reported, lncRNA HOTAIR is raised in the CCl4-induced mouse model of liver fibrosis and activated HSCs, and the raise of lncRNA HOTAIR was positively correlated with liver fibrosis markers [Citation31]. Besides, Zhang et al. corroborated that lncRNA SCARNA10 is raised in liver fibrosis tissues, and this raised lncRNA SCARNA10 inducesthe activation of HSCs by restraining PRC2, thus promoting the development of liver fibrosis [Citation32]. MTF-1 is a ubiquitous transcription regulator, and the interference with MTF-1 restrains the growth of fibrosarcoma tumors [Citation17]. In this study, we corroborated that lnc-LFAR1 was raised in a mouse model of liver fibrosis, and our further research expounded that lnc-LFAR1 lessened the expression of MTF-1 by binding to MTF-1. Besides, since MTF-1 was a transcriptional inhibitor of GDNF, the low expression of MTF-1 further raised GDNF expression, and the high expression of GDNF further boosted the activation of HSCs in liver fibrosis. Previous studies have used RNA-seq technology to screen genes with significant expression differences in disease progression and have analyzed their association with disease progression [Citation33–36], which provides new insights for our in-depth research in the future.
In summary, our experimental results expounded that crocin had the function of alleviating liver fibrosis, and our further research corroborated that crocin mainly restrained HSC activation by regulating the lnc-LFAR1/MTF-1/GDNF axis, thereby alleviating liver fibers. This discovery might provide a new strategy for the treatment of liver fibrosis, which was of great significance.
Supplemental Material
Download Zip (100.2 KB)Disclosure statement
No potential conflict of interest was reported by the authors.
Supplementary material
Supplemental data for this article can be accessed here.
Additional information
Funding
Related Research Data
References
- Li J, Wang Y, Ma M, et al. Autocrine CTHRC1 activates hepatic stellate cells and promotes liver fibrosis by activating TGF-beta signaling. EBioMedicine. 2019;40:43–55.
- Lee YA, Wallace MC, Friedman SL. Pathobiology of liver fibrosis: a translational success story. Gut. 2015;64:830–841.
- Trautwein C, Friedman SL, Schuppan D, et al. Hepatic fibrosis: concept to treatment. J Hepatol. 2015;62:S15–24.
- Schuppan D, Ashfaq-Khan M, Yang AT, et al. Liver fibrosis: direct antifibrotic agents and targeted therapies. Matrix Biol. 2018;68-69:435–451.
- Algandaby MM. Antifibrotic effects of crocin on thioacetamide-induced liver fibrosis in mice. Saudi J Biol Sci. 2018;25:747–754.
- Puche JE, Saiman Y, Friedman SL. Hepatic stellate cells and liver fibrosis. Compr Physiol. 2013;3:1473–1492.
- Mederacke I, Hsu CC, Troeger JS, et al. Fate tracing reveals hepatic stellate cells as dominant contributors to liver fibrosis independent of its aetiology. Nat Commun. 2013;4:2823.
- Liu X, Xu J, Rosenthal S, et al. Identification of lineage-specific transcription factors that prevent activation of hepatic stellate cells and promote fibrosis resolution. Gastroenterology. 2020;158:1728-1744.
- Liao X, Zhan W, Tian T, et al. MicroRNA-326 attenuates hepatic stellate cell activation and liver fibrosis by inhibiting TLR4 signaling. J Cell Biochem. 2019.
- Lapchak PA, Gash DM, Jiao S, et al. Glial cell line-derived neurotrophic factor: a novel therapeutic approach to treat motor dysfunction in Parkinson’s disease. Exp Neurol. 1997;144:29–34.
- Ayanlaja AA, Zhang B, Ji G, et al. The reversible effects of glial cell line-derived neurotrophic factor (GDNF) in the human brain. Semin Cancer Biol. 2018;53:212–222.
- Grondin R, Littrell OM, Zhang Z, et al. GDNF revisited: A novel mammalian cell-derived variant form of GDNF increases dopamine turnover and improves brain biodistribution. Neuropharmacology. 2019;147:28–36.
- Tao L, Ma W, Wu L, et al. Glial cell line-derived neurotrophic factor (GDNF) mediates hepatic stellate cell activation via ALK5/Smad signalling. Gut. 2019;68:2214–2227.
- Yu F, Geng W, Dong P, et al. LncRNA-MEG3 inhibits activation of hepatic stellate cells through SMO protein and miR-212. Cell Death Dis. 2018;9:1014.
- Yu F, Jiang Z, Chen B, et al. NEAT1 accelerates the progression of liver fibrosis via regulation of microRNA-122 and Kruppel-like factor 6. J Mol Med (Berl). 2017;95:1191–1202.
- Donato L, Scimone C, Alibrandi S, et al. Transcriptome analyses of lncRNAs in A2E-stressed retinal epithelial cells unveil advanced links between metabolic impairments related to oxidative stress and retinitis pigmentosa. Antioxidants (Basel). 2020;9:318.
- Haroon ZA, Amin K, Lichtlen P, et al. Loss of metal transcription factor-1 suppresses tumor growth through enhanced matrix deposition. Faseb J. 2004;18:1176–1184.
- Zhang K, Han X, Zhang Z, et al. The liver-enriched lnc-LFAR1 promotes liver fibrosis by activating TGFbeta and Notch pathways. Nat Commun. 2017;8:144.
- Feng J, Wang C, Liu T, et al. Procyanidin B2 inhibits the activation of hepatic stellate cells and angiogenesis via the Hedgehog pathway during liver fibrosis. J Cell Mol Med. 2019;23:6479–6493.
- Liu XD, Wu JL, Liang J, et al. Globulin-platelet model predicts minimal fibrosis and cirrhosis in chronic hepatitis B virus infected patients. World J Gastroenterol. 2012;18:2784–2792.
- Nguyen-Lefebvre AT, Ajith A, Portik-Dobos V, et al. The innate immune receptor TREM-1 promotes liver injury and fibrosis. J Clin Invest. 2018;128:4870–4883.
- Donato L, Scimone C, Rinaldi C, et al. Stargardt phenotype associated with two ELOVL4 promoter variants and ELOVL4 downregulation: new possible perspective to etiopathogenesis? Invest Ophthalmol Vis Sci. 2018;59:843–857.
- Zhang D, Song XJ, Li SY, et al. Evaluation of liver function and electroacupuncture efficacy of animals with alcoholic liver injury by the novel imaging methods. Sci Rep. 2016;6:30119.
- Arakawa Y, Amaki S, Miyakawa H, et al. PBC-AIH overlap syndrome with concomitant ITP and Hashimoto’s disease with positivity for anti-centromere antibody. J Gastroenterol. 2004;39:490–495.
- Carnicella S, Ron D. GDNF–a potential target to treat addiction. Pharmacol Ther. 2009;122:9–18.
- Donnelly CR, Shah AA, Mistretta CM, et al. Biphasic functions for the GDNF-Ret signaling pathway in chemosensory neuron development and diversification. Proc Natl Acad Sci U S A. 2018;115:E516–e525.
- Nencini S, Ringuet M, Kim DH, et al. GDNF, neurturin, and artemin activate and sensitize bone afferent neurons and contribute to inflammatory bone pain. J Neurosci. 2018;38:4899–4911.
- Garcia TX, Parekh P, Gandhi P, et al. The NOTCH Ligand JAG1 regulates gdnf expression in sertoli cells. Stem Cells Dev. 2017;26:585–598.
- Brodbeck S, Besenbeck B, Englert C. The transcription factor Six2 activates expression of the Gdnf gene as well as its own promoter. Mech Dev. 2004;121:1211–1222.
- Batista PJ, Chang HY. Long noncoding RNAs: cellular address codes in development and disease. Cell. 2013;152:1298–1307.
- Yu F, Chen B, Dong P, et al. PTEN expression via MicroRNA-29b: a novel mechanism in regulation of liver fibrosis. Mol Ther. 2017;25:205–217.
- Zhang K, Han Y, Hu Z, et al. SCARNA10, a nuclear-retained long non-coding RNA, promotes liver fibrosis and serves as a potential biomarker. Theranostics. 2019;9:3622–3638.
- Donato L, D’Angelo R, Alibrandi S, et al. Effects of A2E-induced oxidative stress on retinal epithelial cells: new insights on differential gene response and retinal dystrophies. Antioxidants. 2020;9:307.
- Donato L, Scimone C. Discovery of GLO1 new related genes and pathways by RNA-Seq on A2E-stressed retinal epithelial cells could improve knowledge on retinitis pigmentosa. Antioxidants. 2020;9:416.
- Rinaldi C, Bramanti P, Scimone C, et al. Relevance of CCM gene polymorphisms for clinical management of sporadic cerebral cavernous malformations. J Neurol Sci. 2017;380:31–37.
- Scimone C, Donato L, Katsarou Z, et al. Two novel KRIT1 and CCM2 mutations in patients affected by cerebral cavernous malformations: new information on CCM2 penetrance. Front Neurol. 2018;9:953.