
ABSTRACT
Cryptococcus neoformans is a pathogenic fungus which causes millions of deaths and infections, especially threatening immunocompromised individuals. During the development of new drugs, the ubiquitination has been found to play an important role in the regulation of the virulence and cell cycle of this fungus. Based on this mechanism, ubiquitination-related mutant strains exhibiting cell cycle arrest have been established for drug development for the fungus. However, flow cytometry detection of the cell cycle in fungi is generally difficult because the thick cell wall and capsule of fungi generally contribute to a nonspecific signal of cytometry. In this study, an improved method, derived from Saccharomyces cerevisiae assays, is developed to specifically stain C. neoformans, in whose cell cycle the G1 and G2 peaks are separated enough to be allowed for cell cycle analysis. As a result, the improved method facilitates the detection of the alterations in the cell cycle of C. neoformans with a mutation that results in cell cycle arrest, which distinctly delays the cell division of C. neoformans. Thus, the improved method reported here provides detailed technical information regarding assays on C. neoformans and, more importantly, offers a solution for assessing the cell cycle in other fungi in the future.
Abbreviation: PI: propidium iodide
Introduction
Cryptococcus neoformans is an important opportunistic pathogenic fungus. Symptomatic infection primarily presents in immunocompromised hosts, such as individuals with AIDS. C. neoformans infection, the causative agent for cryptococcal meningoencephalitis, has been reported to annually cause approximately 625,000 deaths and over 1 million new infection cases [Citation1–7]. Deaths associated with C. neoformans are mainly attributed to fungal lung infections [Citation8] and fungal penetration through the blood-brain barrier, which is facilitated by the capsule of C. neoformans [Citation9,Citation10] that functions in host immune evasion [Citation11]. In addition to the capsule, there are other factors of C. neoformans that also contribute to its virulence, including melanin [Citation12], heat-resistant [Citation13], urease [Citation14], and phospholipase [Citation10]. Currently, treatments for C. neoformans infection are limited because of the low-efficient permeation of drugs through the blood-brain barrier, as well as drug side effects and drug resistance [Citation4]. Therefore, due to the prognosis situation above in addition to the well-known sexual cycle, C. neoformans has become a model for fungal pathogenetic studies [Citation15].
Since humans are at risk of infection with the invasive fungus C. neoformans, some therapies currently under development focus on different molecular mechanisms within the fungal cell, including ubiquitination. A deubiquitinase named Ubp5 has been identified as playing an important role in regulating the growth and pathogenesis of the fungus [Citation16]. Phenotypes of the UBP5Δ mutant were reported to include alternations of virulence, capsule formation, and sporulation genesis [Citation16]. In budding yeast, a similar situation was observed [Citation17]. In consideration of the relationship between the deubiquitinase and the phenotypes above, naturally, a suspicion has become reasonable that the linkage between the ubiquitin and the phenomenon would also exist. As one of the two genes encoding ubiquitin in C. neoformans [Citation18], UBI1 was knocked out in order to create a mutated strain with the phenotype of cell cycle arrest and divisional difficulty due to the association with the Ubp5-related proliferation delay [Citation16]. Despite existing observations, populational and statistical analyses on the cell cycle have to be performed via flow cytometry.
In order to develop an applicable protocol to the cell cycle study of C. neoformans, a practicable flow cytometry staining method is needed. Since information regarding C. neoformans flow cytometry assays was limited, the method in this report was derived and upgraded from a previous method used for staining budding yeast [Citation19], as C. neoformans is also attributed to yeast [Citation20]. Whereas the previous work on the cell cycle via flow cytometry analysis had been performed on budding yeast [Citation19], in this study, we used a standard yeast strain, Saccharomyces cerevisiae S288C, as a control to examine if our cytometry results were improved during the method optimization. We then applied this improved staining method to H99, the standard strain of C. neoformans. Once the improved staining method yielded satisfying results, it was adapted to two mutant strains of C. neoformans – H99 UBI1Δ and H99 UBI1Δ::UBI1. The C. neoformans H99 UBI1Δ had the UBI1 gene knocked out, as mentioned above. And the C. neoformans H99 UBI1Δ::UBI1 was generated from the H99 UBI1Δ strain which had the UBI1 gene knocked-in back into the genome for the purpose of rescuing the cell cycle. This flow cytometry assay examined any differences in the cell cycle among the three stains in order to identify the importance of the UBI1 gene in the regulation of the cell cycle in C. neoformans. In this report, we have established a method to specially optimize the performance of the cell cycle cytometry of C. neoformans. This improved flow cytometry assay would be included in the initial evaluation of any potential target for the development of novel antibiotics, and furthermore, to be beneficial to future fungal studies.
Materials and methods
The culture of the cells
The strain of budding yeast S. cerevisiae S288C was a gift from Prof. Jin-Qiu Zhou in the Shanghai Institute of Biochemistry and Cell Biology, Chinese Academy of Sciences (CAS), Shanghai, China. It was growing at 30 °C in YPD medium (1% yeast extract, OXOID-Thermofisher, MA, USA Cat. No.: LP0021; 2% tryptone, OXOID-Thermofisher, MA, USA Cat. No.: LP0042; 2% glucose, Shanghai Reagent Co., Ltd., Shanghai, China Cat. No.: 10010518). The series of C. neoformans H99 strains including the mutated ones, H99 UBI1Δ and H99 UBI1Δ::UBI1, had been established, cultured, and then kindly offered by Dr. Wei Fang in the Shanghai Key Laboratory of Molecular Medical Mycology, Department of Dermatology, Changzheng Hospital, Naval Medical University, Shanghai, China.
Cell fixation
For both C. neoformans and S. cerevisiae, the number of 3 × 2.75 × 108 of the suspended cells of each strain together with 3 × 1 mL medium was equally divided into three aliquots and transferred into 1.5 mL tubes once the culture was stopped at the exponential phase for each strain by harvesting. The cells of each sample were concentrated into a pellet by using a desktop centrifuge working at 13,000 rpm for 2 min. Consequently, the supernatant medium was removed and the pellet was resuspended in 1 mL ddH2O for washing. After another 13,000 rpm spinning for 1 min, the supernatant was removed again and the concentrated pellet was resuspended in 75% ethanol (v/v) (Shanghai Reagent Co., Ltd., Shanghai, China Cat.: 80176961) for fixation, which had been pre-chilled at 4 °C. Normally the fixation is done for 24 h. However, since the cytometer is also used to analyze non-yeast samples, to ensure that there was no yeast contamination remained in the cytometer, the duration of fixation was extended to 1 wk. The resuspended cells were kept at 4 °C for the purpose of a longtime reservation.
Cell resuspension
The tubes containing the sample cells with ethanol were centrifuged at 13,000 rpm for 1 min for pellet concentration. The ethanol was removed and 1 mL ddH2O was added into the tubes for a resuspension by pipetting or a vortex mixing. The ddH2O supernatant was removed for an additional ethanol remove by a centrifuge at 13,000 rpm for 1 min, and another 1 mL dose of ddH2O was added into each tube for resuspension. A volume of 100 μL from the 1 mL resuspension liquid was aliquoted for the consequent staining assay. The ddH2O supernatant in the rest 900 μL volume was removed by a desktop centrifuge at 13,000 rpm for 1 min. Once the supernatant was removed, 900 μL of 75% ethanol of pre-chilled at 4 °C served the pellet for resuspension. The ethanol-resuspended cells were reserved at 4 °C for a long time.
PI (propidium iodide) staining and flow cytometry detection
The PI staining was just following the method in the previous report [Citation21,Citation22]. The flow cytometer detection was performed on the samples by using a FACSCalibur flow cytometer (Becton-Dickinson, New Jersey, USA). For the detection, the signals of 10,000 cells were collected by the CELLQuest software affiliated to the instrument.
The canonical Sybr Green I staining and flow cytometry detection
The canonical Sybr Green I staining was just following the method in the previous report [Citation19]. The sample was detected on an LSRFortessa (Becton-Dickinson, New Jersey, USA) flow cytometer. For the detection, the signals of 20,000 cells were collected by the BD FASCDiva Software Version 6.2 affiliated to the instrument.
The improved Sybr Green I staining and flow cytometry detection
The improved method was generally derived but optimized from the previous report [Citation19]. For each sample, the 100 μL of the cells resuspended in ddH2O was concentrated into a pellet in a 1.5 mL tube by using a centrifuge at 13,000 rpm for 1 min and the supernatant was removed. For the better performance, the 1.5 mL tubes of low adhesion were recommended (Eppendorf, Hamburg, Germany Cat.: 022431081). Consequently, the pellet was thoroughly resuspended in 500 μL of 50 mM sodium citrate (Shanghai Reagent Co., Ltd., Shanghai, China Cat.: 10019408) by pipetting. Then, 5 μL of the lyticase of an EZgene Yeast RNA Kit (Biomiga, CA, USA Cat.: R6617, or equivalent) was added into each tube, without adding the official lysis buffer of the kit, and then mixed by vortexing. Following, for the S288C cells, the tube was incubated at 30 °C for 1 h. For the H99 series strains, the incubation of 3 h was required and the one of 4 h was suggested. After the incubation, the cells in each tube were concentrated into a pellet by spinning at 13,000 rpm for 2 min in a centrifuge and the supernatant containing the lyticase was removed. In general, the cells would be only partially lysed after the lyticase incubation, and a pellet would usually exist. The pellet was resuspended in 490 μL 50 mM sodium citrate, and 10 μL of 20 mg/mL RNase A (Sigma-Aldrich, MO, USA Cat.: R4875, dissolved in ddH2O) was added into the resuspension for the final concentration of 0.4 mg/mL by vortexing. The RNase A incubation would be performed for at least 3 h or overnight on a shaking incubator (ThermoStatTM, Eppendorf, Hamburg, Germany) at 37 °C and 950 rpm. After the incubation, 1.25 μL of Triton X-100 (Sigma-Aldrich, MO, USA Cat.: T8787) was immediately added into the resuspension with a thorough vortex mixing at the maximum speed for 20 seconds. Subsequently, a volume of 0.5 μL of the original 10,000x Sybr Green I (Thermofisher, MA, USA Cat.: S7563) was added into the resuspension. The staining incubation was carried out in the shaking incubator at 4 °C and 950 rpm for at least 3 h or overnight. On the next day, 20 μL of 50% glycerol solution (dissolved in ddH2O, v/v, Shanghai Reagent Co., Ltd, Shanghai, China Cat.: 10010618) was added into each sample tube and thoroughly mixed by pipetting. Consequently, an ultrasonic tank (Type 2201B, Shanghai Shengyan Ultrasonic Co., Ltd.) served the samples sonication just before the cytometry detection at 4 °C for 5 min. However, sonication was considered not crucial as the improvement in the performance of the cytometry result of all the series strains was limited (Supplemental Figure 2). The sonicated samples were directly loaded onto an LSRFortessa flow cytometer (Becton-Dickinson, New Jersey, USA). For the detection, the signals of 20,000 cells were collected by the BD FASCDiva Software Version 6.2 affiliated to the instrument.
Data analysis – gating
The FlowJo v7.6.1 software was utilized to analyze the generated data files of the collected signals. Generally, for the purpose of demonstrating the exact situations of the cytometry assays, no gate was initially set up for signal selection but a quad gate was laid upon each dot plot for statistics. In detail, firstly, for the PI staining assays of both S. cerevisiae and C. neoformans, the quad gates were fixed to 200 on the FL2W::FL2W axes and 500 on the FL2A::FL2A axes (, ) and, additionally, the axes of counts in the histograms to all the PI staining assays were fixed to 400 at the maximum (, ). Secondly, for the S. cerevisiae assays by using the canonical and improved Sybr Green I staining methods, a quad gate was set up at the value of 75K for the FITC-A axes and 50K for the SSC-A axes () and, additionally, the axes of counts in the histograms were fixed to 1.5K (). However, in order to obtain the better performance, the quad gate settings in the dot plots of C. neoformans had to be differently fixed against the H99 control sample in each Sybr Green I staining method, respectively. Therefore, for the dot plots generated from the assays with the canonical Sybr Green I staining, the quad gates were fixed to 100K on the FITC-A axes and 150K on the SSC-A axes (). For the improved-method-generated dot plots, the quad gates were fixed to 100K on the FITC-A but 100K on the SSC-A axes (). For all the histograms of C. neoformans stained with Sybr Green I, the axes of counts were fixed to 800 at the maximum (). In some of the histograms, the manual line-gatings were performed in order to initially display the cell cycles.
Figure 1. The cytometry results of S. cerevisiae S288C under the three staining conditions including PI, the canonical Sybr Green I method, and the improved Sybr Green I method. (a-c). The dot plot, histogram, and automatic cell cycle statistics of S288C stained with PI. (d-f). The dot plot, histogram, and automatic cell cycle statistics of S288C stained via the canonical Sybr Green I method. (g-i). The dot plot, histogram, and automatic cell cycle statistics of S288C stained via the improved Sybr Green I method. (c,f,i). In the cell cycle statistics, the green color means the automatically analyzed G1 phase frequencies, and the blue color means the G2 phase ones, and the yellow color means the S phase ones
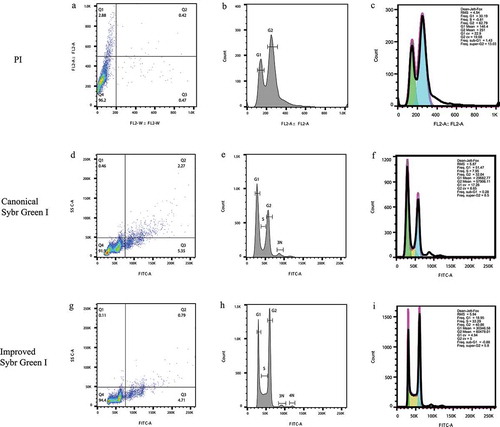
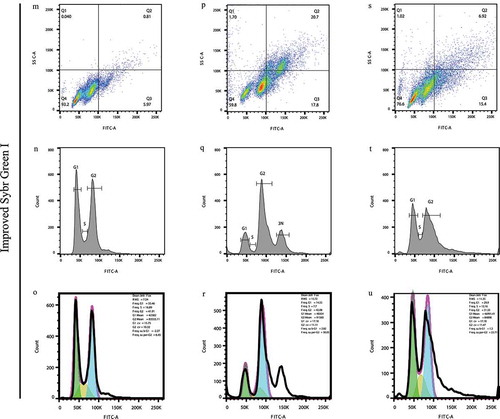
Figure 2. Flow cytometry results of C. neoformans H99 series strains stained with PI, the canonical Sybr Green I method, and the improved Sybr Green I method. (a-f). PI staining of the three strains. (g-l). Canonical Sybr Green I staining of the three strains. (m-u). Staining of the three strains via the improved Sybr Green I staining method. (a, b, g, h, m, n, o). Individual staining of H99 via the three staining methods. (c, d, i, j, p, q, r). Individual staining of H99 UBI1Δ via the three staining methods. (e, f, k, l, s, t, u). Individual staining of H99 UBI1Δ::UBI1 via the three staining methods. Due to the visibly low separations and high CV values of the peaks in the analyses, cell cycle statistics was not performed on the PI and canonical Sybr Green I staining assays but only on the improved Sybr Green I staining assays, which was more meaningful and applicable as compared with the two old methods. (o, r, u). In the cell cycle statistics, the green color means the automatically analyzed G1 phase frequencies, and the blue color means the G2 phase ones, and the yellow color means the S phase ones
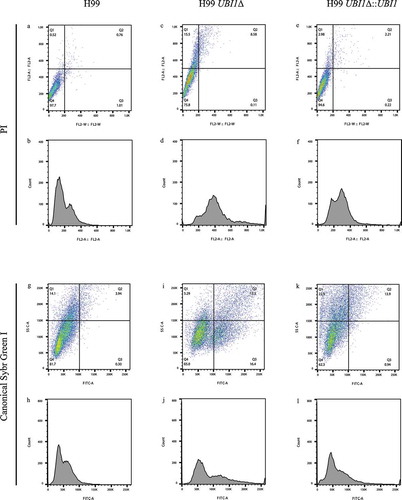
Figure 2. (Continued)
Data analysis – the automatic cell cycle statistics
Consequently, the automatic cell cycle statistics in FlowJo was performed on each sample data, and the algorithm was set to “Dean-Jett-Fox”. The other options were kept as default. Due to the limitation of FlowJo, the automatic cell cycle statistics were only designated for the G1, S, and G2 phases. Therefore, the automatic statistics was not functional for any detected phase of 3N or 4N but the manual gating could be feasible only, which, however, might lead to some inaccuracies and errors. Moreover, the scales of the count axes in the automatic cell cycle statistics were non-adjustable against the ones in the histograms, which was also another limitation of the FlowJo software.
Voltage fixation
During the signal collections on the flow cytometer, when the signal of a control sample was satisfying as the clear peaks displayed and the G1 and G2 peaks were separated by enough space, the voltage of the assay was fixed and applied to the following samples. In detail, the PI staining samples of both S. cerevisiae and C. neoformans (, ) were loaded onto the BD FACSCalibur cytometer and the voltage setting was fixed. For the S. cerevisiae samples stained by the canonical and improved Sybr Green I methods and then loaded onto the BD Fortessa cytometer (), the voltage was fixed in order to homogenize and evaluate the staining efficiencies of the two methods (FSC-A: 364, SSC-A: 364, FITC-A: 460). However, for C. neoformans assays loaded on Fortessa, the voltage of the canonical (FSC-A: 537, SSC-A: 385, FITC-A: 512, for () or the improved Sybr Green I staining method (FSC-A: 364, SSC-A: 313, FITC-A: 451, for ) had to be respectively fixed against the H99 control sample in each method group in order to obtain the better performance, respectively.
Microscopy
A fluorescence microscope (DMI 3000B, Leica, Wetzlar, Germany) served the microscopy, and the magnification rate was 200x (Supplemental Figure 3–6). The objective was 20x/0.35 (N PLAN L PH1, Leica, Wetzlar, Germany Cat.: 11506248) and the eyepieces were 10x/22 (HC PLAN S 10x/22 Br.M, Leica, Wetzlar, Germany Cat.: 11507807). The digital camera installed onto the microscope was a Type DP73 one (Olympus, Tokyo, Japan), with which the photo imagination software, cellSens Entry Version 1.9 (Olympus, Tokyo, Japan), was compatible.
Results
The improved Sybr Green I staining method illustrated a better separation in the cell cycle phases of S. cerevisiae
Cell cycle detection in fungi via flow cytometry staining generally yields nonspecific results with unseparated peaks because the fungal cell wall and capsule prevent the dye and RNase from entering the cells [Citation23]. As compared with the standard staining method using PI (propidium iodide), a method using Sybr Green I was previously developed to better identify the phases of the cell cycle [Citation19]. However, the existing methods were developed primarily for Saccharomyces cerevisiae or Schizosaccharomyces pombe, and there is no method directly applicable to C. neoformans. Therefore, we developed an improved staining method based on the current S. cerevisiae staining protocol. S. cerevisiae S288C cells were first stained, respectively, via the various methods, and the flow cytometry results were then examined in order to select the best staining method for S288C, and his method was then used for the analysis of the cell cycle in C. neoformans.
We first loaded all unstained samples, including the S288C and the total strain series of C. neoformans, onto the cytometer in order to examine the autofluorescence. The results showed that all strains had low background levels of autofluorescence. As illustrated by the histograms (Supplemental Figure 1), the peaks of the unstained strains shifted left on the horizontal axis as compared to the later results of the stained strains. PI staining, the standard method of nuclei staining, illustrated a low-level of separation with a concentrated signal mass in the dot plot ()). Although the two separated peaks of G1 and G2 were shown ()), the S phase was not clear enough for observation, which is crucial for the analysis of cell cycle. In addition, statistics illustrated high CV (coefficient of variation) values (22.9 for the G1 peak and 19.68 for the G2 peak, )), which resulted in the poor identification as lower values meant better resolutions [Citation24]. Although our cytometry results reflected a quality generally similar to that demonstrated in the previous report [Citation22], the resolution of the staining method still needed improvement.
Consequently, the “canonical Sybr Green I method” was used to stain S288C. ) shows a signal mass roughly composed of at least three nudes, which indicates a more identifiable cell cycle with at least three separated peaks ()). Furthermore, the two peaks of the G1 and G2 phases were clearly shown and were separated by a preliminarily recognizable S phase, and a “3N” peak (one mother cell with two daughter buds) even slightly came into the view ()). The standard staining method exhibited better cell cycle progression as compared to the PI staining. Our results showed that the S phase frequency was detected at 7.95% with the Sybr Green I staining method ()), while the S phase frequency with PI staining was a negative number with low confidence (-5.81%, )). Furthermore, the CV values of the G1 and G2 peaks were 17.26 and 8.65 ()) and were much lower than the values of the PI staining (22.9 and 19.68, respectively; )), which implied that a much better identification of the two peaks [Citation24] with Sybr Green I staining as compared to PI staining. Although the cell cycle peaks of the canonical Sybr Green I staining were clearly identified, the Sybr Green I method was still expected to further improve the possibility of acquiring even lower CV values in order to efficiently stain C. neoformans.
Based on our results of the improved Sybr Green I staining, the signals of the cells in the dot plot ()) were more concentrated than the ones of the canonical Sybr Green I staining ()) as 94.4% of the signals were located in the Q4 square by using the improved method, while only 91.9% were in the Q4 square by using the canonical one. With the improvement on the identification of the signals, a fourth nude even became identifiable, implying a more specific cell cycle resolution than the one of the canonical methods. The implication was subsequently supported by the histogram ()), which displayed clear cell cycle phases, including G1 and G2 peaks that were largely separated by a clear and visible S phase, and two small scatter peaks clearly followed the G2 peak and represented the 3N and 4N peaks belonged to “one mother cell with two daughter buds” and “one mother cell with three daughter buds” in the medium, as the budding yeast cells were able to reproduce multiple buddings [Citation25] (Supplemental Figure 3). This phenomenon has been seldom reported as the 3N and 4N peaks were almost invisible due to traditional staining methods with less permeability through the cell walls and with less efficiency against yeast nuclei. Additionally, the following statistics yielded analyzed results with a G1 frequency of 18.95% and a G2 frequency of 40.86%, which were separated by a clear S phase that had a higher frequency value of 33.29% ()). The frequency value of the S phase in ) was higher than that of the canonical staining (7.59%, )), which implied a more specific staining result. More importantly, the CV value of G1 was as low as 4.94, and the CV value of G2 was 5.0 ()), demonstrating two very nicely shaped peaks generated by a good staining and detection. However, due to the functional limitation of the FlowJo software, the automatic cell cycle statistics were inapplicable for the 3N and 4N peaks, respectively. Since the improved Sybr Green I staining method demonstrated the most efficient and specific staining and peak separation, it was naturally selected to be used in the staining and detection of the C. neoformans cell cycle via flow cytometry.
The improved Sybr Green I staining on C. neoformans led to the clear differences of the cell cycle
While the previously selected improved Sybr Green I staining method was reported to be the most efficient method for the detection of the cell cycle in S. cerevisiae S288C, the method was also presumed to meet the requirement for C. neoformans H99 detection. Therefore, the improved method, together with PI and the canonical Sybr Green I staining, was used to compare the staining assays of the H99 serious strains. As a result, the dot plot displayed the relatively concentrated cell masses with the statistics that the majority of the total population was concentrated in the Q4 square with little separation (97.7% in the Q4 square, )). Subsequently, the signal separation reduced to only 75.8% in the Q4 square when the UBI1 knock-out served the H99 strain ()), while the number came back to 94.6% with the serve of the UBI1 rescue ()). Therefore, the difference between the signal distributions revealed the potential cell cycle alternation. However, the histograms of cell counts released the information that the G1 and the G2 peaks were hardly separated. The reason was that, although a peak shift appeared among H99, H99 UBI1Δ, and H99 UBI1Δ::UBI1 and represented a cell cycle alternation, the G1 and G2 peaks were highly stuck to each other with little separation for all the three strains (), implying an inefficient staining on the H99 series strains.
Following, with the application of the canonical Sybr Green I staining, the separation of the signals was more distinct than with the one of the PI method. Once the knock-out of UBI1 served, the signal percentage in the Q1 plus Q4 square reduced from 95.8% (14.1%+81.7% = 95.8%, )) to 70.29% (5.29%+65.0% = 70.29%, )). On the contrary, the number largely came back to 85.2% (22.9%+62.3% = 85.2%, )) and become closed to the H99 control when the UBI1 was rescued. However, although the situation was consequently visualized by the histograms with a relatively clear peak shift, the low efficiency of the non-improved Sybr Green I on the H99 series strains was still identified due to the little peak separation ().
Subsequently, the improved Sybr Green I staining largely optimized the cytometry performance as the signal differences became more evident than the previous two methods. In detail, the H99 signals were highly concentrated in the Q4 square (93.2%, )) and with 2 distinct nudes, yielding two identified cell cycle phases, which was subsequently supported by a distinctly identified cell cycle of H99 in the histogram with the sharp G1 and G2 peaks separated by an S phase (), Supplemental Figure 4) and followed by the statistics explaining that the frequencies of the G1 and G2 peaks were, respectively, 35.46% and 41.91% with the CV values of 15.75 and 10.32. Moreover, the S phase was also detectible with a frequency of 16.89% ()). In contrast to the H99 control, when the UBI1 knock-out served the H99 strain, only 59.8% of the signals were located in the Q4 square but 20.7% were in the Q2 square for the H99 UBI1Δ strain ()). The numbers strongly suggested a cell cycle alternation which was clarified by the phenomenon that, not only the first nude became fading and the second nude appeared more thickset, but also, besides the two distinct signal nudes in the Q4 square, a third nude arose in the Q2 square indicating a cell cycle of three phases under the knock-out influence. This founding was followingly supported by the histogram that a significant shift of the signal distribution appeared as, in contrary to the cell cycle distribution of the control H99 ()) with the higher G1 peak and the lower G2 peaks, the signal of the G1 peak significantly reduced while the G2 peak remarkably increased onto a level much higher than the G1 one ()). Besides, a third peak unexpectedly appeared and followed the G1 and G2 peaks, which indicated a subgroup of cells in the 3N phase that contained tripled DNA among the total cell population ()). The statistics also supported that the sharp decline for the G1 peak appeared with the frequency of only 14.55% ()), comparing with the one of 35.46% of the H99 control ()). On the contrary, the G2 peak was maintained at the original level (42.08%, )), which was separated from the G1 peak by the S phase of the frequency of 7.7%. Due to the software limitation, the automatic cell cycle statistics on the 3N peak by FlowJo became inapplicable. Therefore, the frequency of the 3N peak was presumed to be no more than the number of 35.67% (100%-freq.G1%-freq.S%-freq.G2%, )). This supported the importance of UBI1 in the G2/3N-phase detainment, which was believed to occur in more than a half of the H99 UBI1Δ population. All the analyses above revealed that the reproduction of C. neoformans was largely inhibited, and the cell cycle was arrested at the G2-3N phase upon knock-out of UBI1. This was because the mutant strain was forced to generate inseparable cells containing the duplicated and even triplicated genome, which was confirmed by the fluorescent microscopy (Supplemental Figure 5).
Since the importance of UBI1 on the cell cycle was preliminarily confirmed by flow cytometry after knock-out, the UBI1 gene was then knocked-in back to the C. neoformans H99 UBI1Δ strain for the rescue assay in order to reversely examine the function of UBI1. Therefore, when the UBI1 rescue served, the signal proportion in the Q4 square was elevated to 76.6% and the one in the Q2 dropped to only 6.92% (), Supplemental Figure 6), suggesting a rescued population comparing with the mutated one ()) as a large proportion of the signals became concentrated back to the position where the H99 control signals were. Although the shape of the G1 and G2 peaks after rescue with UBI1 ()) was generally restored to the levels of the previous H99 control results ()), some differences still existed, such as the heights of the two peaks of the H99 UBI1Δ::UBI1 strain were neither so high nor so sharp as those of H99. This was presumed to be attributed to the rescue efficiency. The following statistics also showed that the frequency of the G1 peak returned back to normal levels (29.9%, )), which was very close to H99 (35.46%, )). Therefore, the ratio of the G1/G2 peak frequencies of the rescued strain (0.948, )) was very similar to the one of the H99 control (0.846, )) but not H99 UBI1Δ (0.346, )). All of the results and analyzed statistics shown above suggested that S288C was a stable control fungus for flow cytometry, and this method provided a sufficient cytometry staining and detection of C. neoformans. Additionally, our results confirmed the essential function of UBI1 when playing an important role in regulating the cell cycle of the C. neoformans.
Discussion
Lyase digestion for the G1/G2 separation of C. neoformans
Although the G1 and G2 peaks were separated by the improved Sybr Green I staining method, the S phases were not very clearly distinguished in the histograms of all three C. neoformans strains () comparing with the S. cerevisiae cytometry ()). Therefore, we wondered if it was possible to improve upon the staining for the C. neoformans by decreasing the background. However, the canonical Sybr Green I method was designed for S. cerevisiae only, and the improved one was also not independently developed but derived and optimized from the canonical one, which led to no direct staining method available for C. neoformans until this report. Nevertheless, the aim for distinguishing the difference among the cell cycles of the H99, H99 UBI1Δ, and H99 UBI1Δ::UBI1 strains was successfully achieved. Any attempt to improve this method, such as extending the lyase digestion time on C. neoformans or increasing the concentration of Sybr Green I, would be worthy of consideration. Therefore, multiple attempts would be performed in the future until a complete separation between the G1 and G2 peaks and a clear S phase peak is achieved.
The cell cycle statistics of the 3N and 4N phases of S. cerevisiae
The Saccharomyces cerevisiae S288C strain reproduces by means of budding, which means that a bud asymmetrically generates from a mother cell, matures, and divides to become a separated daughter cell. However, when a bud stays on a mother cell, another bud might begin to generate. Therefore, it is possible that a mother cell with two buds containing a tripled genome (3N phase) or even a mother cell with three cells with a quadrupled genome (4N phase) may exist [Citation25] (Supplemental Figure 3). Hence, the detection of the 3N and 4N phases is also theoretically feasible.
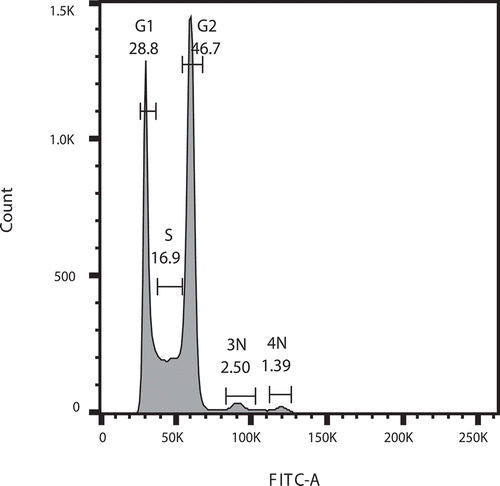
Although the peaks of the 3N and 4N phases were successfully detected ()), only the G1 and G2 peaks were identified in the function of cell cycle statistics using the “Watson” or “Dean-Jett-Fox” algorithm due to the limitation of the FlowJo software. Therefore, performing the automatic cell cycle statistics on the 3N and 4N peaks became inapplicable. However, the statistics can be executed manually. Based on the existing range gates of the G1, S, and G2 phases in ), two other range gates were manually set up for the 3N and 4N phases in the histogram for a frequency calculation (). As a result, G1 had a frequency of 28.8%, while 46.7% of cells were located in the G2 phase with an S phase population of 16.9%. Additionally, the 3N and 4N peaks, which were manually gated, yielded the analyzed frequencies of 2.5% and 1.39%, respectively, which suggested a phenomenon that the populations of “triploids” (one mother cell with two daughter buds) and “tetraploids” (one mother cell with three daughter buds) were calculable in the entire S. cerevisiae population. Moreover, the figure ()) clearly illustrates that, as long as a staining and detection method with enough efficiency are provided, the 3N and 4N phases in the fungal population are detectible, even if the percentages are low. However, the errors of the statistics generated from the manual gating should be also noticed. The analyzed data not only exhibit the sensitivity of the improved Sybr Green I staining method for detecting the cell cycles of the two fungi but also provide a possibility for similar research on fungi of other species in the future.
Figure 3. The additional manual cell cycle statistics performed on , including the statistical numbers to each phase
Application of the improved staining method
The staining of fungi nuclei via flow cytometry has always met some difficulties. One of the most important reasons is because the cell wall of fungi largely prevents RNases and dyes from entering the cytoplasm and nucleus for RNA digestion and chromatin staining [Citation23]. Moreover, capsules of some fungi, including C. neoformans, are even thicker than the cell wall and are presumed to be more efficient than cell walls at preventing RNases and dyes from entering the cytoplasm and nucleus. Therefore, in order to specifically stain nuclei, a partial enzymatic digestion of the fungal cell wall and capsule is required prior to staining, and the selection of an efficient enzyme for digestion is critical. The new method is utilizing a lyase in commercial fungal DNA or RNA purification kits. By providing the technique details and flow cytometry analysis results, this improved method has been hereby introduced for the more precise detection of two fungi, S. cerevisiae and C. neoformans, and this new method has been designated to bring some benefits to future studies on fungi.
Supplemental Material
Download PDF (52.2 MB)Acknowledgments
I would like to thank Professor Jin-Qiu Zhou for providing the S. cerevisiae S288C strain and Dr. Wei Fang for providing the series of C. neoformans H99 strains, including all of the mutated strains, for this study. I would also like to especially thank Ms. Shu-Hui Sun in the Flow Cytometry Core Facility of the Department of Microbiology and Parasitology, School of Basic Medical Sciences, Fudan University, for her indisputably perfect flow cytometry instrument service.
Disclosure statement
No potential conflict of interest was reported by the author.
Supplementary material
Supplemental data for this article can be accessed here.
References
- Park BJ, Wannemuehler KA, Marston BJ, et al. Estimation of the current global burden of cryptococcal meningitis among persons living with HIV/AIDS. AIDS. 2009;23(4):525–530.
- Srikanta D, Santiago-Tirado FH, Doering TL. Cryptococcus neoformans: historical curiosity to modern pathogen. Yeast. 2014;31:47–60.
- Saijo T, Chen J, Chen SC, Rosen LB, Yi J, Sorrell TC, Bennett JE, Holland SM, Browne SK, Kwon-Chung KJ. Anti-granulocyte-macrophage colony-stimulating factor autoantibodies are a risk factor for central nervous system infection by Cryptococcus gattii in otherwise immunocompetent patients. mBio. 2014;5:e00912–14.
- Gullo FP, Rossi SA, Sardi Jde C, et al. Cryptococcosis: epidemiology, fungal resistance, and new alternatives for treatment. Eur J Clin Microbiol Infect Dis. 2013;32:1377–1391.
- Litvintseva AP, Carbone I, Rossouw J, et al. Evidence that the human pathogenic fungus Cryptococcus neoformans var. grubii may have evolved in Africa. PloS One. 2011;6:e19688.
- Sloan DJ, Parris V. Cryptococcal meningitis: epidemiology and therapeutic options. Clin Epidemiol. 2014;6:169–182.
- Mitchell TG, Perfect JR. Cryptococcosis in the era of AIDS–100 years after the discovery of Cryptococcus neoformans. Clin Microbiol Rev. 1995;8:515–548.
- Chang CC, Sorrell TC, Chen SC. Pulmonary Cryptococcosis. Semin Respir Crit Care Med. 2015;36:681–691.
- Barbosa FM, Fonseca FL, Figueiredo RT, et al. Binding of glucuronoxylomannan to the CD14 receptor in human A549 alveolar cells induces interleukin-8 production. Clin Vaccine Immunol. 2007;14:94–98.
- Olszewski MA, Zhang Y, Huffnagle GB. Mechanisms of cryptococcal virulence and persistence. Future Microbiol. 2010;5:1269–1288.
- Kozel TR, Gotschlich EC. The capsule of cryptococcus neoformans passively inhibits phagocytosis of the yeast by macrophages. J Immunol. 1982;129:1675–1680.
- Zhu X, Williamson PR. Role of laccase in the biology and virulence of Cryptococcus neoformans. FEMS Yeast Res. 2004;5:1–10.
- Perfect JR. Cryptococcus neoformans: the yeast that likes it hot. FEMS Yeast Res. 2006;6:463–468.
- Cox GM, Mukherjee J, Cole GT, et al. Urease as a virulence factor in experimental cryptococcosis. Infect Immun. 2000;68:443–448.
- Hull CM, Heitman J. Genetics of Cryptococcus neoformans. Annu Rev Genet. 2002;36:557–615.
- Fang W, Price MS, Toffaletti DL, et al. Pleiotropic effects of deubiquitinating enzyme Ubp5 on growth and pathogenesis of Cryptococcus neoformans. PloS One. 2012;7:e38326.
- Finley D, Sadis S, Monia BP, et al. Inhibition of proteolysis and cell cycle progression in a multiubiquitination-deficient yeast mutant. Mol Cell Biol. 1994;14:5501–5509.
- Spitzer ED, Spitzer SG. Structure of the ubiquitin-encoding genes of Cryptococcus neoformans. Gene. 1995;161:113–117.
- Fortuna M, Sousa MJ, Corte-Real M, et al. Cell cycle analysis of yeasts. Curr Protoc Cytom. 2001. Chapter 11: Unit11.3:11.13.1–11.13.9.
- Buchanan KL, Murphy JW. What makes Cryptococcus neoformans a pathogen? Emerg Infect Dis. 1998;4:71–83.
- Haase SB, Lew DJ. Flow cytometric analysis of DNA content in budding yeast. Methods Enzymol. 1997;283:322–332.
- Haase SB, Reed SI. Improved flow cytometric analysis of the budding yeast cell cycle. Cell Cycle (Georgetown, Tex). 2002;1:132–136.
- Li L, Miles S, Breeden LL. A Genetic Screen for Saccharomyces cerevisiae Mutants That Fail to Enter Quiescence. G3 (Bethesda). 2015;5:1783–1795.
- Benson NA, Braylan RC. Evaluation of sensitivity in DNA aneuploidy detection using a mathematical model. Cytometry. 1994;15:53–58.
- Townsend GF, Lindegren CC. Characteristic growth patterns of the different members of a polyploid series of Saccharomyces. J Bacteriol. 1954;67:480–483.