
ABSTRACT
MiR-206 is abnormally expressed in infant hemangioma endothelial cells (HemECs), but the mechanism is not clear. We explored the intervention of miR-206 in HemECs in relation to extracellular matrix (ECM) metabolism. We selected 48 cases of infantile hemangioma (IH) from volunteer organizations. After the isolated and extracted HemECs were interfered with overexpressed or silenced miR-206, the effects of miR-206 on the proliferation, migration and invasion of HemECs were examined through basic cell function experiments. The expression differences of miR-206, DNA Methyltransferase 3A (DNMT3A) and ECM-related genes were analyzed as needed by qRT-PCR or Western blot. TargetScan and dual-luciferase experiments were applied to predict and confirm the binding relationship between miR-206 and DNMT3A. The correlation between miR-206 and DNMT3A was analyzed in IH tissues by Pearson correlation coefficient, and further confirmed in HemECs by conducting rescue experiments. A nude mouse model of xenograft tumor was constructed to verify the results of in vitro experiments. MiR-206, which was downregulated in proliferative hemangioma, suppressed the malignant development of HemECs by regulating ECM-related genes. As the target gene of miR-206, DNMT3A was high-expressed in IH tissues and was negatively correlated with miR-206. Overexpressed DNMT3A counteracted the inhibitory effect of miR-206 mimic on HemECs and its regulatory effect on ECM. The results of in vivo experiments were consistent with those from cell experiments. Thus, miR-206 could promote ECM accumulation through targeted inhibition of DNMT3A, further inhibiting the malignant development of HemECs and relieving IH.
1. Introduction
Infantile hemangioma (IH) is a benign tumor occurring at skin and soft tissues due to the growth of vascular tissues during embryonic period [Citation1]. Excessive proliferation of vascular endothelial cells is the most important biological characteristic of IH that distinguishes it from vascular malformation [Citation2]. The natural course of IH is generally divided into proliferation period, regression period, and regression completion period. The entire growth cycle lasts from several months to several years from the birth of an infant [Citation3]. However, current inadequate understanding of the pathogenesis and regression mechanism of IH greatly limits clinical efficacy of IH treatment [Citation4]. At the same time, only few effective risk assessment indicators for IH have been discovered [Citation5]. Therefore, it is highly necessary to further study the mechanism of the occurrence and development of IH.
Regarding the pathogenesis of IH, it is currently believed that hemangioma can cause abnormal proliferation of vascular endothelial cells, which could alter local microenvironment and abnormal endothelial cell transformation, such as the imbalance of angiogenic factors and inhibitors, compositional or functional abnormalities of immune cells, and elevated estrogen levels [Citation6,Citation7]. However, angiogenic factors alone are not capable enough to induce a rapid growth of hemangioma unless under the joint actions with multiple environmental factors. Study showed that extracellular matrix (ECM) can directly affect the response of endothelial cells to angiogenic factors through its expression of integrins [Citation8]. ECM mainly provides a necessary scaffold for maintaining the vascular tissue structures of vascular endothelial cells through adhesion with integrins on the surface of endothelial cells [Citation9,Citation10]. The interaction of endothelial cell integrins and interstitial matrix proteins (interstitial collagen and fibrin/fibronectin) is a key receptor that stimulates endothelial cell tubular formation and simultaneously activates endothelial cells [Citation11,Citation12]. The main integrins responsible for these interactions are α2β1, α1β1, and αvβ3, α5β1, which are collagen and fibrin and fibronectin receptors, respectively [Citation13–16]. ECM is a dynamic network structure between cells and consists of macromolecular substances such as collagen, proteoglycan and glycoprotein [Citation17]. At present, the most researched ECMs related to the proliferation and degeneration of hemangioma are mainly laminin (LN), fibronectin (FN) and vitronectin (VN) [Citation18,Citation19]. It has been reported that LN was detected in the thickened basement membranes of hemangioma [Citation20]. α6-integrin subunit contribute to tumor angiogenesis and invasive properties of tumor cells [Citation21]. Nonetheless, other related factors involved still require further study.
MicroRNAs (miRNAs), which are a member of the small RNA family with about 20 bases, can partially or completely recognize specific targeted mRNAs, and degrade the mRNAs at the transcription level or inhibit its expression, thereby completely silencing or inhibiting the formation of a target protein [Citation22]. Up to now, a large number of studies have clarified the important role of miRNA in tumors [Citation23,Citation24]. Changes in miRNA activity are also found to be of great significance in the course of IH [Citation25,Citation26]. For example, miR-424 inhibits the bFGF/FGFR1 pathway and prevents the phosphorylation of ERK1/2, thereby inhibiting the development of IH [Citation27]; miR-187-3p and miR-382 could improve the condition of IH [Citation28,Citation29]. The intervention effect of miR-206 in tumors has been extensively studied. For example, in hepatocellular carcinoma in which tumor cells sustain intense metabolic rewiring [Citation30–33], miR-206 has been shown to repress genes that were involved in carcinogenesis and lipid metabolism [Citation34]. Furthermore, it has been reported that VEGFA is a downstream target gene of miR-206, and the up-regulation of miR-206 promotes the apoptosis of human lung microvascular endothelial cells [Citation35,Citation36]. Research also found that the expression of miR-206 in IH tissues is abnormally reduced [Citation37]. These results suggest that miR-206 may be a specific molecular marker in the development of IH.
This study aimed to explore the regulatory effect and mechanism of miR-206 in IH, and to clarify the effects of ECM metabolism on the proliferation and metastasis of infant human hemangioma endothelial cells (HemECs).
2. Materials and methods
2.1. Ethics statement and sample collection
From 2015 to 2019, the research team collected IH tissue samples and normal subcutaneous tissue samples adjacent to hemangioma from 48 pairs of IH patients at Nanfang Hospital. According to histopathological diagnosis, the 48 IH cases consisted of 27 cases of proliferative hemangioma and 21 cases of involuting hemangioma. In compliance with the ethical requirements of clinical research, an application was submitted to the Nanfang Hospital Ethics Committee and approved (No.2015003-XGWK) before the initiation of this study. Before sample collection, the guardians of the infant patients signed a written informed consent and were informed of the use of the sample tissues for research purpose. All the samples were removed and cleaned by surgical resection, and then frozen in liquid nitrogen for subsequent research.
The animal research was approved by the Nanfang Hospital Ethics Committee (No. 2,019,027-XGWK). Thirty male balb/c nude mice (6 weeks old, SPF grade) ordered from GDMLAC (China) were kept in a breeding center at a temperature of 22℃ and a humidity of 55% and were provided with free access to eating and drinking.
2.2. Separation and processing of HemECs
The hemangioma tissue of one child with proliferative hemangioma was sectioned into 3 tissue blocks of about 1 mm2. A petri dish added with complete medium (90% DMEM medium + 10% fetal bovine serum + 100 U/ml penicillin + 100 µg/ml streptomycin) in advance was placed in a 37°C incubator (D180-P, RWD, China) and incubated with the tissue blocks for 1 hour (h). The tissues were then inoculated on the bottom of the petri dish at a space of about 1 mm from each other, when completely attached, the tissues were cultured in the incubator for 4–6 h. After culture, whether the small tissue pieces were firmly attached was confirmed again before turning over the petri dish for continuing the culture. The medium was changed every 2 days (d). After 10–14 d, the HemECs around the tissues were digested using trypsin-EDTA digestion solution (T1300, Solarbio, China) and collected. Next, HemECs at a ratio of 1:3 were transferred to culture flasks for re-cultivation.
To study the effects of miRNA and target genes on HemECs, we transfected miR-206 mimic, miR-206 inhibitor, overexpressed DNA Methyltransferase 3A (DNMT3A) and their respective negative controls into HemECs by liposome transfection techniques. MiR-206 mimic (miR10,000462-1-5), miR-206 inhibitor (miR20000462-1-5) and their negative controls mimic control (miR1N0000002-1-5), inhibitor control (miR2N0000002-1-5) were all synthesized and provided by Guangzhou RIBOBIO Biological Company (China). The overexpressed plasmid of DNMT3A was constructed by inserting the amplified sequence of DNMT3A into the pcDNA3.1(+) vector (V790-20, Invitrogen, USA), and its negative control was constructed by inserting the scramble sequence into the pcDNA3.1(+) vector. A Lipofectamine 3000 kit (L3000008, Invitrogen, USA) was used for transfection. The synthetic plasmids were sequentially transfected into HemECs under the instructions of the kit. 48 h after the transfection, the transfection efficiency of the cells was detected by RNA extraction and quantitative real-time polymerase chain reaction (qRT-PCR).
2.3. RNA extraction and qRT-PCR
Before qRT-PCR detection, the RNA isolation reagent Trizol (15,596–026, Invitrogen, USA) was use to extract total RNA from the sample tissues and HemECs, and the RNA concentration was measured with the ALLSHENG Nano-100 spectrophotometer. Then cDNA was synthesized with the extracted RNA using a RevertAid First Strand cDNA Synthesis Kit (K1621, Thermo Scientific™, USA). With reference to a previous report [Citation38], we mixed cDNA, gene primers (Sangon, China) and SYBR® Green I nucleic acid gel stain (S9430, Sigma-Aldrich, USA) in a qRT-PCR reaction system. After adding the system to the PCR detection instrument (T100, BIO-RAD, USA), qRT-PCR detection was performed with a 96-well plate under the following condition: pre-denaturation at 95℃ for 10 minutes (min), denaturation at 95℃ for 15 seconds (s), annealing at 58℃ for 1 min, for a total of 40 cycles. As previously demonstrated [Citation38], the final gene mRNA level was calculated according to the 2−ΔΔCT calculation method. β-actin and U6 were internal references. The primer sequences used for gene detection are listed in .
Table 1. Primers for qRT-PCR
2.4. Cell counting cell-8 (CCK-8)
The transfected HemECs were made into a single cell suspension at a concentration of 1 × 10⁵ cells/mL, and then seeded into a 96-well plate. Under conventional incubation conditions, HemECs were allowed to incubate for 24 h, 48 h and 72 h. 10 μL of CCK-8 solution (Cat. No.: HY-K0301, MedChemExpress, USA) was added to each well. To allow CCK-8 to fully bind to the mitochondria in HemECs, the mixture was incubated for another 4 h. Finally, a SynergyTM LX multi-function microplate detector (BioTek, USA) was applied to perform function detection. The effects of different treatment conditions on the viability of HemECs were examined by analyzing the absorbance (OD) of HemECs at 450 nm.
2.5. Colony formation assay
Two hundred HemECs in each group were transferred to petri dishes containing 10 mL of complete medium. The dishes were slowly shaken to evenly distribute the HemECs. The HemECs in the petri dishes were collected after 14 d of routine propagation. During the cultivation, the culture medium was changed every two days. The collected HemECs were stained with Giemsa for 20 min. Finally, a NIKON microscope (E100, Japan) was used to count the number of HemECs in the field of view and calculate relative colony formation rate.
2.6. Wound healing assay
A wound healing-culture insert (80,206, Ibidi, Germany) was applied to create a wound in this study. According to the instructions of the insert, the treated HemECs were inoculated into sterile insert holes. After 24 h of standing, the insert was removed from the petri dish, and 2 mL of HemECs complete medium was added to the petri dish. The location of cell scratches by taking pictures under a microscope (magnification 100 ×) and the time point as 0 h. HemECs were incubated again for 24 h under normal conditions and photographed accordingly.
2.7. Cell invasion assay
Cell invasion detection was performed using Transwell (Corning, USA) and Matrigel in an 8.0 µm Pore Polyester membrane insert. In brief, 3 × 10⁴ HemECs were inoculated on the upper layer of the Transwell chamber covered with homogenized Matrigel glue (356,234), while the lower layer of the Transwell chamber was supplemented with HemEC complete medium. After conventional culture for 48 h, the HemECs cells in the lower layer were collected, washed and fixed. For an easier observation, HemECs were stained with Giemsa. Finally, the number of invading cells was counted with a microscope at a magnification of 100 times.
2.8. Western blot
For total protein extraction, both the separated HemECs and the removed transplanted tumor tissues were fully processed with RIPA Lysis and Extraction Buffer (89,900, Thermo Scientific™, USA). The transplanted tumor tissues were processed into a homogenate prior to the HemECs. The protein concentration was determined using a BCA kit (23,227, Thermo Scientific™, USA) and a spectrophotometer. The protein was then firmly fixed on the 0.22 μm nitrocellulose filter membrane (20 mA, 90 min; N8645, Millipore, USA) after high-temperature denaturation, SDS-PAGE (the electrophoresis voltage of the upper concentrated gel was 80 V, and the electrophoresis voltage of the separation gel was 100V), and blocking treatment at room temperature. According to our experimental design, primary antibodies were used to cover the protein on the membrane overnight at 4℃. Secondary antibody (room temperature, 1.5 h) was probed after washing odd the primary antibody. The formed HRP-labeled antigen-antibody complex was reacted with Immobilon ECL Ultra Western HRP Substrate (WBULS0100, Millipore, USA) for developing fluorescent signal, which was collected by a Gel Doc™ XR+ instrument (BIO-RAD, USA) and processed into a visualized strip chart. The antibodies used in this experiment were DNMT3A (ab232391, 102 kDa, 1:1000), matrix metalloprotein-2 (MMP-2, ab92536, 74 kDa, 1:2000), MMP-9 (ab38898, 92 kDa, 1:1000), collagen 2A1 (COL2A1, ab188570, 142 kDa, 1:3000), Aggrecan (ab3778, 250 kDa, 1:1000), β-actin (1:3000, ab8226, 42kDa, 1:5000), Goat Anti-Rabbit antibody (1:10,000, ab6721), Goat Anti-Mouse antibody (1:10000, ab205719). All the antibodies were produced by Abcam (USA).
2.9. Bioinformatics analysis and verification
The binding sequence of miR-206 and DNMT3A was determined on the TargetScan database (http://www.targetscan.org). The wild-type (WT) and mutant (MUT) reporter gene plasmids of DNMT3A were designed and synthesized by Nanjing COBIOER based on the targeted binding sequence. According to the grouping, DNMT3A-WT and DNMT3A-MUT were co-transfected with miR-206 mimic and mimic control into HemECs for 48 h, respectively. Next, the transfected HemECs were processed with reagents in the TransDetect® Double-Luciferase Reporter Assay Kit (FR201-01, TransGen Biotech, China). After the reaction, the fluorescence intensity of HemECs was analyzed on a GloMax 20/20 dual-luciferase detector (Promega, USA).
2.10. Xenograft experiment
After allowing to adapt to the environment for 3 d, all the nude mice were randomly divided into 3 groups (n = 10), HemECs group (subcutaneous injection of HemECs), HemECs+agomiR-NC group (subcutaneous injection of HemECs transfected with agomiR negative control), and HemECs+agomiR-206 group (subcutaneous injection of HemECs transfected with agomiR miR-206). AgomiR miR-206 (miR40017004-4-5) and its negative control (agomiR-NC, miR4N0000001-4-5) were also provided by RIBOBIO. The treated HemECs (1 × 10⁷ cells/mL) were injected into the armpits (100 μL) of the nude mice in different groups once every 5 days.
During the experiment, we recorded the changes in tumor volume every week from the first week to the fifth week. After 5 weeks of tumorigenesis, all the nude mice were quickly sacrificed by cervical dislocation. The transplanted tumor was removed from the armpit of the nude mice with no vital signs and weighed.
2.11. Statistical analysis
The experimental data were all statistically analyzed by GraphPad Prism 8.0 (GraphPad Software, USA) to obtain the final results. Paired t-test was used to analyze the expression differences of miR-206 and DNMT3A between adjacent, proliferative hemangioma and involuting hemangioma. Differences between multiple groups were compared by one-way ANOVA followed by Tukey’s test. The correlation between miR-206 and DNMT3A was analyzed by Pearson Correlation Coefficient. Statistical significance was determined when p < 0.05.
3. Results
3.1. MiR-206 was down-regulated proliferative hemangioma, but its up-regulation attenuated the malignant development of HemECs by regulating ECM-related genes.
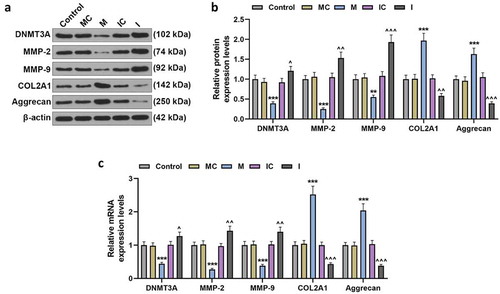
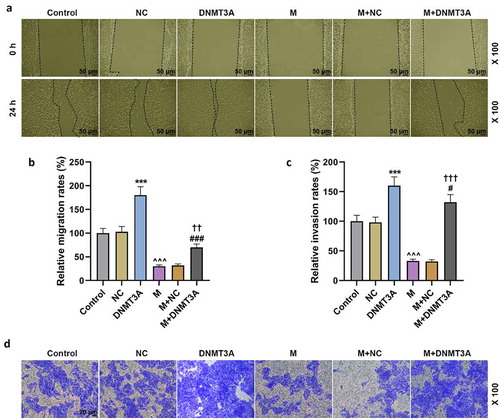
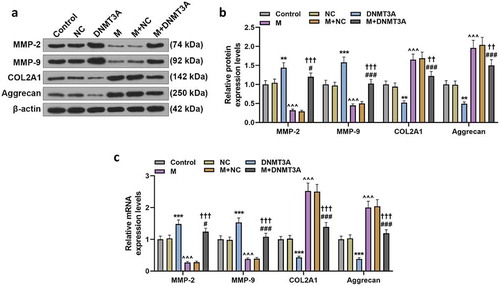
In the clinical samples collected, the expression of miR-206 in proliferative hemangioma tissues was significantly lower than that in adjacent and involuting hemangioma (p < 0.001, ). To clarify the effect of miR-206 on IH, we transfected the miR-206 mimic, mimic control, miR-206 inhibitor and inhibitor control into the extracted HemECs. The results showed that miR-206 mimic significantly up-regulated the mRNA expression of miR-206, while the silencing effect of miR-206 inhibitor on the cells was not significant (p < 0.001, ). In the following cell function experiments, miR-206 mimic effectively reduced the viability of HemECs and inhibited their proliferation, migration and invasion, whereas miR-206 inhibitor promoted the viability, proliferation, migration and invasion of HemECs (p < 0.05, and ). Further study showed that miR-206 mimic increased the protein and mRNA expression of COL2A1 and Aggrecan, while decreased the protein and mRNA expressions of DNMT3A, MMP-2 and MMP-9 (p < 0.01, ). In addition, compared with the IC group, the expressions of DNMT3A, MMP-2 and MMP-9 were increased, while the expression of COL2A1 and Aggrecan was decreased (p < 0.05, ).
Figure 1. MiR-206 was down-regulated in proliferative hemangioma, but its up-regulation reduced the viability and proliferation of HemECs
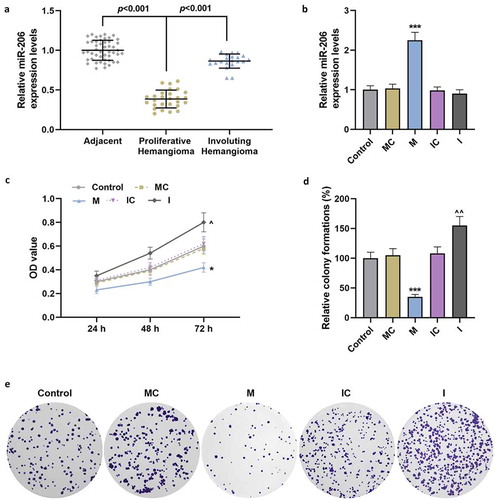
Figure 2. MiR-206 reduced the migration and invasion of HemECs
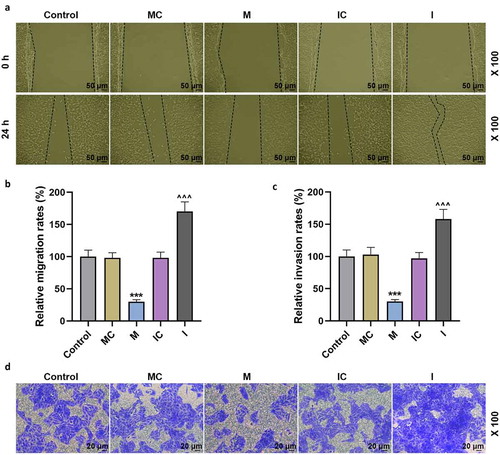
Figure 3. MiR-206 significantly regulated the expressions of DNMT3A and ECM-related genes
3.2. Up-regulated DNMT3A in proliferative hemangioma could bind to miR-206 and was negatively correlated with miR-206.
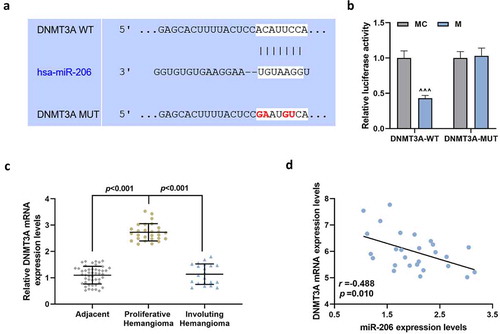
To verify the binding sequence between DNMT3A and miR-206 () acquired from TargetScan, dual-luciferase experiment was conducted. As shown in , co-transfection of DNMT3A-WT and miR-206 mimic reduced the luciferase activity (p < 0.001, ). Subsequent experiments confirmed that the expression of DNMT3A in proliferative hemangioma was significantly up-regulated (p < 0.001, ), and DNMT3A expression was negatively correlated with the mRNA level of miR-206 (r = −0.488, p = 0.010, ).
Figure 4. Up-regulated DNMT3A in proliferative hemangioma could bind to miR-206 and was negatively correlated with miR-206
3.3. Overexpressed DNMT3A counteracted the inhibitory effect of miR-206 mimic on HemECs
Overexpressed DNMT3A plasmid was transfected into HemECs by lipofection to overexpress DNMT3A (p < 0.05, ), and we found that the expression of DNMT3A was higher in DNMT3A group than that in NC group, and that DNMT3A overexpression partially neutralized the inhibitory effect of miR-206 mimic on DNMT3A expression (p < 0.05, ). This finding was further confirmed by the results of a series of rescue experiments. Overexpressed DNMT3A significantly promoted the viability, malignant proliferation, migration and invasion of HemECs (p < 0.001, and ), and it counteracted the inhibitory effect of miR-206 mimic on the malignant development of HemECs (p < 0.05, and ).
Figure 5. Overexpressed DNMT3A counteracted the inhibitory effect of miR-206 mimic on the viability and proliferation of HemECs
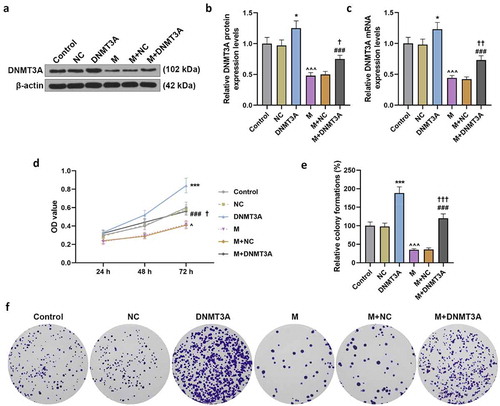
Figure 6. Overexpressed DNMT3A counteracted the inhibitory effect of miR-206 mimic on the migration and invasion of HemECs
The expressions of ECM-related molecules also showed consistent changes. Overexpressed DNMT3A up-regulated the expression of MMP-2 and MMP-9 yet down-regulated COL2A1 and Aggrecan, and it neutralized the inhibitory effect of miR-206 mimic on MMP-2 and MMP-9 expressions as well as the promotive effect of miR-206 mimic on COL2A1 and Aggrecan expressions (p < 0.01, ).
Figure 7. Overexpressed DNMT3A counteracted the regulatory effect of miR-206 mimic on ECM-related genes
3.4. The up-regulation of miR-206 inhibited the growth of transplanted tumors by down-regulating DNMT3A and promoting ECM accumulation.
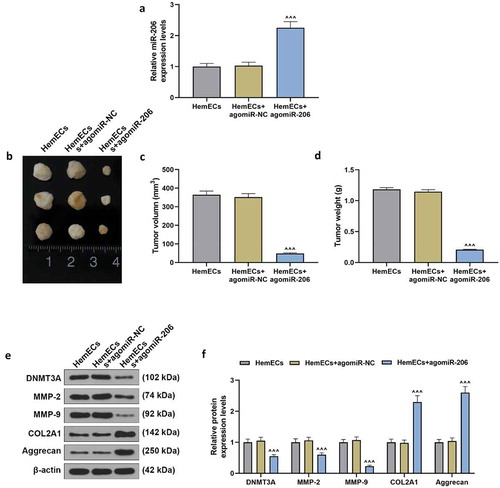
The transplanted tumor inoculation experiment verified the results of the cell experiment in vivo. AgomiR-206 significantly increased the expression of miR-206 in transplanted tumors, as compared with HemECs+agomiR-NC group (p < 0.001, ). The up-regulation of miR-206 greatly inhibited the increase of tumor volume and weight (p < 0.001, ). Consistently, agomiR-206 up-regulated the expressions of COL2A1 and Aggrecan genes, but down-regulated the expressions of DNMT3A, MMP-2 and MMP-9 (p < 0.001, ).
Figure 8. Up-regulation of miR-206 inhibited the growth of xenografts by down-regulating DNMT3A and promoting ECM accumulation
4. Discussion
IH is the most common benign tumor among infants and young children, with an incidence of about 4%-10% [Citation39]. Despite the self-limiting property, IH can still affect the vision, appearance and psychology of patients. In severe cases, it can cause disfigurement, airway obstruction, intracranial hemorrhage, and even death [Citation40]. Therefore, active treatment and effective strategies for IH management should be developed.
IH shows different histopathological manifestations at each stage of its natural course [Citation41,Citation42]. A solid mass structure is formed by massive proliferation of endothelial cells and an immature vascular cavity during proliferation stage. Later in the regression period, the vascular cavity continues to expand, the proliferation of endothelial cells slows down, and deposits of fibrous and adipose tissues appear in the intercellular substance. In the regression completion period, the endothelial cells in the tumor begin to degenerate, and the vascular cavity is replaced by a large amount of fibrous fat tissue, collagen and mesh organization. It is not difficult to see that the regression period and the regression completion period play an important role in the formation and accumulation of ECM. In our basic cell function experiments, the up-regulation of miR-206 significantly reduced the biological function and malignant development of HemECs. This was because miR-206 promoted ECM accumulation through silencing MMP-2/MMP-9 and up-regulating COL2A1/Aggrecan. Both MMP-2 and MMP-9 are important members of the MMP family, and their silencing is indicative of increased accumulation of ECM [Citation43]. COL2A1 encodes type II collagen α1 chain and further synthesizes type II collagen. Type II collagen and Aggrecan are the main components of ECM [Citation44]. Up-regulated COL2A1 and Aggrecan also suggest increased accumulation of ECM. Our findings are also supported by the experimental evidence of other researchers. For instance, Anita Rotter showed that in the proliferation phase of IH, vascular endothelial growth factor (VEGF) is upregulated, and the positive expression rates of MMP-2 and MMP-9 were significantly increased [Citation45]; Katarzyna Taran found that propranolol treatment could significantly reduce the high expressions of MMP-2 and MMP-9 in the tissues of IH patients, and believed that the mRNA expressions of MMP-2 and MMP-9 in tissues and serum could serve as a diagnostic criterion for IH [Citation46]. Thus, to investigate whether miR-206 can activate ECM accumulation has become the direction for our further research.
Studies have reported that miR-206 inhibits cancer cell proliferation and promotes apoptosis of a variety of cancer cells, such as lung cancer, colon cancer, and prostate cancer [Citation47–49]. MiRNAs can be combined with gene sequences in a complementary paired manner to inhibit gene translation and expression, thus affecting protein synthesis and eventually affecting disease occurrence and development [Citation50,Citation51]. Therefore, finding the target genes of miRNAs and clarifying their regulatory effects have important significance in understanding the mechanism of miRNA expression regulation. This study found that DNMT3A was the target gene of miR-206. Consistently, Wang et al [Citation52] also reported that DNMT3A is as a direct target of miR-206, and there is a negative feedback interaction between miR-206 and DNMT3A in laryngeal squamous cell carcinoma. DNMT3A, which is a member of the DNMT family and a synthetic DNA methyltransferase, functions to produce specific DNA methylation patterns. Abnormal DNA methylation can lead to developmental abnormalities and pathological changes [Citation53]. Increasing evidence has showed that cancer is related to DNA methylation. DNMT3A could induce aberrant CpG site methylation in human cancer cells [Citation54]. Methylation-mediated silencing of miR-133a-3p promotes breast cancer cell migration and stemness via miR-133a-3p/MAML1/DNMT3A positive feedback loop [Citation55]. MiR-708-5p suppressed NSCLC initiation, development, and stemness through interfering DNMT3A-dependent DNA methylation [Citation56]. These studies indicated that DNMT3A played a key role in the human cancer. Researchers have observed that a lower DNA methylation level in a variety of cancers is related to tumor occurrence and invasion [Citation57]. Our results showed that the expression of DNMT3A in hemangioma tissues of children with IH was significantly higher than that in normal tissues adjacent to the tumor. In in vitro experiments, we found for the first time that DNMT3A improved the activity and malignant metastasis ability of HemECs. Moreover, consistent with the results of Ma et al. and Liu et al [Citation58,Citation59], our exploration results on the molecular mechanism revealed that DNMT3A reduced the accumulation of ECM by regulating related genes.
Based on the above experimental results, we confirmed that the combination of miR-206 and DNMT3A inhibits the activity of DNMT3A, thereby activating ECM accumulation, and ultimately inhibiting the malignant development of HemECs to alleviate the symptoms of IH. The differential expression and important intervention effects of miR-206 and DNMT3A in IH suggest that miR-206 and DNMT3A may be potential molecular markers for the diagnosis and treatment of IH.
Availability of Data and Materials
The analyzed data sets generated during the study are available from the corresponding author on reasonable request.
Acknowledgments
Not applicable
Disclosure statement
No potential conflict of interest was reported by the author(s).
Additional information
Funding
References
- Castrén E, Salminen P, Vikkula M, et al. Inheritance patterns of infantile hemangioma. Pediatrics. 2016 Nov;138(5):e20161623. PubMed PMID: 27940781; eng.
- Ng M, Knuth C, Weisbrod C, et al. Propranolol therapy for problematic infantile hemangioma. Ann Plast Surg. 2016 Mar;76(3):306–310. PubMed PMID: 26010350; eng.
- Escarcega González CE, González Hernández A, Villalón CM, et al. β-Adrenoceptor blockade for infantile hemangioma therapy: do β3-Adrenoceptors play a role? J Vasc Res. 2018;55(3):159–168. PubMed PMID: 29936502; eng.
- Goss JA, Konczyk DJ, Alomari MH, et al. Propranolol Treatment of Vascular Anomalies Other Than Infantile Hemangioma. J Craniofac Surg. 2017 Nov;28(8):2001–2003. PubMed PMID: 28968329; eng.
- Janmohamed SR, Van Oosterhout M, De Laat PC, et al. Scoring the therapeutic effects of oral propranolol for infantile hemangioma: a prospective study comparing the Hemangioma Activity Score (HAS) with the Hemangioma Severity Scale (HSS). J Am Acad Dermatol. 2015 Aug;73(2):258–263. PubMed PMID: 26183969; eng.
- Byun JW, An HY, Yeom SD, et al. NDRG1 and FOXO1 regulate endothelial cell proliferation in infantile haemangioma. Exp Dermatol. 2018 Jun;27(6):690–693. PubMed PMID: 29569762; eng.
- Soliman YS, Khachemoune A. Infantile hemangiomas: our current understanding and treatment options. Dermatol Online J. 2018 Sep 15;24(9):13030. PubMed PMID: 30677824; eng.
- Park H, Park H, Chung HY, et al. Comparative analysis of the extracellular matrix composition in proliferating and involuted infantile hemangiomas. Arch Plast Surg. 2015 Sep;42(5):544–551. PubMed PMID: 26430624; PubMed Central PMCID: PMCPMC4579164. eng.
- Whelan MC, Senger DR. Collagen I initiates endothelial cell morphogenesis by inducing actin polymerization through suppression of cyclic AMP and protein kinase A. J Biol Chem. 2003 Jan 3;278(1):327–334. PubMed PMID: 12399469; eng.
- Liu Y, Senger DR. Matrix-specific activation of Src and Rho initiates capillary morphogenesis of endothelial cells. Faseb J. 2004 Mar;18(3):457–468. . PubMed PMID: 15003991; eng
- Davis GE, Bayless KJ. An integrin and Rho GTPase-dependent pinocytic vacuole mechanism controls capillary lumen formation in collagen and fibrin matrices. Microcirculation. 2003 Jan;10(1):27–44; (New York, NY: 1994). PubMed PMID: 12610662; eng. .
- Senger DR. Molecular framework for angiogenesis: a complex web of interactions between extravasated plasma proteins and endothelial cell proteins induced by angiogenic cytokines. Am J Pathol. 1996 Jul;149(1):1–7. PubMed PMID: 8686733; PubMed Central PMCID: PMCPMC1865245. eng
- Senger DR, Perruzzi CA, Streit M, et al. The alpha(1)beta(1) and alpha(2)beta(1) integrins provide critical support for vascular endothelial growth factor signaling, endothelial cell migration, and tumor angiogenesis. Am J Pathol. 2002 Jan;160(1):195–204. PubMed PMID: 11786413; PubMed Central PMCID: PMCPMC1867136. eng.
- Senger DR, Claffey KP, Benes JE, et al. Angiogenesis promoted by vascular endothelial growth factor: regulation through alpha1beta1 and alpha2beta1 integrins. Proc Natl Acad Sci U S A. 1997 Dec 9;94(25):13612–13617. PubMed PMID: 9391074; PubMed Central PMCID: PMCPMC28354. eng.
- Komiya E, Sato H, Watanabe N, et al. Angiomodulin, a marker of cancer vasculature, is upregulated by vascular endothelial growth factor and increases vascular permeability as a ligand of integrin αvβ3. Cancer Med. 2014 Jun;3(3):537–549. PubMed PMID: 24737780; PubMed Central PMCID: PMCPMC4101744. eng.
- Bayless KJ, Salazar R, Davis GE. RGD-dependent vacuolation and lumen formation observed during endothelial cell morphogenesis in three-dimensional fibrin matrices involves the alpha(v)beta(3) and alpha(5)beta(1) integrins. Am J Pathol. 2000 May;156(5):1673–1683. . PubMed PMID: 10793078; PubMed Central PMCID: PMCPMC1876924. eng
- Bonnans C, Chou J, Werb Z. Remodelling the extracellular matrix in development and disease. Nat Rev Mol Cell Biol. 2014 Dec;15(12):786–801. . PubMed PMID: 25415508; PubMed Central PMCID: PMCPMC4316204. eng
- Zhu L, Xie J, Liu Z, et al. Pigment epithelium-derived factor/vascular endothelial growth factor ratio plays a crucial role in the spontaneous regression of infant hemangioma and in the therapeutic effect of propranolol. Cancer Sci. 2018 Jun;109(6):1981–1994. PubMed PMID: 29664206; PubMed Central PMCID: PMCPMC5989849. eng.
- Khan ZA, Boscolo E, Picard A, et al. Multipotential stem cells recapitulate human infantile hemangioma in immunodeficient mice. J Clin Invest. 2008 Jul;118(7):2592–2599. PubMed PMID: 18535669; PubMed Central PMCID: PMCPMC2413184. eng.
- Tan ST, Velickovic M, Ruger BM, et al. Cellular and extracellular markers of hemangioma. Plast Reconstr Surg. 2000 Sep;106(3):529–538. PubMed PMID: 10987458; eng.
- Primo L, Seano G, Roca C, et al. Increased expression of alpha6 integrin in endothelial cells unveils a proangiogenic role for basement membrane. Cancer Res. 2010 Jul 15;70(14):5759–5769. PubMed PMID: 20570893; eng.
- Bertoni N, Pereira LM, Severino FE, et al. Integrative meta-analysis identifies microRNA-regulated networks in infantile hemangioma. BMC Med Genet. 2016 Jan;15(17):4. PubMed PMID: 26772808; PubMed Central PMCID: PMCPMC4715339. eng.
- Mishra S, Yadav T, Rani V. Exploring miRNA based approaches in cancer diagnostics and therapeutics. Crit Rev Oncol Hematol. 2016 Feb;98:12–23. PubMed PMID: 26481951; eng.
- Sandiford OA, Moore CA, Du J, et al. Human aging and cancer: role of miRNA in tumor microenvironment. Adv Exp Med Biol. 2018;1056:137–152. PubMed PMID: 29754179; eng.
- Huang J, Jiang D, Zhao S, et al. Propranolol suppresses infantile hemangioma cell proliferation and promotes apoptosis by upregulating miR-125b expression. Anticancer Drugs. 2019 Jun;30(5):501–507. PubMed PMID: 30986805; eng.
- Liu Z, Kang Z, Dai Y, et al. Long noncoding RNA LINC00342 promotes growth of infantile hemangioma by sponging miR-3619-5p from HDGF. Am J Physiol Heart Circ Physiol. 2019 Oct 1;317(4):H830–h839. PubMed PMID: 31469292; eng.
- Yang L, Dai J, Li F, et al. The expression and function of miR-424 in infantile skin hemangioma and its mechanism. Sci Rep. 2017 Sep 19;7(1):11846. PubMed PMID: 28928430; PubMed Central PMCID: PMCPMC5605629. eng.
- Liu C, Zhao Z, Ji Z, et al. MiR-187-3p Enhances Propranolol Sensitivity of Hemangioma Stem Cells. Cell Struct Funct. 2019 Mar 20;44(1):41–50. PubMed PMID: 30713220; eng.
- Li D, Li P, Guo Z, et al. Downregulation of miR-382 by propranolol inhibits the progression of infantile hemangioma via the PTEN-mediated AKT/mTOR pathway. Int J Mol Med. 2017 Mar;39(3):757–763. PubMed PMID: 28112362; eng.
- Lacoste B, Raymond VA, Cassim S, et al. Highly tumorigenic hepatocellular carcinoma cell line with cancer stem cell-like properties. PloS One. 2017;12(2):e0171215. PubMed PMID: 28152020; PubMed Central PMCID: PMCPMC5289561 Chair at the Université de Montréal is a philanthropic chair administered by Université de Montréal that was initially founded through a joint initiative of the Canadian Liver Foundation and Novartis to help promote research in the field of liver disease. There are no patents, products in development or marketed products to declare. This does not alter our adherence to PLOS ONE policies on sharing data and materials. eng.
- Cassim S, Raymond VA, Dehbidi-Assadzadeh L, et al. Metabolic reprogramming enables hepatocarcinoma cells to efficiently adapt and survive to a nutrient-restricted microenvironment. Cell Cycle (Georgetown, Tex). 2018;17(7):903–916. PubMed PMID: 29633904; PubMed Central PMCID: PMCPMC6056217. eng.
- Cassim S, Raymond VA, Lacoste B, et al. Metabolite profiling identifies a signature of tumorigenicity in hepatocellular carcinoma. Oncotarget. 2018 Jun 1;9(42):26868–26883. PubMed PMID: 29928490; PubMed Central PMCID: PMCPMC6003570. eng.
- Cassim S, Vučetić M, Ždralević M, et al. Warburg and beyond: the power of mitochondrial metabolism to collaborate or replace fermentative glycolysis in cancer. Cancers (Basel). 2020 Apr 30;12(5). DOI:10.3390/cancers12051119. PubMed PMID: 32365833; PubMed Central PMCID: PMCPMC7281550. eng.
- Wu H, Tao J, Li X, et al. MicroRNA-206 prevents the pathogenesis of hepatocellular carcinoma by modulating expression of met proto-oncogene and cyclin-dependent kinase 6 in mice. Hepatology. 2017 Dec;666:1952–1967. (Baltimore, Md). . PubMed PMID: 28714063; PubMed Central PMCID: PMCPMC5696004. eng.
- Cai Y, Li H, Zhang Y. Downregulation of microRNA-206 suppresses clear cell renal carcinoma proliferation and invasion by targeting vascular endothelial growth factor A. Oncol Rep. 2016 Mar;35(3):1778–1786. . PubMed PMID: 26718123; eng
- Sun Y, An N, Li J, et al. miRNA-206 regulates human pulmonary microvascular endothelial cell apoptosis via targeting in chronic obstructive pulmonary disease. J Cell Biochem. 2019 Apr;120(4):6223–6236. PubMed PMID: 30335896; eng.
- Wang S, Ren L, Shen G, et al. The knockdown of MALAT1 inhibits the proliferation, invasion and migration of hemangioma endothelial cells by regulating MiR-206/VEGFA axis. Mol Cell Probes. 2020 Jun;51:101540. PubMed PMID: 32084582; eng.
- Poojari S, Alabi OJ, Okubara PA, et al. SYBR(®) Green-based real-time quantitative reverse-transcription PCR for detection and discrimination of grapevine viruses. J Virol Methods. 2016 Sep;235:112–118. PubMed PMID: 27246908; eng.
- Wessman LL, Andersen LK, Davis MDP. Incidence of diseases primarily affecting the skin by age group: population-based epidemiologic study in Olmsted County, Minnesota, and comparison with age-specific incidence rates worldwide. Int J Dermatol. 2018 Sep;57(9):1021–1034. . PubMed PMID: 29377079; PubMed Central PMCID: PMCPMC6064677. eng
- Goss JA, Greene AK. Congenital Vascular Tumors. Otolaryngol Clin North Am. 2018 Feb;51(1):89–97. . PubMed PMID: 29217070; eng
- North PE. Pediatric vascular tumors and malformations. Surg Pathol Clin. 2010 Sep 3;3:455–494. PubMed PMID: 26839221; eng.
- Peng SH, Yang KY, Chen SY, et al. [Research progresses in the pathogenesis, diagnosis and treatment of infantile hemangioma with PHACE syndrome]. Zhongguo Dang Dai Er Ke Za Zhi. 2017 Dec;19(12):1291–1296. PubMed PMID: 29237532; PubMed Central PMCID: PMCPMC7389804. chi.
- Korompelis P, Piperi C, Adamopoulos C, et al. Expression of vascular endothelial factor-A, gelatinases (MMP-2, MMP-9) and TIMP-1 in uterine leiomyomas. Clin Chem Lab Med. 2015 Aug;53(9):1415–1424. PubMed PMID: 25470608; eng.
- Luo Y, Sinkeviciute D, He Y, et al. The minor collagens in articular cartilage. Protein Cell. 2017 Aug;8(8):560–572. PubMed PMID: 28213717; PubMed Central PMCID: PMCPMC5546929. eng.
- Rotter A, De Oliveira ZNP. Infantile hemangioma: pathogenesis and mechanisms of action of propranolol. JDDG. 2017 Dec;15(12):1185–1190. . PubMed PMID: 29193649; eng
- Taran K, Wnęk A, Kobos J, et al. Tissue and serum mRNA profile of MMPs-2/9 as a potential novel biomarker for the most individual approach in infantile hemangiomas and cancer disease. Immunobiology. 2017 Nov;222(11):1035–1042. PubMed PMID: 28601470; eng.
- PubMed PMID: 29542173; eng, Wang Y, Xu H, Si L, et al. MiR-206 inhibits proliferation and migration of prostate cancer cells by targeting CXCL11. Prostate. 2018 May;78(7):479–490. .
- Meng X, Fu R. miR-206 regulates 5-FU resistance by targeting Bcl-2 in colon cancer cells. Onco Targets Ther. 2018;11:1757–1765. PubMed PMID: 29636622; PubMed Central PMCID: PMCPMC5881530. eng.
- Jiao D, Chen J, Li Y, et al. miR-1-3p and miR-206 sensitizes HGF-induced gefitinib-resistant human lung cancer cells through inhibition of c-Met signalling and EMT. J Cell Mol Med. 2018 Jul;22(7):3526–3536. PubMed PMID: 29664235; PubMed Central PMCID: PMCPMC6010770. eng.
- Correia De Sousa M, Gjorgjieva M, Dolicka D, et al. Deciphering miRNAs’ Action through miRNA Editing. Int J Mol Sci. 2019 Dec 11;20(24). DOI:10.3390/ijms20246249. PubMed PMID: 31835747; PubMed Central PMCID: PMCPMC6941098. eng.
- Chen L, Heikkinen L, Wang C, et al. Trends in the development of miRNA bioinformatics tools. Brief Bioinform. 2019 Sep 27;20(5):1836–1852. PubMed PMID: 29982332; PubMed Central PMCID: PMCPMC7414524. eng.
- Wang X, Yu B, Jin Q, et al. Regulation of laryngeal squamous cell cancer progression by the lncRNA RP11-159K7.2/miR-206/DNMT3A axis. J Cell Mol Med. 2020 Jun;24(12):6781–6795. PubMed PMID: 32363688; PubMed Central PMCID: PMCPMC7299727. eng.
- Ferrari L, Carugno M, Bollati V. Particulate matter exposure shapes DNA methylation through the lifespan. Clin Epigenetics. 2019 Aug 30;11(1):129. PubMed PMID: 31470889; PubMed Central PMCID: PMCPMC6717322. eng.
- Jones PA, Baylin SB. The epigenomics of cancer. Cell. 2007 Feb 23;128(4):683–692. PubMed PMID: 17320506; PubMed Central PMCID: PMCPMC3894624. eng.
- Shi W, Tang T, Li X, et al. Methylation-mediated silencing of miR-133a-3p promotes breast cancer cell migration and stemness via miR-133a-3p/MAML1/DNMT3A positive feedback loop. J Exp Clin Cancer Res. 2019 Oct 28;38(1):429. PubMed PMID: 31660998; PubMed Central PMCID: PMCPMC6819615. eng.
- Liu T, Wu X, Chen T, et al. Downregulation of DNMT3A by miR-708-5p inhibits lung cancer stem cell-like phenotypes through repressing Wnt/β-catenin signaling. Clin Cancer Res off J Am Assoc Cancer Res. 2018 Apr 1;24(7):1748–1760. PubMed PMID: 28972040; eng.
- Koch A, Joosten SC, Feng Z, et al. Analysis of DNA methylation in cancer: location revisited. Nat Rev Clin Oncol. 2018 Jul;15(7):459–466. PubMed PMID: 29666440; eng.
- Ma F, Li G, Yu Y, et al. MiR-33b-3p promotes chondrocyte proliferation and inhibits chondrocyte apoptosis and cartilage ECM degradation by targeting DNMT3A in osteoarthritis. Biochem Biophys Res Commun. 2019 Nov 5;519(2):430–437. PubMed PMID: 31522815; eng.
- Liu Y, Liu K, Tang C, et al. Long non-coding RNA XIST contributes to osteoarthritis progression via miR-149-5p/DNMT3A axis. Biomed Pharmacother. 2020 Aug;128:110349. PubMed PMID: 32521454; eng.