
ABSTRACT
Genetically encoded pH-sensors are the promising instrument for intracellular pH (pHi) registration. In tumor tissue the reversed pH gradient is known to be the important hallmark of cancer and regulator of tumor response on chemotherapy. However the effect of chemotherapeutic drugs on the pHi of tumor cells is largely unknown. Here we using genetically encoded ratiometric pH-sensor SypHer2 were able to monitor pHi in vitro in cell monolayer and tumor spheroids and in vivo in tumor xenografts. In tumor cell monolayer different pHi dynamic was revealed in the dying cell and division-arrested surviving cells. The treatment effect of taxol varied in monolayer and tumor spheroids and pHi changes were able to reflect these difference. The tend to pHi decrease in respect to taxol in vivo matched with results obtained for the cell monolayer. Also in both cases the cell cycle-arrest was the main treatment effect in contrast to tumor spheroid, where the cell death was the primary result. These findings elucidate the significance of pHi in the mechanisms of taxol action on cervical cancer cells and will be valuable for development of new approaches for cancer treatment.
Introduction
Taxol (generic name paclitaxel) is a member of the taxane family of anticancer drugs that is widely used for the treatment of ovarian, breast, and lung cancer, as well as for Kaposi’s sarcoma and, off-label, to treat gastroesophageal, endometrial, cervical, prostate, and head and neck cancers, in addition to sarcomas, lymphomas, and leukemias [Citation1,Citation2].
The antimitotic activity of paclitaxel, causing microtubule stabilization followed by cell cycle arrest, is considered to be the main mechanism of action [Citation1,Citation3]. However, several other mechanisms are also involved in its anticancer effects. For example, it has been demonstrated that paclitaxel can kill cancer cells through Bcl-2 phosphorylation [Citation4,Citation5], mitochondrial calcium efflux and influx [Citation6,Citation7], and the modulation of miRNA expression profiles [Citation8,Citation9]. Furthermore, modulation of immune responses via the regulation of chemokines, cytokines, or immune cells has also been documented as a result of paclitaxel treatment [Citation10,Citation11].
It is known that pH can influence the “physiological” behavior of cancer cells and affect the cytotoxicity of anticancer drugs. Dysregulated pH with increased cytosolic (pHi, ˜7.3–7.6 vs ˜7.2), and decreased extracellular values (pHe, ˜6.8–7.0 vs ˜7.4) is a hallmark of cancer [Citation12]. Numerous studies suggest that modification of the pH in a tumor, specifically lowering pHi, can improve the efficacy of chemotherapy [Citation13–15]. There are several papers reporting that cytosol acidification, achieved by suppressing the expression of ion transporters or by using selective proton pump inhibitors, re-sensitizes chemoresistant cancer cell lines [Citation16,Citation17] (or xenografts [Citation18,Citation19] to chemotherapeutic treatment.
At the same time, chemotherapeutic drugs, themselves, can modify pHi in cancer cells. For example, such intracellular acidification has been demonstrated for vincristine sulfate on HeLa cells and tumor xenografts, for cisplatin on HT29 cells [Citation20,Citation21],, for the antiepileptic drug Topiramate that has anti-cancer action and for the effects of the new dichloroacetate-based drugs on glioblastomas [Citation22,Citation23]. However, definitive data demonstrating the impact of Taxol on pHi are currently lacking. There is only one report that it downregulates the activity of the Na+/H+ exchanger NHE1, a key regulator of pHi in cancer cells, which is crucial for the induction of apoptosis [Citation24].
The aim of the present study was to investigate pHi changes in cancer cell monolayers, 3D tumor spheroids and tumor xenografts induced with Taxol and to correlate this with their responsiveness to treatment. To monitor pHi in living cancer cells and tissues we used the genetically encoded fluorescent ratiometric (dual-excitation) sensor, SypHer2 [Citation25]. Owing to their stable expression in cells, pH-sensitive fluorescent proteins enable both the quantitative spatial and temporal imaging of pHi [Citation26,Citation27]. The applicability of SypHer2 for mapping pHi in the physiological range has been previously demonstrated in neuronal cell cultures [Citation25], monolayer and spheroid cultures of cancer cells and tumor xenografts [Citation28]. Our study represents the first time that the pHi dynamics have been traced in individual cells showing different responses following Taxol treatment. The changes in pHi found in monolayer cells were also identified in spheroids and mouse tumors in vivo. The therapeutic effects of Taxol were confirmed using standard assays.
Materials and methods
pHi-sensor SypHer2
The study used the fluorescent, genetically encoded sensor SypHer2 that is based on the circularly permuted yellow fluorescent protein YFP (cpYFP) [Citation25]. It has a ratiometric (dual-excitation) readout that makes the measurements independent of sensor concentration and cytoplasmic volume changes. SypHer2 has two excitation maxima – at 420 nm and 500 nm, and an emission maximum at 516 nm. The ratio of fluorescence intensities at the two wavelengths I500/I420 increases with increasing pHi.
Cell culture
A HeLa Kyoto (human cervical carcinoma) cell line, stably expressing the genetically encoded pHi-sensor SypHer2 (HeLa-SypHer2) was used in the study [Citation29]. The cells were maintained in DMEM containing 100 μg/ml penicillin, 100 μg/ml streptomycin sulfate and 10% fetal bovine serum (FBS) at 37°C in a humidified atmosphere with 5% CO2 and 80% relative humidity, while being passaged three times a week.
Tumor spheroids were generated from the HeLa cells in 96-well ultra-low attachment round bottom plates. The cells were seeded at a concentration of 150 cells in 200 μL of complete medium per well and incubated at 37°C, 5% CO2 and 80% relative humidity. The medium was changed every three days. Tumor spheroid formation and growth were monitored using transmitted light microscopy.
The fluorescence microscopy of the spheroids was performed in glass-bottom dishes in DMEM life medium without phenol red. For this purpose, the spheroids were transferred onto the dishes and incubated for 30–60 min for their attachment.
Proliferation and viability assays
To assess their proliferative activity, the cells were seeded into 12-well plates at 1 × 10⁵ cells in 1.5 mL DMEM per well. After 24 hours, Taxol was added, and the cells were incubated with the drug for 6, 24 or 48 hours. Then the culture medium from each well was collected separately, the cells were harvested with 0.25% trypsin in EDTA, added to the medium collected from the wells (to avoid the loss of any floating dead cells), and single-cell suspensions were prepared. To access cell viability, 10 μL of the cell suspension were mixed with 10 μL of trypan blue dye. The total number of cells in the cell suspension and the number of dead cells (trypan blue stained) were calculated using a TC20 automated cell counter (Bio-Rad, USA).
The data are represented as the number of viable cells, while the dead cells were expressed as a percentage of the total number of cells.
For the assessment of cell viability in the tumor spheroids standard double staining with calcein and propidium iodide was performed according to the manufacture’s protocol (double life/dead kit, Sigma). For these experiments HeLa cells without sensor SypHer2 were used. In experiments for pHi monitoring, cell viability at the end point was assessed with propidium iodide only, as calcein dye and sensor SypHer2 have the same excitation wavelength.
Tumor xenografts
All animal protocols were approved by the Ethical Committee of the Privolzhsky Research Medical University (Russia). All methods were carried out in accordance with relevant guidelines and regulations. The experiments were performed on 16 female athymic nude mice of body weight 20–22 g, purchased from the Lobachevsky State University (Russia). The HeLa-SypHer2 cells (2 × 10⁶ in 200 μL PBS) were inoculated subcutaneously into the flank.
Before the imaging procedures, the mice were anesthetized intramuscularly with a mixture of Zoletil (40 mg/kg, 50 μL, Virbac SA, France) and 2% Rometar (10 mg/kg, 10 μL, Spofa, Czech Republic) and a skin flap over the tumor was surgically opened to reduce signal attenuation.
Immediately after imaging the animals were sacrificed by cervical dislocation and the tumors were excised for histopathological examination.
Chemotherapy
For the in vitro treatment, Taxol (Bristol-Myers Squibb, USA) was used at a dosage of 3.2 ± 0.1 nM corresponding to the half-inhibitory concentration, IC50, as determined by the MTT-assay (Figure S1).
In vivo treatment started on Day 3 after tumor inoculation. Eight mice were treated with Taxol (10 mg/kg body weight, in 100 μL PBS, intraperitoneally) three times a week; 7–8 doses in total. Eight untreated animals received 100 μL PBS intraperitoneally on the corresponding days. The tumor size was measured using a caliper three times a week, and the volume was calculated as: V = a * b * b/2, where a – length of tumor, b – width of tumor.
pHi imaging in vitro and in vivo
pHi was measured using SypHer2, as previously described [Citation28].
For registration of the fluorescence signal, the HeLa-SypHer2 cells were plated in glass-bottom grid-50 dishes (Ibidi, Germany) in complete DMEM media without phenol red (Life Technologies, USA). Taxol was added to the dish 24 hours after cell seeding. Dynamic pHi measurements in the cell monolayers were carried out in the same cells in 5–7 randomly selected fields of view.
The fluorescence microscopy images were obtained using an LSM 880 (Carl Zeiss, Germany) laser scanning microscope. An oil immersion objective, С-Apochromat 40x/1.2 NA W Korr, was used for image acquisition. A diode laser with a wavelength of 405 nm (I405) and an argon laser line of 488 nm (I488) were used to excite the SypHer2 fluorescence. Emissions were detected in the range: 500–550 nm.
In vivo imaging of pHi in the tumor xenografts was performed using an IVIS Spectrum system (Caliper Life Sciences, USA). Fluorescence was excited at two wavelengths: 430 ± 15 nm (I430) and 500 ± 15 nm (I500), and detected using a 530–550 nm band filter. The in vivo imaging was performed on Days 17 or 19 after tumor inoculation. Immediately after imaging on the IVIS Spectrum each tumor was examined in vivo with the LSM 880 microscope, using the same settings as for the cell monolayers.
The fluorescence images were processed in ImageJ 1.39p software (NIH, USA). The background signal, taken from an empty region of the image, was subtracted from the measurements, and then the ratios of fluorescence intensities (I488/I405 in vivo or I500/I420 in vitro) were calculated. To convert the fluorescence ratio I500/I420 to pH units, calibration of the sensor was performed using MOPS buffers and the ionophore, nigericin, as described in Ref [Citation28]. (Figure S2).
Histopathology
For histological examination, the tumors were surgically removed and fixed in 10% neutral-buffered formalin, dehydrated and embedded in paraffin in accordance with the standard protocol. 5-μm thick paraffin sections were stained with hematoxylin and eosin (H&E) and examined using a Leica DM2500 microscope (Leica, Japan).
Statistical analysis
The mean values (M) and standard deviations (SD) or standard error of the mean (SEM) were calculated to express the data.
Student’s t-tests and one-way ANOVA with Bonferroni post-hoc tests, where appropriate, were used for data comparison, with p ≤ 0.05 being considered statistically significant. The Pearson coefficient (r) was used to measure any correlations between pHi and proliferation.
In the in vivo study, the Mann-Whitney test for small groups was applied.
Results
Cell viability and proliferation under Taxol exposure
Treatment of HeLa-SypHer2 cells with Taxol inhibited cell proliferation in a time-dependent manner (). At 6-hours exposure, a slight but statistically significant decrease (2x10⁵ vs 3x10⁵, p = 0.017) in the proliferation rate was observed. Upon further incubation with Taxol over a period of 48 hours, the total number of viable cells in the plates did not exceed ~6x10⁵ cells, while in the control plate it was ~106 cells (p = 0.017).
Figure 1. Effects of Taxol on the proliferative rate and viability of HeLa-SypHer2 cells. (a) The number of viable cells. (b) The number of dead cells.* – statistically significant difference from the untreated control, р ≤ 0.05
The percentage of dead cells in the control was ~5% in the time-period 6–48 hours of cultivation. In the treated plates it increased to ~10% starting from 6 hours (not significant).
These results indicate that the main treatment effect of Taxol on HeLa-SypHer2 cells, when used at IC50 concentration, is through cell cycle arrest but without subsequent cell death.
Dynamics of pHi in Taxol-treated cells in a monolayer
The pHi in untreated HeLa-SypHer2 cells was 2.29 ± 0.10 pH units and did not change during the whole period of cultivation (48 h). Treatment with Taxol induced significant pHi changes within a short period after adding the drug as well as at the later time-points. It should be mentioned that the measurements of pHi were performed only for viable cells (typical morphology, PI-negative), because in dead cells (round shape, PI-positive) structural modifications of the protein sensor could not be excluded. After 45 min incubation with Taxol an acute alkalization of the cytoplasm by ~0.2 pH units (p = 0.001) was observed in all cells irrespective of the response. Tracking pHi in individual cells showed that, after the early spike of cytosol alkalization, multiple pHi fluctuations occurred in the viable, division-arrested cells in the course of treatment. This behavior points to their greater ability to stabilize pHi. However, acidification was unavoidable, and the pHi was below the baseline level after 4–5 hours incubation or more. In the cells that subsequently died, the pHi was less variable and remained at the baseline level or slightly above it. In the overall cell population, a statistically lower pHi, compared with the control, was registered at the 24 hour time-point. The most acidic pHi was reached by 48 hours, 6.95 ± 0.16 vs 7.28 ± 0.10 (p = 0.000) (). Separate sets of experiments were performed for the pHi monitoring over 48 hours, and for the pHi monitoring until 24 hours with subsequent PI-staining (Figure S3).
Figure 2. pHi in HeLa-SypHer2 cells treated with Taxol. (a) Representative time-course microscopic images of pHi in the same cells. Time after adding the drug is indicated on each image. Bar is 50 μm (applicable to all images). Dying cells 2 and 6 indicated on the images with arrows. (b) Quantification of pHi in Taxol-treated and control cells. (c) Correlation between pHi and cell proliferation under Taxol exposure. (d) Dynamics of pHi in individual dying cells. (e) Dynamics of pHi in individual viable cells with inhibited proliferation. Mean ± SD, n = 50. *, p ≤ 0.05
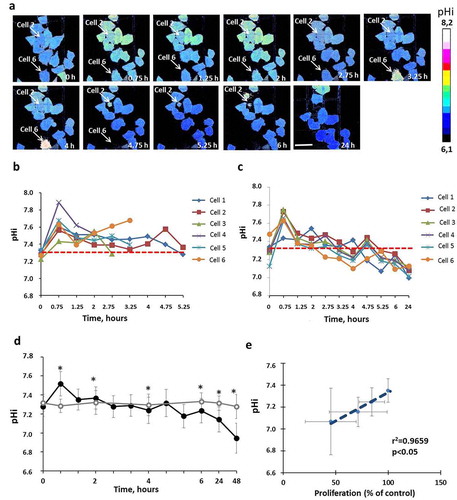
A strong correlation of pHi with cellular proliferation under Taxol exposure was found (R = 0.9659, ). Those cells with more acidic pHi levels had lower proliferative rates, which confirms the importance of pHi in controlling the cells’ proliferative capacity [Citation30] ().
Effects of Taxol on spheroid growth and cell viability
Taxol, when used at the IC50 concentration of 3.2 µM, induced cell death in HeLa tumor spheroids. Staining of spheroids with PI showed an increase in the number of dead cells by 2.9-fold after 24-hours of incubation with the drug, compared with the untreated control ().
Figure 3. Taxol influence on tumor spheroids. (a) representative image of spheroids in transmitted light and the corresponding fluorescence images of double live/dead staining with calcein (green color, live cells) and PI (red color, dead cells). (b) growth of spheroids under Taxol exposure (c) cell viability under Taxol exposure Bar is 200 µm * – statistically significant difference from control at the same time point
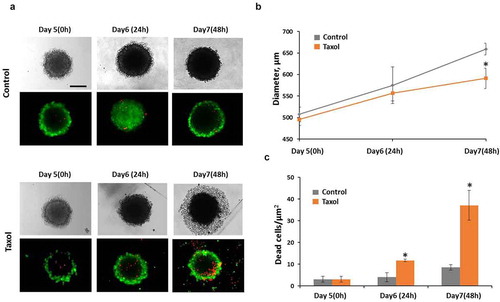
Although the size of the treated spheroids remained unchanged compared with the control over the 48 hours after drug exposure, their structure was significantly altered. The border of such spheroids lost its integrity and individual dead cells started to detach from its surface. By 48 hours after drug exposure a broad zone of dead cells surrounding each spheroid core was visible in transmitted light.
Dynamics of pHi in Taxol-treated tumor spheroids
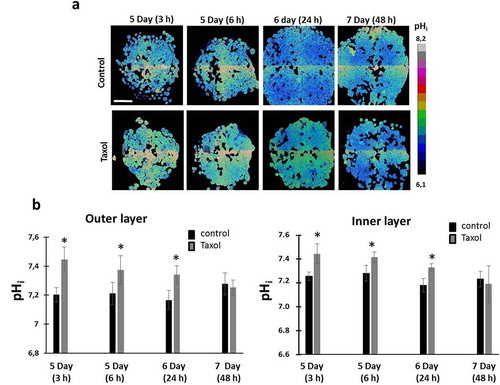
Since tumor spheroids represent heterogeneous 3D structures in terms of pHi, in which the cells of the outer proliferative layer are known to have a more alkaline pHi than the quiescent cells inside [Citation31] pHi measurements upon treatment with Taxol were performed separately for the inner and outer layers of the spheroids. We found that in tumor spheroids exposed to Taxol, cells in the outer and inner zones displayed similar pHi alterations (). Treatment of the spheroids resulted in a marked alkalization of the cellular cytoplasm by 0.2 pH units at an early time-point (3 hours) followed by a gradual decrease of pHi down to the baseline values (~ 7.2 pH units) by 48 hours. Keeping in mind that cell death was the main therapeutic effect of Taxol on tumor spheroids at the dosage used, the observed changes in pHi are quite similar to those in the dying cell sub-population seen in our monolayers.
Figure 4. pHi in HeLa-SypHer2 tumor spheroids exposed to paclitaxel. (a) pHi map in treated and untreated spheroids. (b) Quantification of Taxol-induced pHi changes in outer and inner layers of the spheroids. Mean ± SD, n = 50. Bar is 200 μm (applicable to all images)
Tumor response to chemotherapy with Taxol
In the Taxol-treated group of mice, 2 of the 8 tumors underwent total regression by Day 15. The other 6 tumors showed inhibition of their growth. A statistically significant difference of the tumor volumes between the treated and untreated groups (p = 0.0002) was detected by Day 14 of growth ().
Figure 5. Effects of Taxol on HeLa-SypHer2 tumors in mice. (a) Tumor volume dynamics in response to Taxol. Mice of the treated group (○) were administered i.p. with 10 mg/kg Taxol, starting from Day 3 (6 doses for 2 weeks in total). Control mice (●) received PBS on the same days. Mean ± SEM, n = 8 tumors. Tumor volumes from individual mice were normalized to the values measured on Day 3. *, statistically significant difference from control tumors, p ≤ 0.05. (b) Post-treatment histopathology of HeLa-SypHer2 tumors. H&E-staining. Enlarged regions are indicated by the yellow squares on the lower-magnification panel (210 × 280 μm, original magnification ×20). Higher-magnification images (60 × 80 μm, original magnification ×40) are shown on the lower panel. Bar is 100 μm for the lower panel and 200 μm for the upper panel
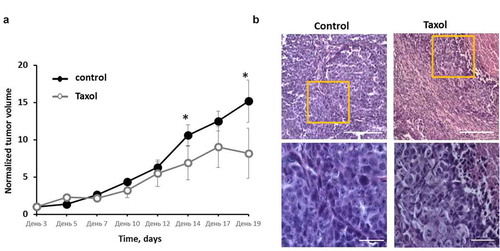
Histologically, the untreated tumors were formed of patterns of densely packed large polymorphic tumor cells with small intercellular spaces, surrounded by thin layers of connective tissue (). The dispersed chromatin could clearly be seen in the large, round or oval nuclei of the cells. The basophilic cytoplasm formed a thin ring around each nucleus. The mitotic activity was high. The central part of the tumor nodules underwent spontaneous necrosis. Tumors in the treated group displayed different degrees of dystrophic cellular alterations in the viable tissue, such as cytoplasmic swelling, the loss of cell membrane integrity, and nucleic polymorphism with predominately small nuclei with condensed chromatin. In addition, extensive necrotic fields and the replacement of tumor tissue with connective tissue fibers could be observed. The mitotic rate in the affected tumors was low.
pHi alterations in tumors in response to Taxol
At the macro-level, a high degree of heterogeneity of the SypHer2 signal was observed in vivo in the HeLa tumors, both treated and untreated, with the a highest I500/I420 ratio (more alkaline pHi) being detected in necrotic areas, which is consistent with our previous data [Citation28]. The analysis of pHi was performed only in the zones of viable tumor tissue.
Assessment of pHi in HeLa-SypHer2 tumors on Days 17 or 19 after tumor challenge revealed a tendency to pHi acidification in the tumors that had responded to Taxol (). The average I500/I420 ratio measured at the level of a whole tumor was 1.39 ± 0.15 in the treated tumors and 1.99 ± 0.31 in the control (p = 0.08).
Figure 6. In vivo pHi mapping in HeLa-SypHer2 tumors after treatment with Taxol. (a) Fluorescence images obtained with excitation at 430 nm and 500 nm (detection at 540 nm). (b) Representative images of SypHer2 ratio (I500/I430) in the control and treated tumors. (c) Representative microscopic images of SypHer2 ratio (I500/I430) from the control and treated tumors in vivo. Bar is 50 μm. (d) Quantitative analysis of the SypHer2 ratio in the tumors. Mean ± SEM, n = 3 tumors
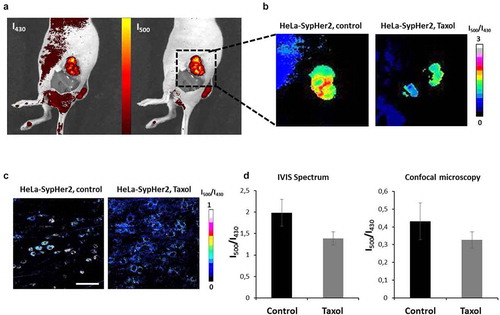
The changes in pHi observed at the macro-level were confirmed by confocal microscopy in vivo (). The I500/I430 ratio was lower in the treated tumors as compared with the untreated controls (0.32 ± 0.05 vs 0.43 ± 0.10, though this was statistically non-significant).
Therefore, the results of the in vivo investigation showed a shift in pHi toward a more acidic environment in the tumors responding to therapy. This agrees with the in vitro study on the monolayer cells and indicates that cytosolic acidification can be a general response to Taxol, associated with decreased cell proliferation.
Discussion
In the present study the pHi changes in response to Taxol were investigated in vitro in individual cancer HeLa cells in monolayer, in tumor spheroids and in vivo in mouse tumor xenografts with the use of a genetically encoded fluorescent pH-sensor and fluorescence bioimaging techniques. Our results, are the first illustration of a correlation between pHi and the therapeutic effects of Taxol in vitro and in vivo. Essentially, inhibition of cell proliferation in both cell culture and in tumors growing in mice was accompanied by the acidification of the cytoplasm of the cancer cells, whereas alkalization preceded cell death.
The links between pH, cellular uptake of Taxol and its cytotoxic activity have been previously investigated in a number of works [Citation18,Citation24,Citation32–34], however, the findings are quite controversial. Several studies have suggested that acidification of the intracellular environment increases the cytotoxicity of Taxol. For example, Reshkin et al. showed that the exposure of cultured melanoma cells to Taxol resulted in NHE1 inactivation with a subsequent increase of apoptosis rate [Citation24]. Amith et al. demonstrated that knockout of NHE1 potentiated the effects of Taxol on breast cancer cells through their decreased survival, migration and invasiveness [Citation18]. In the work by Hou et al. an increased efficacy was reported for the combined treatment of breast cancer with Taxol and an inhibitor of the monocarboxylate transporter (MCT1) in vitro and in vivo compared to the effect of Taxol alone. The authors attributed the improved treatment effect to lactate accumulation in the cells’ cytoplasm and decreased lactate concentration in the extracellular space due to the MCT1 inhibition.
Some other studies have demonstrated the association of cytosolic acidification and a decreased efficacy of Taxol. Vukovic et al. found that Taxol in combination with pH modifiers, leading to acidification of the intracellular environment, showed decreased cytotoxicity [Citation32]. Jia et al. showed that pretreatment of cancer cells with cariporide, an inhibitor of NHE1, resulted in resistance to Taxol. The authors associated this with the induction of cell quiescence in response to an acidic pHi and demonstrated an accumulation of cells in the G0/G1 phase under long-term paclitaxel treatment, whereas Taxol acts mainly on cells in the G2/M phase [Citation33]. In our study long-term Taxol exposure (24–48 hours) in vitro and chronic exposure in vivo resulted in a pHi decrease below the initial value, and this correlated with an inhibition of cell proliferation or tumor growth. It is known that acidification of the cytosol inhibits cancer cell proliferation and migration, thus decreasing tumor invasiveness and metastasis [Citation35]. We suggest that cytosol acidification could be associated with an inhibitory effect of Taxol on the activity of NHE1, as reported in Ref [Citation24]. Although acidic conditions are preferable for the apoptotic process, both death-receptor- and mitochondria-mediated [Citation36–38], pHi decrease in division-arrested cells did not finally result in cell death.
However, direct measurements of cytosolic pH under Taxol exposure have not previously been performed. In our study, rapid alkalization of the cytoplasm was observed in all cells exposed to Taxol, irrespective of the specifics of subsequent cell responses. It is known that Taxol has both acidic and basic domains [Citation39] but that the total charge of the molecule is unlikely to be a simple function of pH. Several studies suggest that Taxol is a non-ionizable molecule under physiological conditions [Citation37,Citation39]. Therefore, it is difficult to predict the effect of pH on the drug uptake and of Taxol’s influence on pHi [Citation32]. Although there is a strong interrelation between energy metabolism and pHi, the increase of pHi does not seem to be a consequence of metabolic rearrangements, as the increase has been observed very early (minutes) after the start of the treatment, while metabolic changes only occur later (>3 hours) [Citation40]. Several reports provide evidence that the organic anion-transporting polypeptides (OATPs) OATP1B1 and OATP1B3 mediate the uptake of Taxol by cancer cells [Citation41]. The study by Martinez-Becerra et al. suggests that substrate uptake through OATP1B1/OATP1B3 is accompanied by an electrogenic influx of anions (or efflux of cations) [Citation41]. Leuthold et al. demonstrated that substrate transport mediated by OATPs generally leads to a stimulation of bicarbonate efflux and, as a consequence, to a rapid intracellular alkalization [Citation42].
The rate of uptake of Taxol has been measured in different cancer cell lines (human breast carcinoma MDA-MB-435 and NCIADR-RES) in vitro [Citation34]. It was shown that the Taxol concentration in cancer cells gradually increased during the first hour of exposure and then reached a plateau. Although the exact molecular mechanisms for Taxol-induced elevation of pHi are still obscure, based on the existing data on the drug chemistry and cellular uptake, we speculate that this may be associated with OATP-mediated transport.
It should be mentioned that pHi monitoring in individual cells allowed the identification of differences in pHi dynamics between dying and surviving cells. In dying cells the pHi decreased more smoothly and was the same or slightly higher than the baseline level. This observation correlates with data on Ca2+-induced apoptosis in cancer cells treated with Taxol [Citation43]. Several other studies have independently demonstrated on HeLa and bovine aortic epithelial cells that cytosolic alkalization drives Ca2+ release from the endoplasmic reticulum [Citation44,Citation45]. Based on these data, we can assume that the cell death observed in our experiments might be provoked by cytosolic alkalization induced by the Taxol.
Collectively, the research noted above, taken together with our studies suggests that the effect of pHi on the cytotoxicity of Taxol is more likely to be due to the cell cycle dependence on pHi than to a direct impact of pH on Taxol activity. Since cell death was associated with a more alkaline pHi, we can assume that therapeutic approaches directed to cytosol alkalinization may potentially improve the treatment effectiveness of Taxol.
Conclusions
These findings elucidate the significance of pHi in the mechanisms of Taxol action on cervical cancer cells and will be valuable for the development of new approaches to cancer treatment. We showed that treatment with Taxol led to a pHi decrease in both cultured cells and tumors, which correlated with decreased cell proliferation but was insufficient to induce cell death. Therefore, combinatorial therapeutic regimens that include Taxol in combination with pHi-elevating agents could be promising solutions. The results indicating that different pHi changes reflect different responses to the drug could provide a framework for using pHi as an indicator of the response of tumors to therapy. We believe that, with recent advances in clinical methods for making pHi measurements in tumors, our results will be valuable for the development of new approaches to monitoring treatment efficacy in clinical settings.
Supplemental Material
Download Zip (112.4 KB)Acknowledgments
This work was financially supported by the Russian Foundation for Basic Research (project #19-32-90139).
Disclosure statement
No potential conflict of interest was reported by the author(s).
Supplementary material
Supplemental data for this article can be accessed here
Additional information
Funding
References
- Weaver BA, Bement W. How Taxol/paclitaxel kills cancer cells. Mol Biol Cell. 2014;25(18):2677–2681.
- Barbuti AM, Chen ZS. Paclitaxel through the ages of anticancer therapy: exploring its role in chemoresistance and radiation therapy. Cancers (Basel). 2015;7(4):2360–2371.
- Horwitz SB. Taxol (paclitaxel): mechanisms of action. Ann Oncol. 1994;5(Suppl 6):S3–6.
- Blagosklonny MV, Giannakakou P, El-deiry WS, et al. Raf-1/bcl-2 phosphorylation: a step from microtubule damage to cell death. Cancer Res. 1997;57(1):130–135.
- Ling YH, Yang Y, Tornos C, et al. Paclitaxel-induced apoptosis is associated with expression and activation of c-Mos gene product in human ovarian carcinoma SKOV3 cells. Cancer Res. 1998;58(16):3633–3640.
- Ofir R, Seidman R, Rabinski T, et al. Taxol-induced apoptosis in human SKOV3 ovarian and MCF7 breast carcinoma cells is caspase-3 and caspase-9 independent. Cell Death Differ. 2002;9(6):636–642. .
- Varbiro G, et al. Direct effect of Taxol on free radical formation and mitochondrial permeability transition. Free Radic Biol Med. 2001;31(4):548–558. .
- Asghari F, Haghnavaz N, Shanehbandi D, et al. Differential altered expression of let-7a and miR-205 tumor-suppressor miRNAs in different subtypes of breast cancer under treatment with Taxol. Adv Clin Exp Med. 2018;27(7):941–945. .
- Tao W-Y, Liang X-S, Liu Y, et al. Decrease of let-7f in low-dose metronomic Paclitaxel chemotherapy contributed to upregulation of thrombospondin-1 in breast cancer. Int J Biol Sci. 2015;11(1):48–58. .
- Wanderley CW, Colón DF, Luiz JPM, et al. Paclitaxel reduces tumor growth by reprogramming tumor-associated macrophages to an M1 profile in a TLR4-dependent manner. Cancer Res. 2018;78(20):5891–5900. .
- Panis C, Pavanelli WR. Cytokines as mediators of pain-related process in breast cancer. Mediators Inflamm. 2015;2015:129034.
- Damaghi M, Wojtkowiak JW, Gillies RJ. pH sensing and regulation in cancer. Front Physiol. 2013;4:370.
- Chiche J, Brahimi-Horn MC, Pouysségur J. Tumour hypoxia induces a metabolic shift causing acidosis: a common feature in cancer. J Cell Mol Med. 2010;14(4):771–794.
- Grillo-Hill BK, Choi C, Jimenez-Vidal M, et al. Increased H⁺ efflux is sufficient to induce dysplasia and necessary for viability with oncogene expression. Elife. 2015;4. DOI:10.7554/eLife.03270.
- Persi E, Duran-Frigola M, Damaghi M, et al. Systems analysis of intracellular pH vulnerabilities for cancer therapy. Nat Commun. 2018;9(1):2997. .
- Lauritzen G, Jensen MBF, Boedtkjer E, et al. NBCn1 and NHE1 expression and activity in DeltaNErbB2 receptor-expressing MCF-7 breast cancer cells: contributions to pHi regulation and chemotherapy resistance. Exp Cell Res. 2010;316(15):2538–2553. .
- Wang B-Y, Zhang J, Wang J-L, et al. Intermittent high dose proton pump inhibitor enhances the antitumor effects of chemotherapy in metastatic breast cancer. J Exp Clin Cancer Res. 2015;34(1):85. .
- Amith SR, Wilkinson JM, Baksh S, et al. The Na⁺/H⁺ exchanger (NHE1) as a novel co-adjuvant target in paclitaxel therapy of triple-negative breast cancer cells. Oncotarget. 2015;6(2):1262–1275. .
- Fais S. Evidence-based support for the use of proton pump inhibitors in cancer therapy. J Transl Med. 2015;13:368.
- Rebillard A, Tekpli X, Meurette O, et al. Cisplatin-induced apoptosis involves membrane fluidification via inhibition of NHE1 in human colon cancer cells. Cancer Res. 2007;67(16):7865–7874. .
- He X, Wang Y, Wang K, et al. Research of the relationship of intracellular acidification and apoptosis in Hela cells based on pH nanosensors. Sci China Ser B Chem. 2007;50:258–265. .
- Marathe K, McVicar N, Li A, et al. Topiramate induces acute intracellular acidification in glioblastoma. J Neurooncol. 2016;130(3):465–472. .
- Albatany M, Li A, Meakin S, et al. Dichloroacetate induced intracellular acidification in glioblastoma: in vivo detection using AACID-CEST MRI at 9.4 Tesla. J Neurooncol. 2018;136(2):255–262. .
- Reshkin SJ, et al. Paclitaxel induces apoptosis via protein kinase A- and p38 mitogen-activated protein-dependent inhibition of the Na+/H+ exchanger (NHE) NHE isoform 1 in human breast cancer cells. Clin Cancer Res. 2003;9(6):2366–2373.
- Matlashov ME, Bogdanova YA, Ermakova GV, et al. Fluorescent ratiometric pH indicator SypHer2: applications in neuroscience and regenerative biology. Biochim Biophys Acta. 2015;1850(11):2318–2328. .
- Bizzarri R, Serresi M, Luin S, et al. Green fluorescent protein based pH indicators for in vivo use: a review. Anal Bioanal Chem. 2009;393(4):1107–1122. .
- Benčina M. Illumination of the spatial order of intracellular pH by genetically encoded pH-sensitive sensors. Sensors (Basel). 2013;13(12):16736–16758.
- Shirmanova MV, Druzhkova IN, Lukina MM, et al. Intracellular pH imaging in cancer cells in vitro and tumors in vivo using the new genetically encoded sensor SypHer2. Biochim Biophys Acta. 2015;1850(9):1905–1911. .
- Druzhkova IN, Shirmanova MV, Lukina MM, et al. The metabolic interaction of cancer cells and fibroblasts – coupling between NAD(P)H and FAD, intracellular pH and hydrogen peroxide. Cell Cycle. 2016;15(9):1257–1266. .
- Shrode LD, Tapper H, Grinstein S. Role of intracellular pH in proliferation, transformation, and apoptosis. J Bioenerg Biomembr. 1997;29(4):393–399.
- Zagaynova EV, et al. Imaging of intracellular pH in tumor spheroids using genetically encoded sensor SypHer2. Adv Exp Med Biol. 2017;1035:105–119.
- Vukovic V, Tannock IF. Influence of low pH on cytotoxicity of paclitaxel, mitoxantrone and topotecan. Br J Cancer. 1997;75(8):1167–1172.
- Jia M, Zheng D, Wang X, et al. Cancer cell enters reversible quiescence through intracellular acidification to resist paclitaxel cytotoxicity. Int J Med Sci. 2020;17(11):1652–1664. .
- Ehrlichova M, Vaclavikova R, Ojima I, et al. Transport and cytotoxicity of paclitaxel, docetaxel, and novel taxanes in human breast cancer cells. Naunyn Schmiedebergs Arch Pharmacol. 2005;372(1):95–105. .
- Choi CH, Patel H, Barber DL. Expression of actin-interacting protein 1 suppresses impaired chemotaxis of Dictyostelium cells lacking the Na+-H+ exchanger NHE1. Mol Biol Cell. 2010;21(18):3162–3170.
- Gottlieb RA, Nordberg J, Skowronski E, et al. Apoptosis induced in Jurkat cells by several agents is preceded by intracellular acidification. Proc Natl Acad Sci U S A. 1996;93(2):654–658. .
- Liu FT, Newland AC, Jia L. Bax conformational change is a crucial step for PUMA-mediated apoptosis in human leukemia. Biochem Biophys Res Commun. 2003;310(3):956–962.
- Matsuyama S, Llopis J, Deveraux QL, et al. Changes in intramitochondrial and cytosolic pH: early events that modulate caspase activation during apoptosis. Nat Cell Biol. 2000;2(6):318–325. .
- Huizing MT, Misser VHS, Pieters RC, et al. Taxanes: a new class of antitumor agents. Cancer Invest. 1995;13(4):381–404. .
- Lukina MM, Dudenkova VV, Ignatova NI, et al. Metabolic cofactors NAD(P)H and FAD as potential indicators of cancer cell response to chemotherapy with paclitaxel. Biochim Biophys Acta Gen Subj. 2018;1862(8):1693–1700. .
- Svoboda M, Riha J, Wlcek K, et al. Organic anion transporting polypeptides (OATPs): regulation of expression and function. Curr Drug Metab. 2011;12(2):139–153. .
- Leuthold S, Hagenbuch B, Mohebbi N, et al. Mechanisms of pH-gradient driven transport mediated by organic anion polypeptide transporters. Am J Physiol Cell Physiol. 2009;296(3):C570–82. .
- Pan Z, Avila A, Gollahon L. Paclitaxel induces apoptosis in breast cancer cells through different calcium--regulating mechanisms depending on external calcium conditions. Int J Mol Sci. 2014;15(2):2672–2694.
- Danthuluri NR, Kim D, Brock TA. Intracellular alkalinization leads to Ca2+ mobilization from agonist-sensitive pools in bovine aortic endothelial cells. J Biol Chem. 1990;265(31):19071–19076.
- Li S, Hao B, Lu Y, et al. Li, S. Intracellular alkalinization induces cytosolic Ca2+ increases by inhibiting sarco/endoplasmic reticulum Ca2+-ATPase (SERCA). PLoS One. 2012;7(2):e31905. .