
ABSTRACT
CircRNA/miRNA/mRNA axis has been reported to play crucial regulatory roles in multiple cancers, including hepatocellular carcinoma (HCC). In addition, recent investigations revealed that aloin exerted anti-tumor functions in HCC. However, the underlying mechanism of aloin on anti-tumor functions in HCC remained elusive. Therefore, this study aimed to investigate whether circRNA/miRNA/mRNA axis medicated the anti-tumor effect of aloin in HCC. Cell viability, invasion, apoptosis and autophagy were accessed by cell counting kit-8 (CCK-8), transwell invasion assay, flow cytometry, Western blot and immunofluorescence analysis, respectively. Expression levels of circ_0011385, miR-149-5p and WT1 mRNA were determined using qRT-PCR assay. Binding sites between miR-149-5p and circ_0011385 or WT1 were predicted in starBase database. The binding relationship among circ_0011385, miR-149-5p and WT1 were verified by dual-luciferase reporter assay and RNA immunoprecipitation. Besides, the rescue experiments were performed by co-transfection with cric_0011385 overexpression plasmid, si-cric_0011385, miR-149-5p mimic and inhibitor, WT1 pDNA and si-WT1 in HCC cells. Furthermore, tumor growth was also investigated in the xenograft mouse model. Aloin inhibited HCC proliferation and invasion as well as promoted apoptosis and autophagy both in vitro and in vivo. Besides, aloin suppressed circ_0011385 expression. Overexpressed circ_0011385 partially reversed the anti-tumor effect of aloin on HCC. In addition, it was revealed that the circ_0011385, miR-149-5p and WT1 genes were abnormally expressed in HCC. Furthermore, the binding interactions between circ_0011385, miR-149-5p and WT1 were predicted and confirmed. Moreover, the effect of circ_0011385 on the anti-tumor role of aloin in HCC was rescued by miR-149-5p mimics. MiR-149-5p regulated HCC progression via modulating WT1. Aloin suppressed cell proliferation, invasion and tumor growth and promoted apoptosis and autophagy in HCC through regulating circ_0011385/miR-149-5p/WT1 axis. Aloin may be a potential candidate drug for HCC treatment.Abbrevations: HCC: Hepatocellular carcinoma; ceRNA: competing endogenous RNA; miRNA: microRNA; MREs: miRNA response elements; WT1: Wilms’ tumor 1; MMP-2: Matrix metalloproteinase; EMT: epithelial-mesenchymal transition; GADPH: glyceraldehyde 3-phosphate dehydrogenase; WT: wild type; MUT: mutant type; DMEM: dulbecco’s modified eagle medium.
KEYWORDS:
1. Introduction
Hepatocellular carcinoma (HCC) is one of the most devastating and aggressive cancers. The incidence rate of HCC continues to grow rapidly worldwide, with the third highest number of deaths at over 600,000 per year [Citation1]. Clinically, HCC patients presented a poor prognosis [Citation2]. Therefore, more efforts are needed in exploring new therapy strategies for HCC.
Aloin, also named barbaloin, has been proved to exert anticancer function in different kinds of cancer cells such as Ehrlich ascites carcinoma cell, myeloid leukemia, and acute lymphocyte leukemia cancerous cells [Citation3]. In HCC, the previous study reported that combination treatment of aloin and metformin suppressed HCC growth, invasion, and induced apoptosis and autophagy [Citation4]. These findings indicate that aloin may be a potential therapeutic drug for HCC treatment.
Recent studies have shown that natural agents, including curcumin, isoflavone, and EGCG, could regulate the expression of many miRNAs and thereby suppress tumor cell proliferation [Citation5,Citation6]. Zhang et al. reported that demethylzeylasteral, a bioactive compound extracted from Tripterygium wilfordii Hook F, inhibited glioma cell growth by regulating the miR-30e-5p/MYBL2 axis [Citation7]. CircRNAs were demonstrated to act as competing endogenous RNAs (ceRNAs) to sponge microRNA (miRNA) sponges [Citation8]. For example, CDR1as absorbed miR-7 via over 70 miRNA response elements (MREs) and exerted biological and pathological functions in many cancers [Citation9]. As a member of the circRNA family, hsa_circ_0011385 was found abnormally expressed in thyroid cancer tissue and acted as a sponge for miR-361-3p [Citation10]. In addition, hsa_circ_0011385 knockdown suppressed thyroid cancer cell proliferation, migration and invasion, and promoted cell cycle arrest and apoptosis [Citation1]. Nevertheless, the role of circ_0011385 in HCC remains unclear.
Wilms’ tumor 1 (WT1) gene, which is located at the short arm of chromosome 11 and contains 10 exons, encodes a DNA-binding transcription factor essential for embryonic development [Citation6]. WT1 presented high expression in most cases of acute myeloid leukemia (AML) and chronic myeloid leukemia (CML) and was associated with a long-time poor prognosis [Citation10]. Downregulation of WT1 restrained cell proliferation and induced apoptosis in AML cell line HL-60 and CML cell line K562 [Citation11]. MiRNAs could exert their post-transcriptional regulatory functions through regulating gene expression via binding to the 3ʹ-untranslated regions (3ʹ-UTR) of the targeted mRNAs [Citation12]. WT1 could be regulated by miRNAs and identified as a target for miR-149-5p [Citation13]. Hence, the interaction of miR-149-5p and WT1 in HCC was investigated in this study.
Herein, the expressions of circ_0011385, miR-149-5p and WT1 in HCC were analyzed. In addition, miR-149-5p was identified as a target of circ_0011385, the interaction between miR-149-5p and WT1 was investigated in HCC. Furthermore, the effects of aloin on HCC growth, proliferation, apoptosis and autophagy were investigated both in vivo and in vitro. Moreover, this study explored the function of circ_0011385/miR-149-5p/WT1 axis in the regulation of aloin on HCC progression. This study revealed a new mechanism by which aloin regulated HCC progression via modulating circ_0011385/miR-149-5p/WT1 axis in HCC.
2. Materials and methods
2.1 Reagents and antibodies
Aloin was obtained from Selleck and dissolved in DMSO (concentration: 1 mg/ml). HEK-293 T, HuH7, HCCLM3, and THLE-2 cell lines were purchased from the Institute of Chemistry and Cell Biology (Shanghai, China). Lentivirus-mediated sh-circ_0011385 or negative control (sh-NC) vectors, virion-packaging elements, and miR-149-5p mimics and inhibitor were purchased from Genechem (Shanghai, China). The full-length hsa_circ_0011385 cDNA was subcloned into the vector pcDNA3.1+ (Invitrogen, NY, USA) to establish the recombinant plasmid pcDNA-hsa_circ_0011385. pEGFP-LC3B were also purchased from Invitrogen. Antibodies against BCL2, BAX, MMP2, P62, Beclin-1, LC3 I, LC3 II and WT1 were purchased from Cell Signaling Technology (Danvers, MA, USA).
2.2 Clinical tissues
The tumor tissues and adjacent normal tissues were collected from 35 HCC patients in the First Affiliated Hospital of China Medical University. All patients enrolled in this study wrote informed consent. The study was approved by the Institutional Ethics Committee of the First Affiliated Hospital of China Medical University. None of the HCC patients received any treatment before surgery. Collected tissues were frozen in liquid nitrogen and then stored in −80°C refrigerator for further use.
2.3 Cell culture and transfection
Cells were cultured in ATCC-formulated Dulbecco’s modified eagle medium (DMEM; Gibco) supplemented with 10% fetal bovine serum (FBS; Gibco), penicillin (100 units/mL, Gibco), and streptomycin (100 g/mL, Gibco). All cells were placed in a 37°C incubator with 5% CO2.
MiR-149-5p mimics or inhibitors, circ_0011385 over-expression plasmids, WT1 pcDNA, si-circ_0011385 and negative control were separately transfected into HCC cells using Lipofectamine 2000 (Invitrogen, Carlsbad, CA, USA) following the manufacturers’ protocols.
2.4 Cell viability
CCK-8 assay was performed to detect cell proliferation ability as previously described [Citation14]. HCC cells were plated and treated as indicated in 96-well plates for different time durations. Then, 10 µl of CCK-8 reagent (Dojindo Molecular Technologies, Kumamoto, Japan) was added into each well and incubated for 2 h. The absorbance at 450 nm was measured by a microplate reader (BioTek Instruments, Inc).
2.5 Cell apoptosis assay
Flow cytometry was performed to detect cell apoptosis as previously described [Citation15]. HCC cells were gently homogenized and harvested. Cells were resuspended in PBS at a density of 1 × 10⁵, stained with Annexin V-FITC and PI, respectively. The proportion of the apoptotic cells was determined using a flow cytometer (BD Biosciences, San Jose, CA, USA).
2.6 Transwell invasion assay
Transwell invasion assay was conducted to determine cell invasion ability as previously described [Citation16]. The upper chamber of transwell was pre-covered with Matrigel (BD Biosciences, USA). HuH7 and HCCLM3 cells were seeded into the upper chamber and cultured in the serum-free DMEM medium. Besides, the DMEM medium with 10% FBS was added to the lower chamber. HCC cells were maintained at 37°C with 5% CO2 for 24 h. Then, the invaded cells were stained Giemsa dye. The number of invasion cells was measured in five random fields under a light microscope.
2.7 Western blotting analysis
Western blot analysis was performed as previously described [Citation17]. Briefly, proteins extracted from cells and tumors were separated on SDS-PAGE (12%) and transferred to PVDF membranes (Millipore). PVDF membranes were probed with primary antibodies after blocking nonspecific binding. The primary antibodies were anti-Bax (cat. no. 2772), anti-Bcl-2 (cat. no. 15,071), anti-Beclin-1 (cat. no. 3738), anti-P62 (cat. no. 5114), anti-LC3B (cat. no. 2275), anti-MMP-2 (cat. no. 4022) and GADPH (cat. no. 5174; dilution of all, 1:1,000) antibodies. After removing the primary antibody, membranes were incubated with horseradish peroxidase (HRP)-conjugated secondary antibody (Santa Cruz Biotechnology). The proteins were visualized using the Amersham ECL Prime Western Blotting Detection Reagent (Amersham Pharmacia Biotech). Finally, protein images were obtained by a ChemiDocxRS imaging system and analyzed by QuantityOne analysis software (Bio-Rad Laboratories).
2.8 Quantitative real time-polymerase chain reaction (qRT-PCR)
Total RNA was extracted using TRIzol reagent (Promega, Madison, WI, USA) according to the standard method of the manufacturer. Based on the instructions of the manufacturer, reverse transcription and cDNA amplification were performed using the First Stand cDNA Synthesis Kit (TIANGEN Biotechnology, Beijing, China) and SYBR Green PCR Master Mix (TaKaRa, Dalian, China) on ABI 7300 Sequence Detection System (Thermo Fisher Scientific, Inc., Waltham, MA, USA). Gene expressions were calculated using the 2−∆∆ct method [Citation18]. Glyceraldehyde 3-phosphate dehydrogenase (GAPDH) was used as the internal control. The qRT-PCR primers were designed as follows: miR-149-5p, Forward: 5ʹ-ATTCTCTCATCTGGCTCCGTGT-3ʹ, Reverse: 5ʹ-TATGGTTGTTCTGCTCTCTGTGTC-3ʹ; circ_0011385, Forward: 5ʹ-AGCTGGCCCTTCTCAAGACGGATCCGAAAGCAGCTGGCCCTTCTCAAG-3ʹ, Reverse: 5ʹ-ACTATACTGGTTGAGCTCTCCACTCGAATTCCTTGGCACTATACTGGTTGAGCTCT-3ʹ; Human WT1, Forward: 5ʹ-CAGGCTGCAATAAGAGATATTTTAAGCT-3ʹ, Reverse: 5ʹ-GAAGTCACACTGGTATGGTTTCTCA-3ʹ; Human GAPDH, Forward: 5ʹ-ATGTCGTGGAGTCTACTGGC-3ʹ, Reverse: 5ʹ-TGACCTTGCCCACAGCCTTG-3ʹ
2.9 Fluorescence microscopy and quantification
HCC cells were transfected with pEGFP-LC3B plasmid. pEGFP-LC3B expressing HCC cells were treated as indicated. After the cells were fixed in 4% paraformaldehyde, LC3 punctuate dots were detected under fluorescent microscopy (Leica, DM13000B, Germany) [Citation19]. The number of LC3 dots per cell was counted by Image-Pro Plus 7.0 software.
2.10 Dual-luciferase reporter assay
Dual-luciferase reporter assay was performed as previously described [Citation20]. HCC cells were seeded into 24-well plates and incubated for 24 h. The pmirGLO reporter vector carrying wild-type (WT) or mutant type (MUT) circ_0011385 and WT1 was co-transfected with the miR-149 mimic or miR-NC (miR-negative control, an oligonucleotide with scrambled sequence) into the HEK-293 T cells. After transfection for 48 h, luciferase activities were measured with a Dual-luciferase Reporter System (Promega, Madison, WI, USA).
2.11 RNA immunoprecipitation (RIP)
An Ago2-based RIP assay was carried out to verify whether circ_0011385 and miR-149-5p or miR149-5p and WT1 existed in the same RISC as previously described [Citation20]. HEK-293 T cells were collected after 48 h of transfection. Then, 20 μl anti-FLAG M2 magnetic beads were added to the cell lysate. RIP experiments were performed using a Magna RIP RNA-Binding Protein Immunoprecipitation Kit (Millipore, Bedford, MA, USA). The abundance of circ_0011385, miR-149-5p, WT1 was detected using qRT-PCR assay.
2.12 Prediction of circRNA–miRNA-mRNA pairs
CircRNAs function as sponges for miRNAs with MREs. The interaction between circ_0011385 and miR149-5p was predicted with the starBase (http://starbase.sysu.edu.cn/) [Citation21]. Three algorithms (miRanda [Citation22], TargetScan [Citation23], PITA [Citation24]) were used to depict miRNA target genes.
2.13 Animal experiments
Animal experiment was conducted as previously described [Citation17]. Briefly, six-week-old female immune-deficient nude mice (BALB/c-nu) were bred at the laboratory animal facility. Mice were injected subcutaneously with 5 × 10⁶ HuH7 cells with or without sh-NC or sh-circ_0011385 stably transfection. Mice and developed subcutaneous tumors were monitored daily. The tumor volume was measured weekly and calculated with the following formula: volume = length × width2/2. All animal experiments were performed in accordance with guidelines approved by the First Affiliated Hospital of China Medical University.
2.14 Immunohistochemistry assay
The paraffin-embedded tumor sections were incubated with anti-BCL-2 antibody (dilution rate, 1:200). The section was washed, counterstained, dehydrated, transparentized, and fixed according to the previous study [Citation25]. The images were captured using a microscope (Olympus, Tokyo, Japan).
2.15 Statistical analysis
SPSS 20.0 (IBM Corp., Armonk, NY) was used for the statistical analysis. Data from at least three independent experiments were expressed as the mean ± standard error of the mean (SEM). One-way ANOVA with Tukey’s post hoc test was used to evaluate the differences among multiple groups. Pearson correlation analysis was used to analyze the correlations of miR-149-5p and WT1 expressions in HCC tissues.
3. Results
3.1 Aloin inhibited HCC cell proliferation and invasion and induced apoptosis and autophagy
To investigate the effect of aloin on HCC progression, cell viability of two human HCC cell lines Huh7 and HCCLM3 and normal live epithelial cell line THLE-2 were detected by CCK-8 assay. As shown in , aloin inhibited the proliferation of HCC cells in a time – and dose – dependent manner. However, alion had no significant effect on the viability of normal live epithelial cells (Supplementary ). The apoptosis proportion of HuH7 and HCCLM3 after aloin treatment was increased compared to control (0 μmol/L) (). We noted that 50 μmol/L was a relatively appropriate dosage for aloin. Therefore, the 50 μmol/L aloin was used to treat cells for the following experiments. Besides, to explore the effect of aloin on HCC cells invasion ability, transwell invasion assay was conducted. Expectantly, aloin treatment significantly reduced the invasion ability of HCC cells (). Furthermore, to further study the effects of aloin on HCC cells, the expression levels of apoptosis-related protein (BCL2, BAX, MMP2) and autophagy-related protein (P62, Beclin-1, LC3 I, LC3 II) were detected using Western blot. It was observed that the relative expression levels of BCL2 and MMP2 were decreased, while BAX were increased by aloin. The results are presented in . Moreover, aloin increased the expression of autophagy marker LC3 II and Beclin 1, while it decreased the level of autophagy substrates p62 (). These findings indicated that aloin inhibited HCC proliferation and invasion and induced apoptosis and autophagy in vitro.
Figure 1. Aloin inhibited HCC cell proliferation and invasion and induced apoptosis and autophagy. Human HCC cell lines HuH7 and HCCLM3 were treated with different concentration of aloin (0, 10, 30, 50, 70 μmol/L). (a, b) Cell viability was determined by CCK-8 assay at different time points (24, 48, 72 h). (c, d) Cell apoptosis ratios were measured by flow cytometry. (e) Effects of aloin on HCC cell invasion ability were analyzed using transwell invasion assay. (f, g) Relative expressions of apoptosis-related protein (BCL2, BAX, MMP2) were detected by Western blot. (h, i) Relative expressions of autophagy-related protein (P62, Beclin-1, LC3 I, LC3 II) were detected by Western blot. Data were presented as mean±SEM (n ≥ 3). *P < 0.05, **P < 0.01, ***P < 0.001 versus 0 μmol/L or control
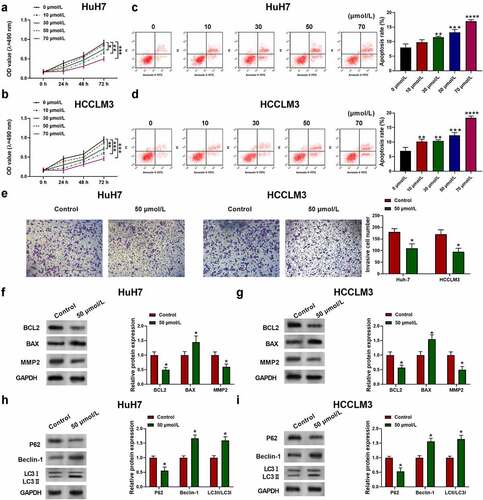
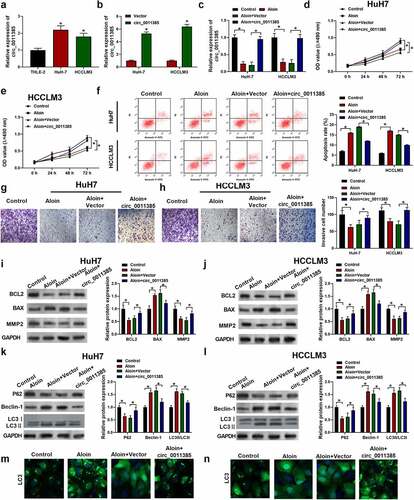
Figure 2. Aloin suppressed cell proliferation and invasion and promoted apoptosis and autophagy via regulating circ_0011385 expression in HCC. (a) qRT-PCR analysis of the expression of circ_0011385 in different HCC cell lines and normal liver cell THLE-2 (*p < 0.05 versus THLE-2). HuH7 and HCCLM3 were pre-transfected with or without circ_0011385 overexpression plasmid or blank vector, and then treated with aloin. (b) qRT-PCR analysis of the overexpression efficiency (*p < 0.05 versus Vector). (c) The expression of circ_0011385 in HCC cells after treated with aloin and transfected with circ_0011385 overexpression plasmid was determined using qRT-PCR. (d, e) Cell viability was determined by CCK-8 assay. (f) Cell apoptosis ratios were measured by flow cytometry. (g, h) Cell invasion ability in HCC cells after treated with aloin and transfected with circ_0011385 overexpression plasmid were determined using transwell invasion assay. (i, j) Relative expressions of apoptosis-related protein (BCL2, BAX, MMP2) were detected by Western blot. GADPH was used as the internal reference. (k, l) Relative expressions of autophagy-related protein (P62, Beclin-1, LC3 I, LC3 II) were detected by Western blot. GADPH was used as the internal reference. (m, n) LC3 (green) in HuH7 and HCCLM3 cells was detected by immunocytochemistry. Data were presented as mean±SEM (n ≥ 3). *P < 0.05 versus control or “aloin+vector”
3.2 Aloin suppressed cell proliferation and invasion and promoted apoptosis and autophagy via regulating circ_0011385 expression in HCC
To explore the role of circ_0011385 in HCC, circ_0011385 expression in HCC tumor tissues and HCC cell lines was determined. Circ_0011385 was significantly higher in tumor tissues than that in adjacent normal tissues (*P < 0.05, Supplementary ). Compared with normal human hepatocytes THLE2, circ_0011385 expression was noticeably increased in human HCC cell lines HuH7 and HCCLM3 (*p < 0.05, ). Besides, the circ_0011385 expression was significantly upregulated in the HCC cells transfected with circ_0011385 overexpression plasmid (*p < 0.05, ). To better interpret the influence of circ_0011385 on aloin’s role in HCC, the expression of circ_0011385 was determined in HCC cells after treated with aloin and transfected with circ_0011385 overexpression plasmid. Results showed that aloin decreased circ_0011385 expression, which was reversed by circ_0011385 overexpression plasmid (*p < 0.05, ). Consequently, circ_0011385 overexpression reversed the inhibitory effect of aloin on cell viability (, e) and cell invasion ability () of HCC cells. Furthermore, overexpression of circ_0011385 reduced the apoptotic rate by about 30% in both HuH7 and HCCLM3 cell lines (). Overexpressed circ_0011385 reversed the effects of aloin of the expressions of apoptosis and autophagy marker proteins (). In order to further define the role of circ_0011385 in aloin-induced autophagy, the eGFP-LC3 plasmid was introduced into HuH7 and HCCLM3cells. As presented in and 2 N, less LC3-positive puncta were observed in ‘aloin+circ_0011385ʹ group when compared with ‘aloin +vector’ or aloin group.
3.3 Circ_0011385 served as a sponge for miR-149-5p
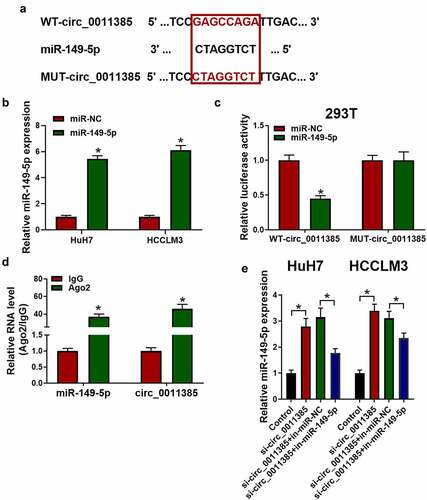
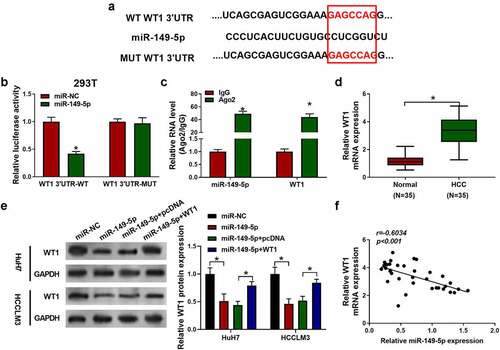
Previous studies have indicated that circ_0011385 could act as a sponge for miRNAs [Citation1]. Therefore, we explored the potential miRNAs associated with circ_0011385 in miRBase database, and the binding site located between circ_0011385 and miR-149-5p was found (). Then, miR-149-5p mimics were transfected into Huh7 and HCCLM3 cells, the transfection efficiency was verified by qRT-PCR (). In order to identify the direct interaction between circ_0011385 and miR-149-5p, and the luciferase reporter assay was conducted and the results are shown in . It is revealed that miR-149-5p mimics significantly attenuated luciferase activity driven by wild-type circ_0011385. However, the luciferase activity of MUT-circ_0011385 remained unchanged after miR-149-5p mimic treatment. Moreover, RIP assay for Ago2 was performed. Ago2 was the central component of most mammalian micro-ribonucleoprotein complexes (miRNPs) and it could directly bind to mature miRNAs. Therefore, Ago 2 could be used for RIP assay. As shown in , endogenous miR-149-5p and circ_0011385 pulled down by Ago2 were enriched in cell lysates. Additionally, miR-149-5p was significantly increased by overexpressed circ_0011385, which was reversed by miR-149-5p inhibitors.
Figure 3. Circ_0011385 served as a sponge for miR-149-5p. (a) Predicted binding regions of miR-149-5p with WT or MUT circ_0011385. Cells were transfected with miR-149-5p mimics or miR-NC (negative control) (b) Transfection efficiency of miR-149-5p mimics plasmid was measured by qRT-PCR in HuH7 and HCCLM3 cells. (c) The interaction of circ_0011385 and miR-149-5p was verified by dual-luciferase reporter assay in HEK-293 T cells (*P < 0.05 vs. miR-NC group). (d) Ago2 RNA immunoprecipitation (RIP) assay was used for detection of the amount of miR-149-5p and circ_0011385 in HEK-293 T cells (*P < 0.05 vs. IgG group). (e) HuH7 and HCCLM3 were interfered as indicated with circ_0011385 siRNA or miR149-5p inhibitors. Relative expression of miR-149-5p was shown by qPCR detection. Data were presented as mean±SEM (n ≥ 3)
3.4 MiR-149-5p counteracted the reversion effect of overexpressed circ_0011385 on aloin in HCC cells.
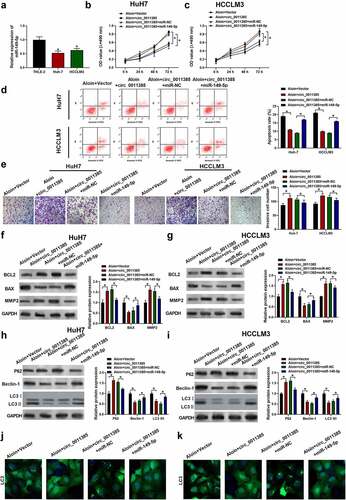
The expression of miR-149-5p in HCC tumor tissues and HCC cell lines were detected. As shown in Supplementary , miR-149-5p was decreased in HCC tumor tissues compared to adjacent normal tissues. Besides, miR-149-5p was downregulated in HCC cells HuH7 and HCCLM3 compared with normal liver cell THLE-2 (). As previous experiments showed that circ_0011385 could sponge miR-149-5p, we further confirmed whether miR-149-5p mimics could rescue the reversion effect of overexpressed circ_0011385 on anti-tumor role of aloin in HCC cells. Therefore, the miR-149-5p mimic and circ_0011385 vector were co-transfected into cells before aloin treatment. Results showed that upregulation of miR-149-5p in HuH7 and HCCLM3 could decrease the cell viability (), cell invasion ability () and increase the apoptotic cell ratio () compared with miR-NC. From Figure F-K, it could be concluded that aloin regained its apoptosis – and autophagy-induction effects that were weakened by circ_0011385 after treating with miR-149-5p.
Figure 4. MiR-149-5p counteracted the reversion effect of circ_0011385 on aloin in HCC cells. (a) qRT-PCR analysis of the expression of miR-149-5p in different HCC cell lines and normal liver cell THLE-2 (*p < 0.05 versus THLE-2). Cells were treated with aloin or transfected with circ_0011385 overexpression plasmid and miR-149-5p mimics as indicated, blank vector and miR-NC were given as negative control. (b, c) Cell viability was determined by CCK-8 assay. (d) Cell apoptosis ratios were measured by flow cytometry. (e) Effects on cell invasion ability were detected by transwell invasion assay. (f, g) Relative expressions of apoptosis-related protein (BCL2, BAX, MMP2) were detected by Western blot. GADPH was used as the internal reference. (h, i) Relative expressions of autophagy-related protein (P62, Beclin-1, LC3 I, LC3 II) were detected by Western blot, GADPH was used as the internal reference. (j, k) LC3 (green) in HuH7 and HCCLM3 cells was detected by immunocytochemistry. Data were presented as mean±SEM (n ≥ 3). *P < 0.05 versus “aloin+vector” or “aloin+cric_0011385+ miR-NC”
To further confirm the effect of miR-149-5p on the regulation action of circ_0011385 on aloin, HCC cells were transfected with si-circ_0011385 and miR-149-5p inhibitor. The transfection efficiencies of si-circ_0011385 and miR-149-5p inhibitor were verified using qRT-PCR, respectively (Supplementary , 3B). Besides, results showed that knockdown of circ_0011385 elevated the expression of miR-149-5p (Supplementary ). In HCC cells treated by aloin, si-circ_0011385 induced miR-149-15p expression, which was decreased by miR-149-15p inhibitor (Supplementary ). Furthermore, si-circ_0011385 suppressed HCC cell invasion ability and promoted the apoptosis and autophagy in HCC cells treated by aloin, but the effects were abolished by miR-149-15p inhibitor (Supplementary , 3 F).
3.5 miR-149-5p directly targeted WT1 in HCC.
Next, the downstream target of miR-149-5p was further identified by bioinformatics method. WT1 was identified as a target of miR-149-5p. The binding site between miR-149-5p and the 3ʹ-UTR of WT1 was shown in . Luciferase reporter assay was then performed to confirm the prediction. The results revealed that the luciferase activity of wt-WT1 was reduced by miR-149-5p mimics. However, after the miR-149-5p mimic had no effect on WT1 3ʹUTR-MUT (). Moreover, the miR-149-5p and WT1 RNA were pulled down by Ago2 RIP assay to further verify the interaction (). Besides, QRT-PCR results showed that WT1 was overexpressed in HCC tumor tissue compared with the adjacent normal tissues (*p < 0.05, ). Besides, we transfected HuH7 and HCCLM3 cells with miR-149-5p mimics or WT1 plasmid and detected their WT1 expression level by immuno-blotting (). It was observed that miR-149-5p mimics down-regulated the level of WT1 protein, which rescued by WT1 overexpressed plasmid. Furthermore, WT1 was found to be negatively correlated with miR-149-5p expression in HCC tissues (p < 0.01, R = −0.6034; ). In conclusion, miR-149-5p directly targeted WT1 and negatively regulated its expression in HCC.
Figure 5. MiR-149-5p directly targeted WT1 in HCC. (a) The predicted binding sites between miR-149-5p and the 3ʹ-UTR of WT1 or MUT WT1. (b) The interactions of miR-149-5p with wild-type WT1 or mutated WT1 were verified by dual luciferase reporter assay (*P < 0.05 vs. miR-NC group). (c) Cells were transfected with miR-149-5p mimics or miR-NC (negative control). The amount of miR-149-5p and WT1 in HEK-293 T cells was detected after Ago2 RNA immunoprecipitation (RIP) (*P < 0.05 vs. IgG group). (d) qRT-PCR analysis of the expression of WT1 in normal and HCC tissues (n = 35, *p < 0.05 versus Normal). (e) Immuno-blotting analysis of WT1 expression after transfection with miR-149-5p mimics or WT1 pDNA as indicated, miR-NC and pcDNA were used as the negative control (*P < 0.05 versus miR-NC or “miR-149-5p+pcDNA”). (f) The correlation between miR-149-5p and WT1 mRNA expression. Data were presented as mean±SEM (n ≥ 3)
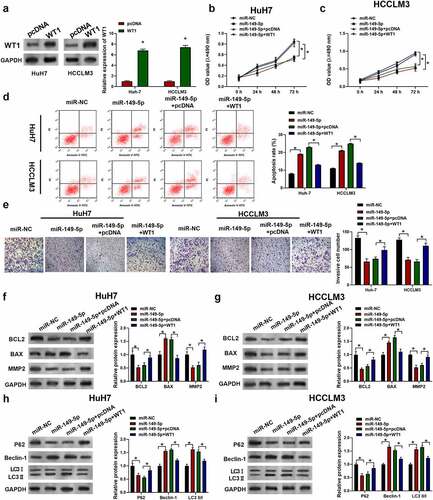
3.6 MiR-149-5p suppressed the development of HCC via targeting WT1.
To examine whether the anti-HCC effect of miR-149-5p was dependent on WT1, WT1 overexpression plasmid was constructed to transfect cells. As shown in , the introduced plasmid efficiently elevated WT1 expression in HuH7 and HCCLM3 cells. From , the miR-149-5p mimics treatment was unable to inhibit cell proliferation, cell invasion ability or induce the increasing of apoptosis cells proportion after WT1 was upregulated. Similarly, Western blots had showed that miR-149-5p downregulated the level of BCL2 and MMP2 and upregulated BAX, which was abolished by WT1 pDNA transfection (). On the other hand, in WT1 overexpressed cells, miR-149-5p was not able to significantly promote autophagy tested by the Western blots of LC3 II, P62 and Beclin-1 (). In summary, miR-149-5p-induced inhibition of proliferation and induction of apoptosis and autophagy was reversed by overexpression of WT1 in HCC cells.
Figure 6. MiR-149-5p suppressed the development of HCC via WT1. Cells were introduced with WT1 expression plasmid (pcDNA was used as negative control). (a) Relative expressions of WT1 in HCCLM3 and HuH7 determined by Western Blot assay (p*<0.05 versus pcDNA). Cells were successively treated with or without WT1 expression plasmid or pcDNA and miR-149-5p mimics. (b, c) Cell viability was determined by CCK-8 assay. (d) Cell apoptosis ratios were measured by flow cytometry. (e) Effects on cell invasion ability were determined using transwell invasion assay. (f, g) Relative expressions of apoptosis-related protein (BCL2, BAX, MMP2) was detected by Western blot, GADPH was used as the internal reference. (h, i) Relative expressions of autophagy-related protein (P62, Beclin-1, LC3 I, LC3 II) detected by Western blot, GADPH was used as internal reference. Data were presented as mean±SEM (n ≥ 3). *P < 0.05 versus “miR-NC” or “miR-149-5p+pcDNA”
To better explore the role of WT1 in the regulation of miR-149-5p on HCC progression, HCC cells were transfected with miR-149-5p inhibitor and si-WT1. The transfection efficiency of si-WT1 was confirmed by Western blot (Supplementary ). The elevated WT1 expression induced by miR-149-5p inhibitor was inhibited by si-WT1 (Supplementary ). Besides, miR-149-5p inhibitor promoted HCC cell invasion ability, which was suppressed by si-WT1 (Supplementary ). Furthermore, miR-149-5p inhibitor suppressed the apoptosis and autophagy of HCC cells, which was reversed by si-WT1 (Supplementary ).
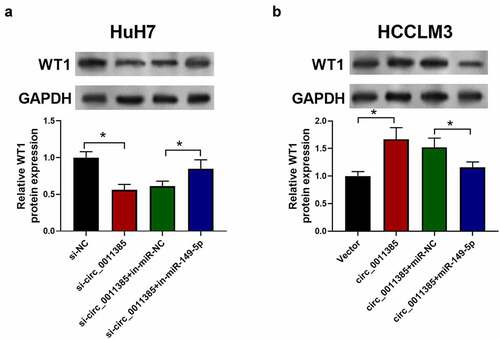
3.7 Validation of circ_0011385/miR-149-5p/WT1 axis.
For the purpose of validating circ_0011385/miR-149-5p/WT1 axis, HuH7 and HCCLM3 cells were transfected with circ_0011385 siRNAs or overexpression plasmid and miR-149-5p inhibitors or mimics as indicated. In , HCC cells exhibited a down-regulation of the WT1 level after infected with circ_0011385 siRNA. In addition, WT1 was significantly increased after cells were co-transfected with miR-149-5p inhibitors. In contrast, the WT1 level was increased by co-transfection of circ_0011385 overexpression and decreased by miR149-5p mimics. Therefore, we confirmed the interaction and function of circ_0011385, miR-149-5p and WT1.
Figure 7. Circ_0011385-miR149-5p-WT1 axis was validated in HCC cells. Cells were treated as indicated with circ_001385 siRNA and miR-149-5p inhibitors (si-NC and in-miR-NC were negative control). Representative immuno-blotting image and quantitative column diagrams of WT1 expression in HuH7 (a) and HCCLM3 (b), GADPH was used as the control. *P < 0.05 versus si-NC, “si-circ_0011385+ in-miR-NC”, vector and “circ_0011385+ miR-NC” as indicated. Data were presented as mean±SEM (n ≥ 3)
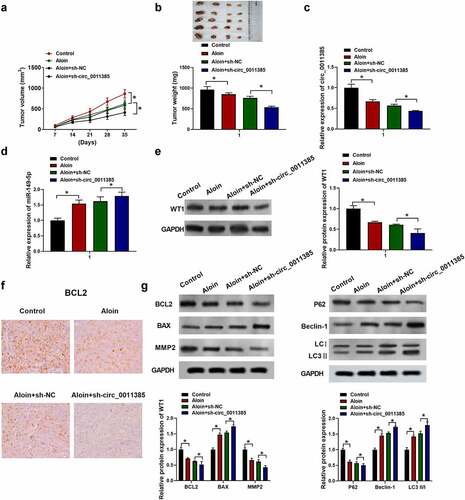
3.8 Aloin exerted tumor inhibitory effect via regulating circ_0011385/miR-149-5p/WT1 axis in vivo
To further investigate the effects of aloin on HCC progression in vivo, the HuH7 cells with or without shRNA treatment were subcutaneously injected into the BALB/c nude mice in order to establish the animal model. As shown in , the average volumes and weight of tumors were decreased in aloin and ‘aloin+sh-circ_0011385ʹ groups compared with control and “aloin+sh-NC” groups, respectively. QRT-PCR results showed that aloin reduced the expression of circ_0011385 compared with control, and the combination of aloin and sh-circ_0011385 decreased circ_0011385 expression compared with sh-NC+aloin (*p < 0.05), indicating that circ_0011385 expression in tumor tissue was successfully knocked down by sh-circ_0011385 (). However, aloin increased miR-149-5p expression in tumor tissue compared with control (*p < 0.05), and the combination of aloin and sh-circ_0011385 further enhanced this trend (). Additionally, immunoblotting results suggested that the relative expression of WT1 was downregulated by aloin, and the relative expression of WT1 in ‘aloin+sh-circ_0011385ʹ group was obviously lower than that in “aloin+sh-NC” group (*p < 0.05, ). Consistent with the in vitro results, aloin decreased BCL2, MMP2 expression, while increased Bax expression in vivo. Similarly, aloin increased the expression of autophagy marker LC3 II and Beclin 1, while it decreased the level of autophagy substrates p62. Loss of circ_0011385 enhanced the changes mediated by aloin ().
Figure 8. Aloin exerted tumor inhibitory effect via regulating circ_0011385/miR149-5p/WT1 axis in vivo. The HuH7 cells with or without shRNA treatment were subcutaneously injected into the left fank of BALB/c nude mice and allowed to grow for 5 weeks, saline or aloin (40 mg/kg) were given by intraperitoneal injection every day. (a) The tumor volume was measured every 7 days. (b) Tumors were removed and weighed on the 35th day. (d) qRT-PCR analysis of miR-149-5p expression in tumor tissue. (e) Immuno-blotting analysis of WT1 expression in tumor tissue. (f) Immunohistochemistry assay of BCL2. (g) Relative expressions of apoptosis-related protein (BCL2, BAX, MMP2) and autophagy-related protein (P62, Beclin-1, LC3 I, LC3 II) were detected by Western blot, GADPH was used as internal reference. Data were presented as mean±SEM (n ≥ 3). *P < 0.05 versus control and aloin +sh-NC
4. Discussion
Aloe, an important medicinal herb, has long been used in traditional Chinese medicine to treat a number of diseases without significant adverse effects. Therefore, their active ingredients may be safe candidates for the treatment of cancer. In fact, aloin, one of the primary active ingredients (15% to 40%), extracted from Aloe barbadensis Miller leaves [Citation26], has shown anticancer potential. It was demonstrated that aloin suppressed cell proliferation and induced cell apoptosis in different human tumor cells such as T cell line Jurkat, human cervical cancer cell line HeLaS3 and human lung cancer cell line A549 [Citation27]. Aloin has also exhibited an anti-HCC effect in HepG2 and Bel-7402 cells [Citation4]. Aloin has been proven to induce autophagy and apoptosis accompanied by activation of PI3K/Akt/mTOR signaling pathway. Herein, we used another two HCC cell lines HuH7 and HCCLM3 for in vitro investigation. We found that aloin significantly inhibited HuH7 and HCCLM3 proliferation and induced apoptosis and autophagy. These results were consistent with the previously reported findings [Citation4,Citation28]. MMPs were proved to play an important role in tumor invasion and metastasis [Citation29] Our results showed that aloin significantly suppressed the protein expression of MMP-2.
Recent studies reported that dysregulated circRNAs were involved in tumor progression, including HCC. According to Cui et al. 3300 circRNAs in HCC were detected using RNA-seq and found circRNAs were differentially expressed in HCC tissue compared with the adjacent non-tumorous liver tissue. Especially, the circPTPRM was significantly associated with HCC recurrence and metastasis [Citation30]. Xia et al. has indicated that circ_0011385 was significantly upregulated in thyroid cancer, and downregulation of circ_0011385 suppressed thyroid cancer cell proliferation, migration and invasion and promoted cell cycle arrest and apoptosis [Citation1] In our study, we firstly reported circ_0011385 was dramatically increased in HCC compared with normal tissues or cells. Besides, aloin treatment suppressed the expression of cric_0011385, and upregulation of cric_0011385 could partially abolish the anti-cancer effects of aloin on HCC. This study reports for the first time the involvement of cric_0011385 in the regulation of the anti-cancer effect of aloin.
Accumulating evidence indicated that circRNAs acted as miRNA sponges to participate in tumor development due to that cricRNAs included miRNA response elements (MREs) to trap a particular miRNA. For example, Han et al. found that circMTO1 promoted the expression of the tumor suppressor p21 through acting as an miR-9 sponge and inhibited the proliferation and invasion of HCC cells [Citation31]. Shi et al. showed that CircARSP91 inhibited tumor growth of HCC cells by regulating the AR/ADAR1/CircARSP91 signaling axis [Citation32]. Zhu et al. revealed that circ_0067934 directly inhibited the ability of miR-1324 to target FZD5 and downregulated Wnt/-catenin signaling, thereby promoting HCC progression [Citation33]. Therefore, we speculated that the influence of circ_0011385 in the anti-cancer effect of aloin on HCC might be mediated by acting miRNA sponges. To identify the miRNAs that bind to circ_0011385, we performed bioinformatics analysis on the starbase database. The results showed that miR-149-5p contained at least one binding site for circ_0011385 MRE region. Besides, the relationship of circ_0011385 and miR-149-5p was verified by the luciferase reporter and RIP assay. Furthermore, it was found that miR-149-5p expression was decreased in HCC and circ_0011385 modulated miR-149-5p negatively. These results suggested that circ_0011385 could function as a miR-149-5p sponge. Moreover, the reversion effect of circ_0011385 on the anti-cancer role of aloin in HCC was also partially abolished by miR-149-5p.
Previously, miR-149-5p has been demonstrated to function as a tumor suppressor in multiple malignant tumors. It suppressed cell proliferation and invasion by targeting FOXM1 in colorectal cancer [Citation34], GIT1 in breast cancer [Citation35], and ZBTB2 in gastric cancer [Citation36]. PPM1F has been verified as a potential target of miR-149-5p in HCC [Citation37] Therefore, the potential target of miR-149-5p in HCC was explored. The results showed that Wilms’ tumor-1 (WT1) was a target of miR-149-5p, and the expression of WT1 could be negatively regulated by miR-149-5p. WT1 is a transcriptional activator of the erythropoietin gene, which has been found to play an important role in many human cancers [Citation38]. Wang et al. reported that WT1 was found to function as an oncogene in HCC [Citation39]. The upregulation of WT1 was identified in HCC, which predicted poor prognosis of HCC patients. Cheng and the coworkers showed that miR-361-5p interacted with WT1, thereby regulating the progression of HCC [Citation40]. Therefore, we inferred that WT1 might participate in the regulation of miR-149-5p on HCC progression. Our experiments revealed that miR-149-5p suppressed HCC cell proliferation, invasion and accelerated apoptosis, and autophagy by inhibiting WT1 expression. Thus, we hypothesized that circ_0011385 acted as a sponge of miR-149-5p, thereby resulting in increased expression of WT1 in HCC progression, which was subsequently verified. The WT1 expression was induced by overexpressed circ_0011385, which was reversed by increased miR-149-5p in HCCLM3. In contrast, knockdown of circ_0011385 downregulated WT1 expression, while decreased miR-149-5p reversed this effect in HuH7 cells.
Consistent with these findings in vitro, the in vivo experiment further confirmed that the aloin exerted anti-cancer effect in HCC induced apoptosis and autophagy in HuH7 xenograft model. This is highly similar to the previous studies in HepG2 xenograft mice [Citation27]. Moreover, silencing circ_0011385 enhanced the tumor-inhibition effects of aloin. Downregulation of circ_0011385 strengthened the low WT1 level and the changes in pro-apoptotic, anti-apoptotic, autophagy marker protein levels that were caused by aloin treatment. Our results suggest that aloin exerted anti-HCC and induced apoptotic and autophagy functions via modulating circ_0011385/miR-149-5p/WT1 axis.
Previous studies reported that the regulation mechanism of aloin on cancer progression was mainly to regulate the activity of signaling pathways and apoptosis [Citation4,Citation41,Citation42,Citation43]. For instance, Wang et al. found that aloin suppressed the proliferation and migration of gastric cancer cells by regulating NOX2-ROS-mediated pro-survival signal pathways [Citation41]. Li et al. showed that aloin promoted cell apoptosis by regulating HMGB1-TLR4-ERK axis in human melanoma cells [Citation42]. Sun et al. revealed that the combination of aloin and metformin enhanced the antitumor effect by inhibiting the growth and invasion and inducing apoptosis and autophagy in hepatocellular carcinoma through PI3K/AKT/mTOR pathway [Citation4]. However, the effect of non-coding RNA in the anticancer effect of alion has not been reported up to now. Thus, this study reveals for the first time that aloin could exert anti-cancer function via modulating circ_0011385/miR-149-5p/WT1 axis.
This study has several limitations. The effect of aloin on EMT was not studied in this study. Besides, autophagy has a dual role in cancer as well as two-tier functions in EMT [Citation33]. Autophagy inhibited EMT via regulation of key transcription factors in some cancer cells. By contrast, it stimulates EMT by regulating the level of EMT proteins in cancer. Our study only demonstrated that aloin promoted autophagy. The relationship of autophagy and EMT in aloin treated HCC cells remained elusive. Therefore, the effect of aloin on EMT and the relationship of autophagy and EMT in aloin treated HCC cells will be investigated in the next study.
5. Conclusion
Aloin suppressed cancer cell proliferation, invasion and tumor growth and promoted apoptosis and autophagy in HCC through regulating circ_0011385/miR-149-5p/WT1 axis. Aloin may be a potential drug for HCC treatment.
Author contribution
Dazhi Fu: Conceptualization, Methodology, Software, Supervision. Chunxiao Wang: Investigation, Writing original draft. Lei Yu: Validation, Visualization. Rui Yu: Writing reviewing and editing. All authors read and approved the manuscript.
Supplemental Material
Download Zip (3.3 MB)Disclosure statement
The authors declare that there are no conflicts of interest.
Supplementary material
Supplemental data for this article can be accessed here
Additional information
Funding
Related Research Data
References
- Siegel RL, Miller KD, Jemal A, Cancer statistics, 2018. CA Cancer J Clin. 2018;68(7):30.
- El–Serag HB, Rudolph KL. Hepatocellular carcinoma: Epidemiology and molecular carcinogenesis. Gastroenterology. 2007;132(7):2557–2576.
- El-Shemy HA, Mama-s A, Nassr-Allah A, et al. Antitumor properties and modulation of antioxidant enzymes activity by aloe vera leaf active principles isolated via supercritical carbon dioxide extraction. Curr Med Chem. 2010;17(2):129–138.
- Sun R, Zhai R, Ma C, et al. Combination of aloin and metformin enhances the antitumor effect by inhibiting the growth and invasion and inducing apoptosis and autophagy in hepatocellular carcinoma through PI3K/AKT/mTOR pathway. Cancer Med. 2020;9(3):1141–1151.
- Davis CD, and Ross SA. Evidence for dietary regulation of microRNA expression in cancer cells. Nutr Rev. 2010;66(8) ;477–482.
- Gao SM, Yang JJ, Chen CQ, et al. Pure curcumin decreases the expression of WT1 by upregulation of miR-15a and miR-16-1 in leukemic cells. J Exp Clin Cancer Res. 2012;31(1):27.
- Zhang K, Fu G, Pan G, et al. Demethylzeylasteral inhibits glioma growth by regulating the miR-30e-5p/MYBL2 axis. Cell Death Dis. 2018;9(10):1035.
- Paul P, Chakraborty A, Sarkar D, et al. Interplay between miRNAs and human diseases. J Cell Physiol. 2018;233(3):2007–2018.
- Lim LP, Lau NC, Garrett-Engele P, et al. Microarray analysis shows that some microRNAs downregulate large numbers of target mRNAs. Nature. 2005;433(7027):769–773.
- Xia F, Chen Y, Jiang B,. et al. Hsa_circ_0011385 accelerates the progression of thyroid cancer by targeting miR-361-3p. Cancer Cell Int.(2020)20:49.
- Bergmann L, Miething C, Maurer U, et al. High levels of Wilms‘ tumor gene (wt1) mRNA in acute myeloid leukemias are associated with a worse long-term outcome. Blood. 1997;90(3):1217.
- Glienke W, Maute L, Koehl U, et al. Effective treatment of leukemic cell lines with wt1 siRNA. Leukemia. 2007;21(10):2164–2170.
- Bartel DP. MicroRNAs: target recognition and regulatory functions. Cell. 2009;136(2):215.
- Dame C, Kirschner KM, Bartz KV, et al. Wilms tumor suppressor, Wt1, is a transcriptional activator of the erythropoietin gene. Blood. 2006;107(11):4282.
- Cai L, Qin X, Xu Z, et al. Comparison of cytotoxicity evaluation of anticancer drugs between real-time cell analysis and CCK-8 method. ACS Omega. 2019;4(7):12036–12042.
- Pan Y, Ye C, Tian Q, et al. miR-145 suppresses the proliferation, invasion and migration of NSCLC cells by regulating the BAX/BCL-2 ratio and the caspase-3 cascade. Oncol Lett. 2018;15:4337–4343.
- Louca M, Stylianou A, Minia A, et al. Ras suppressor-1 (RSU-1) promotes cell invasion in aggressive glioma cells and inhibits it in non-aggressive cells through STAT6 phospho-regulation. Sci Rep. 2019;9(1):7782.
- Tanaka K, Iwakuma T, Harimaya K, et al. EWS-Fli1 antisense oligodeoxynucleotide inhibits proliferation of human Ewing’s sarcoma and primitive neuroectodermal tumor cells. J Clin Invest. 1997;99(2):239–247.
- Livak KJ, Schmittgen TD. Analysis of relative gene expression data using real-time quantitative PCR and the 2(-Delta Delta C(T)) method. Methods. 2001;25(4):402–408.
- Zhang X, Yuan Y, Jiang L, et al. Endoplasmic reticulum stress induced by tunicamycin and thapsigargin protects against transient ischemic brain injury: involvement of PARK2-dependent mitophagy. Autophagy. 2014;10(10):1801–1813.
- Zhao Z, Ji M, Wang Q, et al. Circular RNA Cdr1as upregulates SCAI to suppress cisplatin resistance in ovarian cancer via miR-1270 suppression. Mol Ther Nucleic Acids. 2019;18:24–33.
- Li J-H, Liu S, Zhou H, et al. starBase v2.0: decoding miRNA-ceRNA, miRNA-ncRNA and protein–RNA interaction networks from large-scale CLIP-Seq data. Nucleic Acids Res. 2014;42(D1):D92–97.
- Betel D, Wilson M, Gabow A, et al. The microRNA.org resource: targets and expression. Nucleic Acids Res. 2008;36(Database):D149–153.
- Lewis BP, Burge CB, Bartel DP. Conserved seed pairing, often flanked by adenosines, indicates that thousands of human genes are microRNA targets. Cell. 2005;120(1):15–20.
- Kertesz M, Iovino N, Unnerstall U, et al. The role of site accessibility in microRNA target recognition. Nat Genet. 2007;39(10):1278–1284.
- Li N, Zhang R. Silencing of p53 reduces cell migration in human Tenon’s fibroblasts induced by TGF-β. Int Ophthalmol. 2020;40(6):1509–1516.
- Gutterman Y, Chauser-Volfson E. The content of secondary phenol metabolites in pruned leaves of Aloe arborescens, a comparison between two methods: leaf exudates and leaf water extract. J Nat Med. 2008;62(4):430–435.
- Wan L, Zhang L, Fan K, et al. Aloin promotes A549 cell apoptosis via the reactive oxygen speciesmitogen activated protein kinase signaling pathway and p53 phosphorylation. Mol Med Rep. 2017;16(5):5759–5768.
- Wan L, Zhang L, Fan K, et al. Aloin promotes A549 cell apoptosis via the reactive oxygen species‑mitogen activated protein kinase signaling pathway and p53 phosphorylation. Mol Med Rep. 2017;16(5):5759–5768.
- Yan L, Yang S, Yue CX, et al. Long noncoding RNA H19 acts as a miR-340-3p sponge to promote epithelial-mesenchymal transition by regulating YWHAZ expression in paclitaxel-resistant breast cancer cells. Environ Toxicol. 2020;35(9):1015–1028.
- Luo Z, Mao X, Cui W. Circular RNA expression and circPTPRM promotes proliferation and migration in hepatocellular carcinoma. Med Oncol. 2019;36(10):86.
- Han D, Li J, Wang H, et al. Circular RNA circMTO1 acts as the sponge of microRNA‐9 to suppress hepatocellular carcinoma progression. Hepatology. 2017;66(4):1151.
- Shi L, Yan P, Liang Y, et al. Circular RNA expression is suppressed by androgen receptor (AR)-regulated adenosine deaminase that acts on RNA (ADAR1) in human hepatocellular carcinoma. Cell Death Dis. 2017;8(11):e3171.
- Zhu Q, Lu G, and Luo Z, et al. CircRNA circ_0067934 promotes tumor growth and metastasis in hepatocellular carcinoma through regulation of miR-1324/FZD5/Wnt/β-catenin axis. Biochem Biophys Res Commun. 2018;497(2) ;S0006291X18303504.
- Xu K, Liu X, Mao X, et al. MicroRNA-149 suppresses colorectal cancer cell migration and invasion by directly targeting forkhead box transcription factor FOXM1. Cell Physiol Biochem. 2015;35(2):499–515.
- Chan SH, Huang WC, Chang JW, et al. MicroRNA-149 targets GIT1 to suppress integrin signaling and breast cancer metastasis. Oncogene. 2014;33(36):4496–4507.
- Ying W, Zheng X, Zhang Z, et al. MicroRNA-149 inhibits proliferation and cell cycle progression through the targeting of ZBTB2 in human gastric cancer. Plos One. 2012;7(10):e41693.
- Dong J, Teng F, Guo W, et al. lncRNA SNHG8 promotes the tumorigenesis and metastasis by sponging mir-149-5p and predicts tumor recurrence in hepatocellular carcinoma. Cell Physiol Biochem. 2018;51(5):2262–2274.
- Taube ET, Denkert C, Sehouli J, et al. Wilms tumor protein 1 (WT1) — not only a diagnostic but also a prognostic marker in high-grade serous ovarian carcinoma. Gynecol Oncol. 2016;140(3):494–502.
- Wang N, Tan H, Chan Y, et al. Identification of WT1 as determinant of heptatocellular carcinoma and its inhibition by Chinese herbal medicine salvia chinensis benth and its active ingredient protocatechualdehyde. Oncotarget. 2017;8(62):105848–105859.
- Cheng Y, Qiu L, He GL, et al. MicroRNA-361-5p suppresses the tumorigenesis of hepatocellular carcinoma through targeting WT1 and suppressing WNT/β-cadherin pathway. Eur Rev Med Pharmacol Sci. 2019;23:8823–8832.
- Wang Z, Tang T, Wang S, et al. Aloin inhibits the proliferation and migration of gastric cancer cells by regulating NOX2-ROS-mediated pro-survival signal pathways. Drug Des Devel Ther. 2020;14:145–155.
- Li P, Ren K, Liang YY, et al. Aloin promotes cell apoptosis by targeting HMGB1-TLR4-ERK axis in human melanoma cells. Excli J. 2020;19:641–651.