
ABSTRACT
Long non-coding RNA LIFR-AS1 is low-expressed in many cancers, but its functions in papillary thyroid carcinoma (PTC) were not defined and require further study. The relationship between LIFR-AS1 expression and clinicopathological characteristics of patients with PTC was statistically analyzed. The downregulation of LIFR-AS1 in PTC tissues and cell lines was predicted by bioinformatics analysis and verified by qRT-PCR. After overexpressing or silencing LIFR-AS1, the regulatory role of LIFR-AS1 in PTC was examined by performing MTT, colony formation, wound healing, Transwell, ELISA, tube formation and xenograft tumor experiment. MiR-31-5p and SID1 transmembrane family member 2 (SIDT2) expressions in PTC tissues or cell lines were detected by qRT-PCR, Western blot, or in situ hybridization. The relationship between miR-31-5p and LIFR-AS1/SIDT2 was predicted by LncBase, TargetScan or Pearson correlation test and then verified by Dual-Luciferase Reporter assay, RNA pull-down assay and qRT-PCR. The regulatory effect of LIFR-AS1/miR-31-5p/SIDT2 axis on the biological behaviors of PTC cells was confirmed by functional experiments and rescue experiments mentioned above. The tumor size and lymphatic metastasis were correlated with LIFR-AS1 overexpression. Overexpressed LIFR-AS1 suppressed tumorigenesis in vivo. LIFR-AS1 and SIDT2 expressions were suppressed in PTC tissues, while that of miR-31-5p was elevated in PTC tissues. LIFR-AS1 was negatively correlated with miR-31-5p. LIFR-AS1 sponged miR-31-5p to upregulate SIDT2, thereby inhibiting the viability, proliferation, migration, invasion, and the secretion of vascular endothelial growth factor (VEGF) of PTC cells and angiogenesis of human umbilical vein endothelial cells (HUVECs). This paper demonstrates that LIFR-AS1/miR-31-5p/SIDT2 axis modulated the development of PTC.
Introduction
Papillary thyroid carcinoma (PTC) is a common thyroid malignant tumor and has become one of the malignant tumors with the fastest rising incidence in many regions in recent years [Citation1,Citation2]. Surgery, the treatment with radioactive iodine-131, radiotherapy and chemotherapy are the current measures for the treatment and management for PTC, which have improved the survival rate of patients with PTC to a certain extent [Citation1,Citation3]. However, lymph node metastasis will contribute to a high malignancy of thyroid cancer in some patients, leading to the recurrence in situ and distant metastasis of the cancer [Citation4,Citation5]. Therefore, it is of great clinical significance to further study the mechanism on pathogenesis and the metastasis of cancer cell so as to improve the survival rate of patients.
It has been found that long non-coding RNA (lncRNA) exerted the regulatory effects in many diseases, including cancers, in addition to the discovery which suggested that lncRNA can be used as a therapeutic target for thyroid cancer [Citation6–8]. Fengshi et al. analyzed the expressions of genes in thyroid cancer tissues and adjacent tissues and found 23 abnormally expressed lncRNAs and mRNAs [Citation9]. Currently, only a few lncRNAs have been reported to play important roles in the pathogenesis of PTC. The expression of lncRNA SLC6A9-5:2 is implicated in the resistance of PTC to the radioactive iodine [Citation10]. LncRNA SNHG12 modulated the biological behaviors of PTC cells by regulating the Wnt/β-catenin signaling pathway [Citation11].
The role of lncRNA/microRNA (miRNA)/mRNA axis in thyroid cancer has been widely researched as well. It is believed in the competitive endogenous RNAs (ceRNAs) hypothesis that the binding of lncRNA and miRNA can prevent miRNA from binding to its target gene and allow the functioning of the target gene [Citation12]. Dongmei Wu et al. proved that lncRNA SNGH15/miR-200a-3p/YAP1 axis regulates the progression of thyroid cancer [Citation13]. Ningheng Chen et al. reported the regulatory mechanism of lncRNA GAS8-AS1/miR-135b-5p/CCDN2 axis on the cell cycle and proliferation of the PTC cell [Citation14]. Hongwei Lei et al. found that lncRNA TUG1/miR-145/ZEB1 axis is involved in the epithelial–mesenchymal transition (EMT) of PTC cells [Citation15].
Based on the preliminary predictions and experiments, we found that lncRNA LIFR-AS1 expression was down-regulated in PTC tissues. LIFR-AS1 has been shown to be low-expressed in breast cancer, non-small cell lung cancer, glioma and colorectal cancer, and regulates the biological behaviors of cancer cells through the mechanism of ceRNA [Citation16–19]. However, the role of LIFR-AS1 in PTC has not been reported. Therefore, this article probed into the pivotal role of lncRNA LIFR-AS1/miRNA/mRNA axis in PTC, so as to provide a supplementary research for the gene therapy of PTC.
Materials and methods
Sample collection
We obtained fresh paired PTC and adjacent non-tumor thyroid tissues from 52 patients with PTC who underwent surgery in Hunan Provincial People’s Hospital, First Affiliated Hospital of Hunan Normal University. All the enrolled patients have not received any anti-tumor treatment before surgery, and they all signed an informed consent in the written form. Our study was supported by the Ethics Committee of Hunan Provincial People’s Hospital, First Affiliated Hospital of Hunan Normal University (reference number: J201607019). The relationship between LIFR-AS1 expression and the clinicopathological characteristics of patients with PTC was statistically analyzed.
Cell culture
Human thyroid follicular epithelial cell line Nthy-ori3-1 (CBP61205) and human PTC cell lines TPC-1 (CBP60257), IHH-4 (CBP61201), MDA-T68 (CRL-3353) were purchased from COBIOER (http://www.cobioer.com/index.html) or American Type Culture Collection. The cells were grown in Roswell Park Memorial Institute (RPMI)-1640 medium (72,400,120, Gibco, USA) supplemented with 10% fetal bovine serum (FBS) (10,091, Gibco, USA) and 1% penicillin-streptomycin (15,140–122, Gibco, USA) in a 5% CO2 incubator (Forma Steri-Cycle, Thermo Scientific, USA) at 37°C.
Transfection
MiR-31-5p mimic (M, B01001), mimic control (MC, B04001), inhibitor (I, B03001) and inhibitor control (IC, B04003) were synthesized by GenePharma (Shanghai, China). Full-length LIFR-AS1 was synthesized by Sangon Company (https://www.sangon.com/product) and inserted into pcDNA3.1+ vector (V87020, ThermoFisher, USA) to overexpress LIFR-AS1, which was thus designated as the LIFR-AS1 overexpression vector, and an empty vector with no insertion served as a negative control. Vectors (C01001) containing short hairpin RNA targeting LIFR-AS1 (shLIFR-AS1) and its negative control vector (C03002, sh-NC) were constructed by GenePharma. Small interfering RNA (siRNA) targeting SID1 transmembrane family member 2 (siSIDT2; siG000051092B-1-5) used for the control (siNC) was purchased from Ribobio (Guangzhou, China). All the oligonucleotide sequences or vectors diluted with Opti-MEM medium (31,985,062, ThermoFisher, USA) were transfected into cells by lipofectamine 3000 (L300008, Thermo Fisher, USA) and cells were then incubated for 24 hours (h). The efficiency for the transfection was determined by quantitative reverse transcription polymerase chain reaction (qRT-PCR) or Western blot.
Cell processing and grouping
To explore the effect of LIFR-AS1 on PTC, the cells used in our experiment were divided into the following five groups: control group (PTC cells were normally cultured), sh-NC group (PTC cells were transfected with sh-NC vector), sh-LIFR-AS1 group (PTC cells were transfected with sh-LIFR-AS1 vector), NC group (PTC cells were transfected with pcDNA3.1+ vector), and LIFR-AS1 group (PTC cells were transfected with LIFR-AS1 overexpression vector).
To determine the effect of LIFR-AS1 and miR-31-5p on PTC, the cells used in our experiment was divided into the following four groups: NC + MC group (PTC cells were co-transfected with empty vector and miR-31-5p MC), NC + M group (PTC cells were co-transfected with empty vector and miR-31-5p M), LIFR-AS1 + MC group (PTC cells were co-transfected with LIFR-AS1 overexpression vector and miR-31-5p MC) and LIFR-AS1 + M group (PTC cells were co-transfected with LIFR-AS1 overexpression vector and miR-31-5p M).
To explore the effect of miR-31-5p and SIDT2 on PTC, the cells used the experiment was divided into the following four groups: siNC + IC group (PTC cells were co-transfected with siNC and miR-31-5p IC), siNC + I group (PTC cells were co-transfected with siNC and miR-31-5p I), siSIDT2 + IC group (PTC cells were co-transfected with siSIDT2 and miR-31-5p IC) and siSIDT2 + I group (PTC cells were co-transfected with siSIDT2 and miR-31-5p I).
QRT-PCR
The RNA from tissues or cells was extracted by Total RNA Extraction Kit (R1200, Solarbio, China). According to the requirements for the quantification on the expression of different genes, the reverse transcription and fluorescent quantitative PCR was performed using One-Step qRT-PCR kit (T2210, Solarbio, China) or One-Step miRNAs qRT-PCR kit (AOMD-Q020, GeneCopoeia, USA). Glyceraldehyde-3-phosphate dehydrogenase (GAPDH) and U6 were internal controls. The primers are listed in . The data were shown by Real-Time PCR Detection system (CFX96, Bio-rad, USA), and the results were normalized by the 2−ΔΔCt method [Citation20].
Table 1. Primers and RNA sequences used in this study
Cell viability
According to the instructions of 3-(4,5-dimethylthiazol-2-yl)-2,5-diphenyltetrazolium bromide (MTT) assay kit (M1020, Solarbio, China), we detected the effects of LIFR-AS1, miR-31-5p and SIDT2 on the viability of PTC cells. The cells (3 × 10³ per well of 96-well plates) were differently processed based on experimental requirements mentioned above and cultured at 37°C for 24, 48 and 72 h. The supernatant was aspirated, and 90 μL of fresh culture medium and 10 μL of MTT solution were added to the plates in sequence. After the cells were further incubated for 4 h, the supernatant was removed, and 110 μL of Formazan dissolving solution was added into the plates. The absorbance at 490 nm was read by a multi-function detector (SpectraMax5, Molecular Devices, USA).
Colony formation
Cells (200 per well of 96-well plates) in different groups were cultured within the complete medium for 10 d. After that, the cells were fixed with 4% paraformaldehyde (E672002, Sangon, China) and stained with crystal violet (E607309, Sangon, China) sequentially. The relative colony formations were observed under an optical microscope (BX53M, Olympus, Japan) and counted by ImageJ2x (Rawak Software, Germany).
Wound healing
Cells (1 × 10⁴ per well of 6-well plates) in different groups were cultured to reach about 90% confluence. The cells were cultured in the absence of serum before the commence of formal experiment. The plates were scratched by a pipette tip to create an artificial wound, and floating cells were removed by phosphate buffered solution (PBS, A610100, Sangon, China). At 0 h and 24 h, the migration rates were observed under a light microscope (100 ×) and calculated by Image J2x.
Invasion assay
Cells (2 × 10⁴ per well of 6-well plates) in different groups were resuspended in the serum-free medium and then transferred into the upper Transwell chamber precoated with Matrigel (354,480, Coring, USA), while medium containing 10% FBS was added to the corresponding lower Transwell chamber. Following the incubation of cell for 48 h, non-invaded cells were removed, while the invaded cells into the bottom of the inserts were fixed by 4% paraformaldehyde (E672002, Sangon, China) for 15 minutes (min) [Citation21] and stained with 0.1% crystal violet (C0121, Beyotime, China) for 20 min at room temperature. The invasion rates were determined using an optical microscope (250×).
Enzyme-linked immunosorbent assay (ELISA)
Human Vascular Endothelial Growth Factor (VEGF) ELISA kit (#KHG0111, ThermoFisher, USA) was applied to determine the contents of VEGF in the supernatant of PTC cells according to the instructions. Briefly, the treated cells were diluted as required and added to the 96-well plates pre-coated with anti-VEGF antibody. The detection antibody was added to the plates to bind to the immobilized antigen. After washing, streptavidin-HRP was applied to bind to the detection antibody. Subsequently, the liquid in the 96-well plate was discarded, and the color reagent was used for the color development for 10 min. Stop solution was employed to terminate the reaction. The absorbance at 450 nm was read by a multi-detection reader (SpectraMax5, Molecular Devices, USA).
Tube formation assay
Each well of 96-well plates containing 50 μL melted Matrigel (354,230, Corning, USA) was placed in an incubator for the solidification. Human Umbilical Vein Endothelial Cells (HUVECs, CBP60340, COBIOER, China) were seeded into the plate at 2 × 10⁴ cells per well. The supernatant of PTC cells transfected with different oligonucleotide sequences or vectors was incubated with HUVECs for 4 h. The branching points were observed under an optical microscope (100×) and counted by ImageJ2x.
Animals
Female BALB/c nude mice (6 wk old, 18–20 g) were purchased from Guangdong Medical Experimental Animal Center (http://www.gdmlac.com.cn/) and raised in Hunan Provincial People’s Hospital, First Affiliated Hospital of Hunan Normal University Central Animal Laboratory at the temperature of 21 ± 2 ℃ at 50% humidity. Under specific pathogen-free conditions, the mice were given free access to food and water. Animal experiments were supported by Hunan Provincial People’s Hospital, First Affiliated Hospital of Hunan Normal University Animal Ethics Committee with the reference number J201910025.
The nude mice were randomly divided into NC group and LIFR-AS1 group, with 8 mice in each group. IHH4 or TPC-1 cells (2 × 10⁶ cells for each cell) transfected with empty vector or LIFR-AS1 overexpression vector were subcutaneously injected into the right flanks of nude mice. The volume of the tumor was weekly measured. Until the fourth week, the nude mice were sacrificed by anesthetic overdose (i.e. mice received an intraperitoneal injection of pentobarbital sodium (P0500000, Merck, German) at a dose of 250 mg/kg [Citation22]). The volume and weight of the tumor were determined after the removal of the tumor.
In situ hybridization (ISH) for miR-31-5p expression
In situ hybridization for miR-31-5p was executed based on the protocol of the miRCURY LNA miRNA ISH kit (339,450, hybridization buffer, Exiqon Inc., Denmark). Briefly, 7-μm-thick formalin-fixed, paraffin-embedded tissue sections were deparaffinized, rehydrated in a descending series of ethanol, and pretreated in a microwave with citrate buffer (ab64214, Abcam, UK) at high power for 20 min. All the sections were then rinsed, kept in a humidified chamber, and prehybridized at 45°C with 1× miRCURY LNA miRNA ISH. A digoxigenin-labeled LNA-modified miR-31-5p DNA probe (339,112, Exiqon Inc., Denmark) was used at a concentration of 40 nM in hybridization buffer and hybridized at 50°C overnight. Digoxigenin-labeled probes were detected by Antidigoxigenin Fab antibody fragments conjugated with alkaline phosphatase. Images were captured under a fluorescent microscope (IX51, Olympus) under ×200 magnification following staining.
Dual-luciferase reporter assay
The relationship between miR-31-5p and LIFR-AS1/SIDT2 was predicted by LncBase (http://carolina.imis.athena-innovation.gr/diana_tools/web/index.php?r=lncbasev2%2Findex-predicted) or TargetScan (http://www.targetscan.org/vert_72/), and their relationships were confirmed by Dual-Luciferase Reporter Assay System (E1910, Promega, USA). We constructed pmirGLO-LIFR-AS1-WT, pmirGLO-LIFR-AS1-MUT, pmirGLO-SIDT2-WT, pmirGLO-SIDT2-MUT by the utilization of the pmir-GLO System (VT1439, Youbio, China). PmirGLO- LIFR-AS1-WT/pmirGLO-LIFR-AS1-MUT and miR-31-5p M/MC or pmirGLO-SIDT2-WT/pmirGLO-SIDT2-MUT and miR-31-5p M/MC were co-transfected into cells by lipofectamine 3000 reagent and then cells were incubated for 24 h. After that, the luciferase activity was measured by Cellometer Auto 2000 Cell Viability Counter (Nexcelom, USA).
RNA-Pull down assay
RNA-Pull down was analyzed by a Pierce Magnetic RNA Pull-Down Kit [Citation23,Citation24]. In short, PTC cells were plated into 6-well plates at 2 × 10⁴ cells/well and transfected with biotinylated miR-31-5p mimic for 24 h. The streptavidin-coated magnetic beads were added to the lysates of total cell to pull-down biotin-captured miR-31-5p-bound RNA complex. The mRNA expression of LIFR-AS1 was detected by qPCR.
Western blot
Western blot was performed according to the guidelines of Alegria-Schaffer et al. [Citation25]. The protein sample was extracted from IHH-4 or TPC-1 cells by Protein Extraction Kit (BC3710, Solarbio, China) and quantified by BCA kit (P0012, Beyotime, China). Then the proteins were separated by sodium dodecyl sulfate-polyacrylamide gel electrophoresis (SDS-PAGE) and transferred onto polyvinylidene fluoride membrane (ISQE00010, Solarbio, China). The membrane was blocked by 5% BSA (E661003, Sangon, China) for 1 h and then reacted with primary antibodies including those against SIDT2 (1:1000, 94 kDa, ab85847, Abcam, UK) and GAPDH (1:10,000, 36 kDa, ab181602, Abcam, UK) at 4°C overnight, followed by the incubation with secondary antibodies goat anti-rabbit (1:5000, ab6721, Abcam, UK) for 2 h. The protein bands were developed and visualized by iBright CL750 (Thermo Fisher, USA) with an ECL luminescence reagent (C510045, Sangon, China). The relative expressions of proteins were counted by ImageJ2x (Rawak Software, Germany). GAPDH was used as an internal control.
Statistical analysis
The expression of LIFR-AS1 in Thyroid Carcinoma (THCA) (n = 512) and normal samples (n = 337) was detected by The Cancer Genome Atlas (TCGA, https://cancergenome.nih.gov/). All data were analyzed by Graph Prism v8.0 (Graphpad software, California, USA) and SPSS 20.0 (SPSS, Chicago, USA) and represented as mean ± standard deviation. The chi-square test was used to assess the difference in LIFR-AS1 expression among the subgroups. Expressions of LIFR-AS1 or miR-31-5p or SIDT2 in PTC and adjacent tissues were analyzed by paired sample t test. The correlation between LIFR-AS1 and miR-31-5p was analyzed by Pearson correlation test. Differences between multiple groups were analyzed by one-way analysis of variance and Tukey was employed for pairwise comparisons between groups. P < 0.05 was accepted to be statistically significant.
Results
LIFR-AS1 expression was suppressed in PTC tissues and cell lines and modulated biological functions of PTC cells.
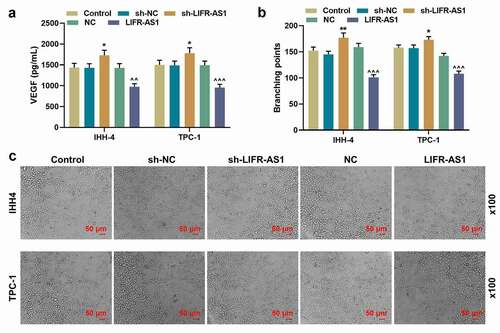
As shown in , LIFR-AS1 overexpression was correlated with both tumor size (P = 0.026) and lymphatic metastasis (P = 0.011). Based on the analysis on the expression of LIFR-AS1 in the TCGA-THCA database, we found that LIFR-AS1 expression was suppressed in THCA (), P < 0.05). Similarly, compared with adjacent tissues and human thyroid follicular epithelial cell line Nthy-ori3-1, the expression of LIFR-AS1 was downregulated in PTC tissues (), P = 0.001) and cell lines (), P < 0.001). TPC-1 and IHH-4 were selected for follow-up studies for their relatively low expression of LIFR-AS1. To explore the role of LIFR-AS1 in PTC, we transfected sh-LIFR-AS1 and LIFR-AS1 overexpression vector into cells and determined the transfection efficiency (), P < 0.01). Although, the cell viability did not change significantly at 24 h after transfection, that of sh-LIFR-AS1 group began to increase at 48 h after transfection. Meanwhile, 72 h after transfection, the cell viability of LIFR-AS1 group was significantly reduced (), P < 0.05). For cell proliferation, migration and invasion of PTC cells, the silencing on LIFR-AS1 via the transfection of sh-LIFR-AS1 promoted colony formations, migration, and invasion rates, while LIFR-AS1 exerted the opposite effects (, P < 0.01). Additionally, the content of VEGF in the supernatant of PTC cells and the angiogenesis of HUVECs was increased by sh-LIFR-AS1 but attenuated by the overexpression on LIFR-AS1 (, P < 0.05).
Table 2. Correlation of LIFR-AS1 expression with clinicopathological features in PTC
Figure 1. LIFR-AS1 expression was downregulated in PTC tissues and cell lines and it regulated cell viability and proliferation of PTC cells
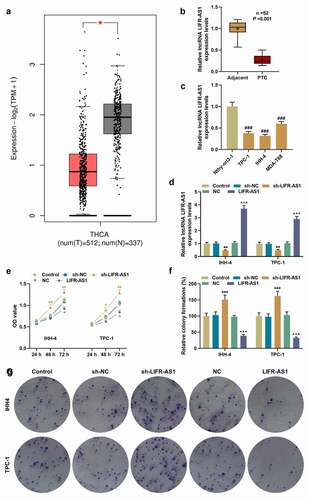
Figure 2. LIFR-AS1 regulated migration and invasion of PTC cells
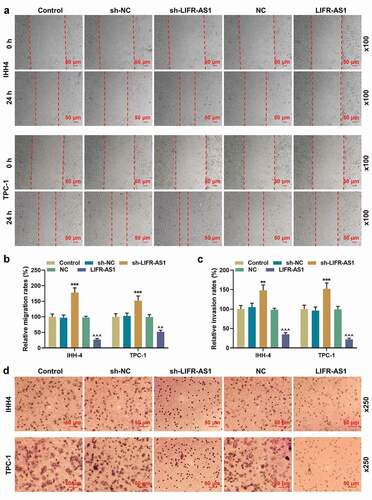
Figure 3. LIFR-AS1 regulated the content of VEGF in supernatant of PTC cells and angiogenesis of HUVECs
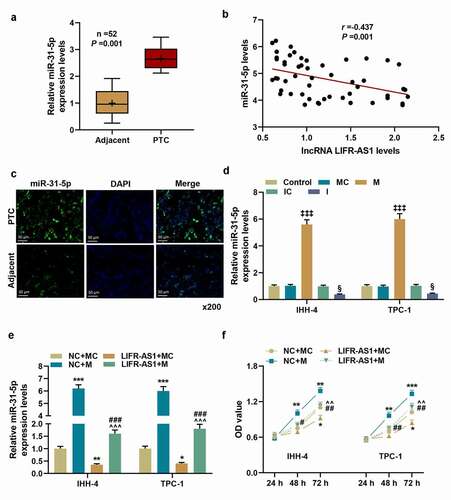
LIFR-AS1 suppressed tumorigenesis and regulated miR-31-5p expression and cell viability by targeting miR-31-5p, which was upregulated in PTC tissues.
The role of LIFR-AS1 in PTC has been then verified in vivo. Compared with NC group, the overexpression of LIFR-AS1 reduced the tumor volume and weight (, P < 0.05). The expression of LIFR-AS1 in tumor tissues of mice injected with LIFR-AS1 overexpressing cells was significantly higher than that of mice in the control group (), P < 0.01). The targeting relationship between LIFR-AS1 and miR-31-5p was predicted by bioinformatics methods ()) and verified by the dual-luciferase reporter assay (), P < 0.001) and RNA pull-down assay (), P < 0.01). In addition, the level of miR-31-5p was increased in sh-LIFR-AS1 group but was reduced in LIFR-AS1 group, pointing to their targeted relationship once again (), P < 0.01). We also found that miR-31-5p was high-expressed in PTC tissues compared with adjacent tissues (), P = 0.001). Moreover, miR-31-5p was negatively correlated with LIFR-AS1 (), r = −0.437, P = 0.001). In order to better understand miR-31-5p expression, we detected miR-31-5p expression in situ. The results showed that miR-31-5p was overexpressed in PTC group compared to adjacent group ()). To further explore the role of miR-31-5p in PTC cells, we transfected M and I of miR-31-5p and verified their transfection efficiency (), P < 0.05). The content of miR-31-5p was reduced by LIFR-AS1 overexpression and was increased by miR-31-5p M, while these effects were reversed by the co-transfection of LIFR-AS1 and miR-31-5p M (), P < 0.05). Starting from 48 h after the transfection, miR-31-5p M promoted cell viability, and 72 h after the transfection, LIFR-AS1 overexpression inhibited cell viability (), P < 0.05). The regulatory effects of miR-31-5p M and overexpressed LIFR-AS1 on cell viability were counteracted by co-transfection of LIFR-AS1 overexpression vector and miR-31-5p M (), P < 0.05).
Figure 4. LIFR-AS1 suppressed tumor progression and it targeted miR-31-5p
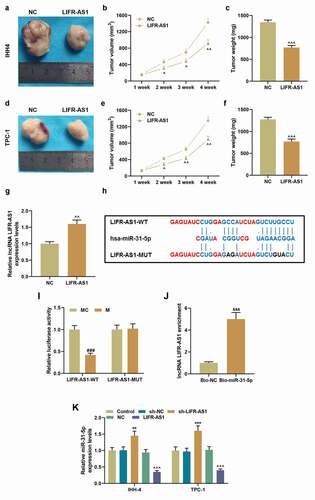
Figure 5. MiR-31-5p was highly expressed in PTC tissues and negatively regulated by LIFR-AS1, and regulation of miR-31-5p and LIFR-AS1 on cell viability
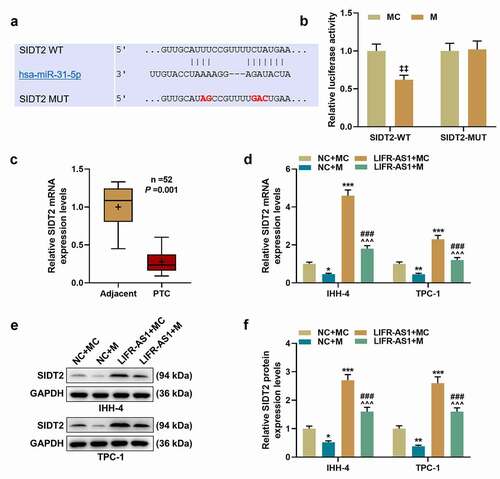
SIDT2 was the target gene of miR-31-5p and its expression was downregulated in PTC tissues and regulated by LIFR-AS1 and miR-31-5p.
We verified that SIDT2 is the target gene of miR-31-5p through bioinformatics analysis and dual-luciferase reporter assay (, P < 0.01). Also, SIDT2 was confirmed to be low-expressed in PTC tissues (), P = 0.001). The mRNA and protein levels of SIDT2 were downregulated in NC + M group but upregulated in LIFR-AS1 + MC group, whereas these regulations were neutralized by co-transfection of LIFR-AS1 overexpression vector and miR-31-5p M (, P < 0.05).
Figure 6. The targeting relationship between SIDT2 and miR-31-5p and SIDT2 expression in PTC tissues and cells
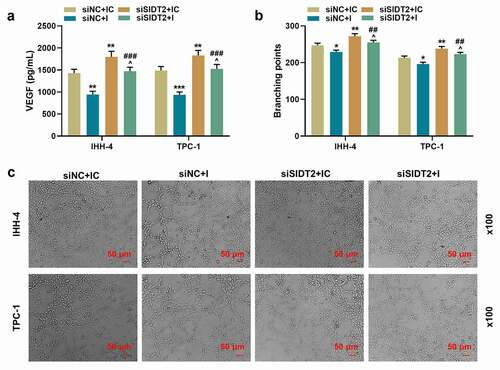
MiR-31-5p regulated cell biological functions by targeting SIDT2.
To figure out the role of SIDT2 in PTC, siSIDT2/siNC and miR-31-5p I/IC were transfected into cells. As expected, the expression of SIDT2 was upregulated by miR-31-5p I and downregulated by silencing of SIDT2, while these effects were reversed by co-transfection of siSIDT2 and miR-31-5p I (, P < 0.05). For TPC-1 cells, silencing of SIDT2 promoted cell viability at 48 h after transfection (), P < 0.01). 72 h after transfection, the viability of both cell lines was promoted by silencing of SIDT2 and inhibited by miR-31-5p I (P < 0.01). However, the effects of siSIDT2 or I on cell viability were reversed by co-transfection of siSIDT2 and miR-31-5p I (P < 0.01). The biological functions of PTC cells, including clone formation (, P < 0.01), migration (, P < 0.001), invasion (, P < 0.001), the secretion of VEGF (), P < 0.01), and the angiogenesis of HUVECs (, P < 0.05), were all suppressed by miR-31-5p I but promoted by silencing of SIDT2. Moreover, these effects were all reversed by co-transfection of siSIDT2 and I (P < 0.05).
Figure 7. Co-transfection of siSIDT2 and miR-31-5p I regulated SIDT2 expression, cell viability and proliferation
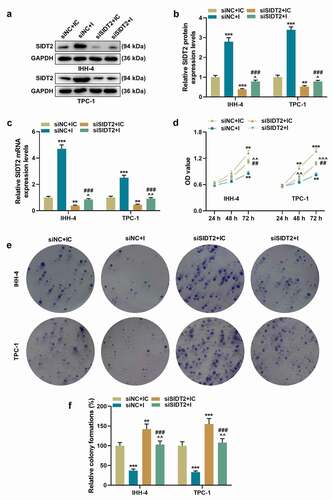
Figure 8. Co-transfection of siSIDT2 and miR-31-5p I regulated cell migration and invasion
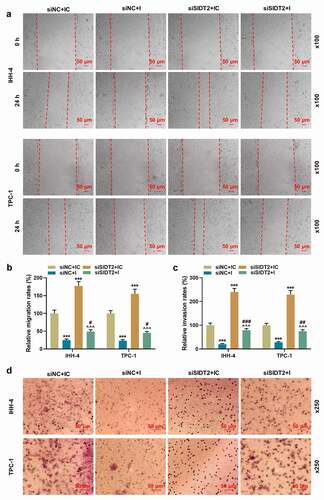
Figure 9. Co-transfection of siSIDT2 and miR-31-5p I regulated the contents of VEGF in supernatant of PTC cells and angiogenesis of HUVECs
Discussion
The crucial roles of lncRNAs in thyroid cell proliferation, carcinogenesis and metastasis allow lncRNAs to serve as potential targets for thyroid diagnosis, prognosis and targeted therapy. In our study, we proved the regulatory role of LIFR-AS1 in PTC through experiments in vivo and in vitro, and demonstrated the impact of LIFR-AS1 on the biological behaviors of PTC cells from the perspective of ceRNA.
We first discovered the low expression of LIFR-AS1 in THCA through the bioinformatics analysis, and the molecular biological experiments were employed to verify the results. To further unveil and elaborate the role of LIFR-AS1 in PTC cells, we transfected the cells with LIFR-AS1 overexpression vector and sh-LIFR-AS1 to overexpress or silence LIFR-AS1, respectively. Based on a series of functional experiments, we found that the silencing of LIFR-AS1 promoted cell viability, proliferation, migration and invasion of PTC cells, while LIFR-AS1 overexpression exerted the opposite effects to sh-LIFR-AS1.
Tumor growth, invasion and metastasis are affected by many factors, among which angiogenesis is one of the pivotal factors [Citation26]. The blood vessels within the tumors provide the nutrients for growth of the tumor, and promote the spread of the tumor [Citation27]. The proliferation and metastasis of PTC are closely related to the formation of new blood vessels [Citation28]. After the secretion by cancer cells, VEGF binds to the receptor so as to form a dimer, which could enhance the proliferation of vascular endothelial cells, promote blood vessel formation and blood vessel permeability [Citation29,Citation30]. Osamu Tohyama et al. reported that Lenvatinib inhibits the angiogenesis of tumor by blocking the VEGF signaling pathway and exerts anti-tumor activity in thyroid cancer [Citation21]. In our study, overexpressed LIFR-AS1 also suppressed the secretion of VEGF and the angiogenesis of HUVECs, suggesting that development of PTC was hindered by the overexpression of LIFR-AS1. Additionally, we conducted the nude mouse xenograft experiment, the results of which further illustrated that the overexpression of LIFR-AS1 inhibited tumor growth.
In the ceRNA hypothesis, lncRNAs adsorb miRNAs. Hence, we determined that LIFR-AS1 targets miR-31-5p. Hong Peng et al. pointed out that miR-31-5p promotes the development of colorectal cancer cells by targeting NUMB [Citation31]. A study on oral cancer showed that miR-31-5p can accelerate the growth of oral cancer cells and can be used as a therapeutic target for oral cancer [Citation32]. Furthermore, miR-31-5p can be adsorbed by LINC01234 in liver cancer cells, leading to the regulation of downstream target gene MAGEA3 on the proliferation and drug resistance of cancer cells [Citation33]. The regulatory roles of miR-31-5p in many cancers and its abnormally high expression in PTC tissues suggest the role of miR-31-5p in the development of PTC. In addition, the co-transfection of LIFR-AS1 and miR-31-5p M reversed their effects on the viability of PTC cell, indicating that LIFR-AS1 has anticancer effects on PTC by targeting miR-31-5p.
Subsequently, we identified SIDT2 as the target gene of miR-31-5p. SIDT2 is a lysosomal membrane protein, though its specific function remains unclear, it may be implicated in its the mediation on the translocation of RNA from the cytoplasm to the lysosome for degradation [Citation34]. It has been found that SIDT2 participated in the development of lung and gastrointestinal tumors through RNautophagy [Citation35]. Xin Chang et al. also identified that SIDT2 may be a prognostic marker of pancreatic ductal adenocarcinoma through bioinformatics analysis [Citation36]. In our study, SIDT2 expression was downregulated in PTC tissues. Moreover, silencing of SIDT2 promoted the biological behaviors of cancer cells and aggravated the development of tumors in PTC. These effects were reversed by co-transfection of siSIDT2 and miR-31-5p I, indicating that miR-31-5p regulated the development of PTC by targeting SIDT2.
Our research highlighted the role of LIFR-AS1 in PTC for the first time and fully clarified the mechanism of LIFR-AS1/miR-31-5p/SIDT2 axis in regulating the proliferation, migration and invasion of PTC cells and the angiogenesis of HUVECs, providing a theoretical basis for the gene therapy with PTC.
Disclosure statement
No potential conflict of interest was reported by the authors.
Additional information
Funding
References
- Raue F, Frank-Raue K. Thyroid cancer: risk-stratified management and individualized therapy. Clin Cancer Res off J Am Assoc Cancer Res. 2016 Oct 15;22(20):5012–5021. PubMed PMID: 27742787; eng.
- Lim H, Devesa SS, Sosa JA, et al. Trends in thyroid cancer incidence and mortality in the United States, 1974-2013. Jama. 2017 Apr 4;317(13):1338–1348. PubMed PMID: 28362912; eng.
- Miccoli P, Bakkar S. Surgical management of papillary thyroid carcinoma: an overview. Updates Surg. 2017 Jun;69(2):145–150. PubMed PMID: 28405952; eng.
- Sipos JA, Mazzaferri EL. Thyroid cancer epidemiology and prognostic variables. Clin Oncol (R Coll Radiol). 2010 Aug;22(6):395–404. PubMed PMID: 20627675; eng.
- Khan U, Al Afif A, Aldaihani A, et al. Patient and tumor factors contributing to distant metastasis in well-differentiated thyroid cancer: a retrospective cohort study. J Otolaryngol. 2020 Nov 16;49(1):78. PubMed PMID: 33198797; PubMed Central PMCID: PMCPMC7667857. eng.
- Peng WX, Koirala P, Mo YY. LncRNA-mediated regulation of cell signaling in cancer. Oncogene. 2017 Oct 12;36(41):5661–5667. PubMed PMID: 28604750; PubMed Central PMCID: PMCPMC6450570. eng.
- Mahmoudian-Sani MR, Jalali A, Jamshidi M, et al. Long non-coding RNAs in thyroid cancer: implications for pathogenesis, diagnosis, and therapy. Oncol Res Treat. 2019;42(3):136–142. PubMed PMID: 30799425; eng.
- Javed Z, Ahmed Shah F, Rajabi S, et al. LncRNAs as potential therapeutic targets in thyroid cancer. Asian Pac J Cancer Prev. 2020 Feb 1;21(2):281–287. PubMed PMID: 32102500; PubMed Central PMCID: PMCPMC7332117. eng.
- Shi F, Liu Y, Li M, et al. Analysis of lncRNA and mRNA transcriptomes expression in thyroid cancer tissues among patients with exposure of medical occupational radiation. Dose-resp Publ Int Horm Soc. 2019 Jul-Sep;17(3):1559325819864223. PubMed PMID: 31384241; PubMed Central PMCID: PMCPMC6661800. eng.
- Xiang C, Zhang ML, Zhao QZ, et al. LncRNA-SLC6A9-5:2: a potent sensitizer in 131I-resistant papillary thyroid carcinoma with PARP-1 induction. Oncotarget. 2017 Apr 4;8(14):22954–22967. PubMed PMID: 28086241; PubMed Central PMCID: PMCPMC5410277. eng.
- Ding S, Qu W, Jiao Y, et al. LncRNA SNHG12 promotes the proliferation and metastasis of papillary thyroid carcinoma cells through regulating wnt/β-catenin signaling pathway. Cancer Biomarkers. 2018;22(2):217–226. PubMed PMID: 29630517; eng.
- Qi X, Zhang DH, Wu N, et al. ceRNA in cancer: possible functions and clinical implications. J Med Genet. 2015 Oct;52(10):710–718. PubMed PMID: 26358722; eng.
- Wu DM, Wang S, Wen X, et al. LncRNA SNHG15 acts as a ceRNA to regulate YAP1-Hippo signaling pathway by sponging miR-200a-3p in papillary thyroid carcinoma. Cell Death Dis. 2018 Sep 20;9(10):947. PubMed PMID: 30237435; PubMed Central PMCID: PMCPMC6148237. eng.
- Chen N, Yin D, Lun B, et al. LncRNA GAS8-AS1 suppresses papillary thyroid carcinoma cell growth through the miR-135b-5p/CCND2 axis. Biosci Rep. 2019 Jan 31;39(1). DOI:https://doi.org/10.1042/bsr20181440. PubMed PMID: 30429236; PubMed Central PMCID: PMCPMC6328895. eng.
- Lei H, Gao Y, Xu X. LncRNA TUG1 influences papillary thyroid cancer cell proliferation, migration and EMT formation through targeting miR-145. Acta Biochim Biophys Sin (Shanghai). 2017 Jul 1;49(7):588–597. PubMed PMID: 28645161; eng.
- Xu F, Li H, Hu C. LIFR-AS1 modulates Sufu to inhibit cell proliferation and migration by miR-197-3p in breast cancer. Biosci Rep. 2019 Jul 31;39(7). DOI:https://doi.org/10.1042/bsr20180551. PubMed PMID: 31127025; PubMed Central PMCID: PMCPMC6614576. eng.
- Wang Q, Wu J, Huang H, et al. lncRNA LIFR-AS1 suppresses invasion and metastasis of non-small cell lung cancer via the miR-942-5p/ZNF471 axis. Cancer Cell Int. 2020;20:180. PubMed PMID: 32489316; PubMed Central PMCID: PMCPMC7245777. eng.
- Ding H, Cui L, Wang C. Long noncoding RNA LIFR-AS1 suppresses proliferation, migration and invasion and promotes apoptosis through modulating miR-4262/NF-κB pathway in glioma. Neurol Res. 2020 Oct 18:1–10. DOI:https://doi.org/10.1080/01616412.2020.1836465. PubMed PMID: 33070767; eng.
- Liu K, Yao H, Wen Y, et al. Functional role of a long non-coding RNA LIFR-AS1/miR-29a/TNFAIP3 axis in colorectal cancer resistance to pohotodynamic therapy. Biochimica Et Biophysica Acta Mol Basis Dis. 2018 Sep;1864(9Pt B):2871–2880. PubMed PMID: 29807108; eng.
- Livak KJ, Schmittgen TD. Analysis of relative gene expression data using real-time quantitative PCR and the 2(-Delta Delta C(T)) method. Methods. 2001 Dec;25(4):402–408. PubMed PMID: 11846609.
- Tohyama O, Matsui J, Kodama K, et al. Antitumor activity of lenvatinib (e7080): an angiogenesis inhibitor that targets multiple receptor tyrosine kinases in preclinical human thyroid cancer models. J Thyroid Res. 2014;2014:638747. PubMed PMID: 25295214; PubMed Central PMCID: PMCPMC4177084. eng.
- Dutton JW 3rd, Artwohl JE, Huang X, et al. Assessment of pain associated with the injection of sodium pentobarbital in laboratory mice (Mus musculus). J Am Assoc Lab Anim Sci. 2019 May 1;58(3):373–379. PubMed PMID: 30857577; PubMed Central PMCID: PMCPMC6526499. eng.
- Wang R, Zhang S, Chen X, et al. CircNT5E acts as a sponge of miR-422a to promote glioblastoma tumorigenesis. Cancer Res. 2018 Sep 1;78(17):4812–4825. PubMed PMID: 29967262; eng.
- Wang K, Long B, Liu F, et al. A circular RNA protects the heart from pathological hypertrophy and heart failure by targeting miR-223. Eur Heart J. 2016 Sep 1;37(33):2602–2611. PubMed PMID: 26802132; eng.
- Alegria-Schaffer A, Lodge A, and Vattem K Performing and optimizing Western blots with an emphasis on chemiluminescent detection . Methods Enzymol. 2009 Nov 7; 463 573–599 PubMed PMID: 19892193; eng .
- Viallard C, Larrivée B. Tumor angiogenesis and vascular normalization: alternative therapeutic targets. Angiogenesis. 2017 Nov;20(4):409–426. PubMed PMID: 28660302; eng.
- Sharma RA, Harris AL, Dalgleish AG, et al. Angiogenesis as a biomarker and target in cancer chemoprevention. Lancet Oncol. 2001 Dec;2(12):726–732. PubMed PMID: 11902514; eng.
- Rajabi S, Dehghan MH, Dastmalchi R, et al. The roles and role-players in thyroid cancer angiogenesis. Endocr J. 2019 Apr 25;66(4):277–293. PubMed PMID: 30842365; eng.
- Apte RS, Chen DS, Ferrara N. VEGF in signaling and disease: beyond discovery and development. Cell. 2019 Mar 7;176(6):1248–1264. PubMed PMID: 30849371; PubMed Central PMCID: PMCPMC6410740. eng.
- Carmeliet P. VEGF as a key mediator of angiogenesis in cancer. Oncology. 2005;69(Suppl 3):4–10. PubMed PMID: 16301830; eng.
- Peng H, Wang L, Su Q, et al. MiR-31-5p promotes the cell growth, migration and invasion of colorectal cancer cells by targeting NUMB. Biomed Pharmacothe. 2019 Jan;109:208–216. PubMed PMID: 30396078; eng.
- Lu Z, He Q, Liang J, et al. miR-31-5p is a potential circulating biomarker and therapeutic target for oral cancer. Mol Ther Nucleic Acids. 2019 Jun 7;16(471–480):471–480. PubMed PMID: 31051332; PubMed Central PMCID: PMCPMC6495075. eng.
- Chen Y, Zhao H, Li H, et al. LINC01234/MicroRNA-31-5p/MAGEA3 axis mediates the proliferation and chemoresistance of hepatocellular carcinoma cells. Mol Ther Nucleic Acids. 2020 Mar 6;19:168–178. PubMed PMID: 31838274; PubMed Central PMCID: PMCPMC6926330. eng.
- Aizawa S, Fujiwara Y, Contu VR, et al. Lysosomal putative RNA transporter SIDT2 mediates direct uptake of RNA by lysosomes. Autophagy. 2016;12(3):565–578. PubMed PMID: 27046251; PubMed Central PMCID: PMCPMC4836006. eng.
- Nguyen TA, Bieging-Rolett KT, Putoczki TL, et al. SIDT2 RNA transporter promotes lung and gastrointestinal tumor development. iScience. 2019 Oct 25;20:14–24. PubMed PMID: 31546103; PubMed Central PMCID: PMCPMC6817685. eng.
- Chang X, Yang MF, Fan W, et al. Bioinformatic analysis suggests that three hub genes may be a vital prognostic biomarker in pancreatic ductal adenocarcinoma. J Comput Biol. 2020 Nov;27(11):1595–1609. PubMed PMID: 32216644; eng.