
ABSTRACT
MLN4924 inhibits the proteolytic degradation of Cullin-Ring E3 ligase (CRL) substrates and exhibits antitumor activity toward various malignancies, including pancreatic cancer. MLN4924 suppresses tumor growth by altering various key regulator proteins; however, its impact on gene expression in tumors remains unknown. In this study, the genomic changes caused by MLN4924 in pancreatic cancer were examined by gene chip analysis and ingenuity pathway analysis. Eleven pathways were significantly altered (5 activated and 6 inhibited), 45 functions were significantly changed (21 activated and 24 inhibited), and the most activated upstream factor was predicted to be TNF. Of 691 differentially expressed genes, NAPEPLD knockdown showed synergism with MLN4924, as determined by real-time quantitative PCR and high content screening. NAPEPLD knockdown enhanced the effect of MLN4924 on inhibiting proliferation and inducing apoptosis in vitro. In a pancreatic cancer nude mouse model, MLN4924 inhibited tumor growth more significantly in the NAPEPLD knockdown group than in the control group. NAPEPLD expression was higher in pancreatic cancer tissues than in the normal pancreas but was not associated with prognosis. These findings indicate that MLN4924 causes extensive genomic changes in pancreatic cancer cells, and targeting NAPEPLD may increase the efficacy of MLN4924.
Introduction
Pancreatic cancer is one of the deadliest malignancies and is becoming an increasingly common cause of cancer mortality [Citation1]. The past decade witnessed rapid advances in surgical techniques [Citation2], as well as in adjuvant and neoadjuvant chemotherapies [Citation3,Citation4](p) [Citation5,Citation6], for pancreatic cancer to conquer this highly fatal disease. However, the 5-year survival rate of pancreatic cancer, which is 9% in the US, is still the lowest among all cancer types [Citation7]. One important factor contributing to the high mortality is the lack of effective targeted therapies, which is in contrast to the various agents that have achieved remarkable success in other tumor types, such as breast cancer [Citation8], lung cancer [Citation9], and colorectal cancer [Citation10]. The poly(adenosine diphosphate–ribose) polymerase inhibitor olaparib is a promising treatment, as indicated by the results of maintenance olaparib in prolonging the median progression-free survival of patients with metastatic pancreatic cancer compared with placebo; however, its application is limited to a small subgroup of patients with a germline BRCA1 or BRCA2 mutation [Citation11]. Therefore, novel agents targeting other pathways merit further investigation.
The ubiquitin-proteasome system (UPS) is the major pathway for nuclear and extralysosomal protein degradation, and it plays important roles in the maintenance and regulation of many essential cellular processes, including cell cycle progression, signal transduction, and cell death [Citation12]. Abnormal regulation of the UPS disrupts protein homeostasis and causes many human diseases, particularly cancer [Citation13]. The results obtained with bortezomib, the first approved general proteasome inhibitor, demonstrate that the UPS is an attractive target for antitumor therapy, as bortezomib shows efficacy in the treatment of relapsed multiple myeloma [Citation14] and mantle cell lymphoma [Citation15]. The UPS mediates protein degradation via a three-enzyme cascade catalyzed by E1, E2, and E3 enzymes [Citation16]. The multiunit Cullin-Ring ligases (CRLs) are the largest family of E3 ubiquitin ligases, and they are responsible for the ubiquitination and degradation of approximately 20% of cellular proteins [Citation17]. Activation of CRLs requires the binding of the ubiquitin-like protein neural precursor cell expressed developmentally downregulated 8 (NEDD8) to the cullins, a reversible modification called neddylationCitation18,pCitation8). This reaction includes a three-step enzymatic cascade successively catalyzed by the NEDD8-activating E1 enzymes (NAE), NEDD8-conjugating E2, and substrate-specific NEDD8-E3 ligases [Citation19].
MLN4924 (TAK-924/pevonedistat) is a highly selective first-in-class NAE inhibitor that showed potent antitumor activity in preclinical studies and has advanced into several phase II and III clinical trials for certain solid tumors and hematologic malignancies [Citation20]. MLN4924 binds to NEDD8 to form NEDD8-MLN4924 adducts in the presence of NAE, thereby blocking the enzymatic activity of NAE and inhibiting the neddylation of all cullins, leading to the disassembly and inactivation of CRL complexesCitation21,pCitation1). The subsequent accumulation of CRL substrates may trigger a series of effects, including DNA damage, cell cycle arrest, apoptosis, and senescence in cancer cellsCitation22,pCitation8,,Citation23. Several possible antitumor mechanisms of MLN4924 were proposed, including inducing DNA re-replication from the accumulation of the CRL substrate Cdt1 [Citation24] (p [Citation1]), inducing autophagy due to the accumulation of Deptor [Citation25], and suppressing AKT and mTOR signaling by upregulating REDD1 [Citation26] (p [Citation1]). Previous investigations focused on its effects on the levels of key regulator proteins; however, the comprehensive effects of MLN4924 on tumor cells suggest that it may also affect gene expression in tumor cells. In addition, certain genes might influence the efficacy of MLN4924. In this study, we examined the genomic changes caused by MLN4924 to elucidate its antitumor mechanisms and determine whether specific genes render pancreatic cancer cells more sensitive to MLN4924, with the ultimate goal of improving the efficacy of MLN4924 in the clinic. For this purpose, we performed gene chip analysis and ingenuity pathway analysis (IPA) to explore the genomic changes caused by MLN4924 in pancreatic cancer cells. Of the differentially expressed genes (DEGs) in response to MLN4924, we found that N-Acylphosphatidylethanolamine hydrolyzing phospholipase D (NAPEPLD) knockdown enhanced the sensitivity of pancreatic cancer cells to MLN4924 in vitro and in vivo.
Methods
Cell lines
The human pancreatic cancer cell lines PANC-1, AsPC-1, BxPC-3, MIA-PaCa2, and SW 1990 were purchased from ATCC. PANC-1 and MIA PaCa-2 were cultured in high-glucose Dulbecco’s modified Eagle medium (DMEM) (Gibco, Grand Island, NY, USA) supplemented with 10% fetal bovine serum (Gibco), 100 U/mL penicillin, and 100 U/mL streptomycin (Gibco) in a humidified 37°C and 5% CO2 incubator. AsPC-1, BxPC-3, and SW 1990 cells were cultured in RPMI-1640 medium (Gibco).
Cell proliferation assay
For the cell proliferation assay, 3500 cells in 100 μL aliquots were seeded in each well of a 96-well plate, and viable cells were counted at 72 h after treatment with MLN4924 at different concentrations. Cells were incubated in 10% CCK8 (Sigma-Aldrich, Shanghai, China) diluted in culture medium for an additional 4 h. To estimate viable cells and IC50 values, the absorbance at 450 nm was measured. Alternatively, cells were incubated in 20% MTT (Sigma-Aldrich, Shanghai, China) diluted in culture medium for an additional 4 h, and the absorbance was measured at 490 nm.
RNA isolation, microarray hybridization, and signal scanning
Total RNA was isolated from pancreatic cancer cell samples using the Trizol reagent (Invitrogen, Shanghai, China) following the manufacturer’s protocol. Before microarray hybridization, the RNA quality was assessed by formaldehyde agarose gel electrophoresis and quantified using a NanoDrop spectrophotometer. RNA concentrations ranged between 100 ng/mL and 1 mg/mL. A260/A280 ratio values ranged between 1.7 and 2.2.
The Affymetrix PrimeView™ Human Gene Expression Array was used to profile differentially expressed genes in pancreatic cancer cells treated with MLN4924 vs. control pancreatic cells following the manufacturer’s instructions. Briefly, total RNA was purified, reverse transcribed into cDNA, and digested into fragments with endonucleases. The fragments were labeled with DNA labeling reagent and hybridized to the microarray via incubation at 45°C with rotation at 60 rpm for 16 h (Affymetrix GeneChip Hybridization Oven 640). After washing and staining, the arrays were scanned using a GeneChip Scanner 3000 with GeneChip Operating Software (GCOS 1.4).
Data processing and Ingenuity Pathway Analysis (IPA)
The raw data preprocessing, including background correction and normalization, was performed using the RMA algorithm [Citation27]. Transcripts found to be differentially expressed (|fold change| ≥ 2, FDR ≤ 5%) were summarized in heatmaps, volcano plots, scatter plots, and hierarchical clustering. The IPA system (Ingenuity Systems; Qiagen China Co., Ltd.) was used for subsequent bioinformatics analyses, including canonical pathway analysis, disease and function, regulator effects, upstream regulators, and molecular networks. The activation z-score and overlapping p-value were calculated as described previously [Citation28].
High Content Screening (HCS)
After identifying differentially expressed genes, RNAi sequences targeting selected genes were transfected into AsPC-1 cells using a lentiviral vector containing GFP tags to monitor cell viability. MLN4924 and the control solvent were added on the day of transfection. Cells were cultured and observed for 5 days using a Celigo imaging cytometer. The ratios of the viability of knockdown cells treated with solvent to that of knockdown cells treated with MLN4924, and the ratio of the viability of shCtr cells treated with MLN4924 to that of knockdown cells treated with MLN4924 were calculated to evaluate the synergism of certain gene and MLN4924. For assays using mixed shRNAs, both ratios ≥1.50 indicated that knocking-down specific genes acts synergistically with MLN4924. For assays using single shRNAs, the shRNAs with both ratios ≥1.20 were selected for further experiments.
Cell apoptosis assay
Apoptosis was measured by using the Annexin V-APC Kit (eBioscience) at 72 h after treatment with MLN4924. Briefly, the cells were harvested with trypsin, washed twice with ice-cold PBS, and resuspended in 1 × binding buffer. Then, 10 µL of Annexin V-APC was added into 200 µL of cell suspension. After incubation for 15 min, the population study of the target cohort was performed with a FACS Aria II flow cytometer (BD Bioscience).
Propidium iodide staining and flow cytometric analysis
Cells were fixed with 75% ethanol at 4°C for at least 1 h, stained with propidium iodide containing RNase at 37°C for 15 min, and then analyzed for cell-cycle progression with the Accuri C6Plus (BD Bioscience). Data were analyzed with ModFit LT software.
RNAi using siRNA and shRNA
The GV115 lentiviral vectors were designed and constructed by GeneChem Co., Ltd. (Shanghai, China). The human NAPEPLD siRNA target sequence was CAGTGCTTAAGCCATATTT. The GV115 lentiviral vectors were used as controls. Transfected clones for NAPEPLD were validated by qPCR and Western blot analysis. ShRNA interference was used to decrease target gene expression according to the methods described previously [Citation29]. To increase the efficiency of RNA interference, three shRNAs were first designed for each gene, and three plasmids carrying different shRNAs were mixed in equal proportions for lentivirus packaging. For positive genes, each single shRNA was tested separately. The shRNA sequences are shown in Table S1. Interference plasmids were constructed using the GV115 vector.
Quantitative real-time PCR
Standard cDNA synthesis reactions were performed using the M-MLV Reverse Transcriptase kit (Promega, Shanghai, China) following the manufacturer’s instructions. For qRT-PCR analysis, reverse transcribed products were amplified using SYBR Premix Ex Taq (TaKaRa, Shanghai, China). PCR reactions were carried out using the ABI 7500 Real-Time PCR system (Applied Biosystems, CA, USA) and repeated three times. Relative mRNA levels were normalized to GAPDH, and the relative expression of transcripts was analyzed using the 2− ΔΔCt method. The following primers were used: human NAPEPLD (gene accession no. NM_198990): 5′-CCTCCAATAGATGCGGTCCTTA-3′ (forward) and TCAATCACATTCTCACAGCCAC-3′ (reverse); human GAPDH: 5′-TGACTTCAACAGCGACACCCA-3′ (forward) and 5′-CACCCTGTTGCT GTAGCCAAA-3′ (reverse). The primers for other genes are shown in Table S2.
Caspase-3/7 activity
Caspase-3/7 activity was measured using the Caspase-Glo 3/7 assay (Promega) according to the manufacturer’s instructions. Briefly, cells were incubated in the presence or absence of MLN4924 (300 nM) for 72 h. After incubation, cells were recounted, and the same numbers of cells were resuspended in 100 µL of culture medium. An equal volume of Caspase-Glo® 3/7 reagent was added, and the culture was further incubated for 3 h at 37°C in a CO2 incubator. The luminescence was measured using a Tecan infinite (M2009PR) microplate reader.
Western blot analysis
Total proteins extracted with cell lysate buffer containing protease inhibitors were separated using 10% sodium dodecyl sulfate-polyacrylamide gel electrophoresis (SDS-PAGE) and electrotransferred onto polyvinylidene difluoride membranes (Millipore, Billerica, MA, USA). Membranes were incubated with primary antibodies against NAPEPLD (1:200, ab133181, Abcam, CA, USA) and β-actin (1:2000, sc-69,879, Santa Cruz, Texas, USA) overnight after blocking with 5% nonfat milk in TBS-T. Protein expression was detected with the Image System using Tanon 5200 (Tanon, Shanghai, China).
Immunohistochemical analysis
For the examination of NAPEPLD, a tissue microarray was constructed following the standard tissue protocols as described previously [Citation30]. The slides were incubated overnight with primary antibody (caspase-3 1:50, #9661, CST; cleaved caspase-3 1:50, ab255818, Abcam; NAPEPLD 1:100, ab133181, Abcam), followed by incubation with the secondary antibody. The staining was measured by a computerized image system including a Leica-CCD camera connected to a Leica-DM-IRE2 microscope. Pictures of representative fields were captured by the Leica QWin Plus v3 software. The expression score was defined as the sum of staining intensity (0 for negative, 1 for weak, 2 for moderate, and 3 for strong) and the fraction of stained cells (0 for negative, 1 for 1–25%, 2 for 26–50%, 3 for 51–75%, and 4 for 76–100%). A score <4 was considered low expression, and a score ≥4 was considered high expression.
In vivo antitumor study
This study was approved by the Animal Ethics Committee of Fudan University, and all animals were maintained and used in accordance with the guidelines of the Institutional Animal Care and Use Committee of Fudan University and the National Institutes of Health guide for the care and use of Laboratory animals. Female nude mice (BALB/c) aged 4 weeks were purchased from Beijing Vital River Laboratory Animal Technology Co. Ltd. AsPC-1 cells (5 × 10⁶) were inoculated subcutaneously into the right flank of nude mice. Tumor-bearing mice were grouped as follows: mice with normal control cells were treated with 50 µL of 300 nM MLN4924 every 3 days via intratumor injection five times (NC treatment group), and mice with NAPEPLD-knockdown cells were treated at the same dosage (KD treatment group). Mice were weighed, and tumor length and width were measured twice a week. Tumor volume was estimated with the following formula: π/6×L × W × W. All mice were sacrificed 6 weeks later.
Patient specimens and follow-up
Between January 12, 2012 and March 3, 2017, the same pancreatic surgical group in our hospital performed radical resection for pancreatic cancer on 90 consecutive patients. Overall survival (OS) was defined as the interval between the date of surgery and death or the last follow-up day. The last follow-up day was November 1st., 2020. None of the patients received any preoperative treatment, and all the patients received a postoperative chemotherapeutic regimen of six cycles of standard gemcitabine.
Statistical analysis
SPSS 24.0 (Chicago, IL, USA) was used for statistical analysis. Data from individual experiments were averaged and presented as the mean ± SD. The Student’s t-test and ANOVA were used to compare quantitative variables. The expression scores of the IHC experiment were compared using Student’s t-test. Kaplan–Meier analysis was used to determine survival, and the log-rank test was used to compare the survival of patients. Cox proportional hazards model analysis was conducted to calculate HR and 95% CI in the univariate and multivariate analysis.
Results
Identification of DEGs in pancreatic cancer cells exposed to MLN4924
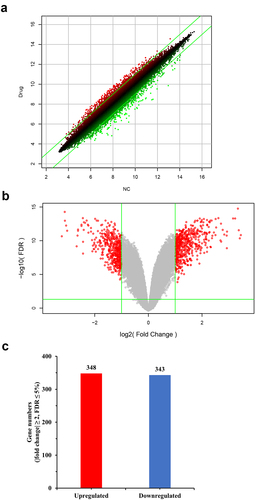
First, we examined the sensitivities of five pancreatic cancer cell lines to MLN4924 (data not provided), and selected the two most sensitive cell lines (AsPC-1 and MIA-PaCa2) for further experiments. Genome-wide gene expression analysis was performed to identify DEGs between AsPC-1 cells treated with MLN4924 (6.25 µM for 72 h) and control AsPC-1 cells. A total of 691 DEGs were identified, including 348 upregulated genes and 343 downregulated genes ()). The detailed information on DEGs is shown in Table S3.
Figure 1. Microarray results determined using Affymetrix GeneChip PrimeView Human Gene Expression arrays. (a) Scatter plot of DEGs in AsPC-1 cells exposed to MLN4924. Each dot marks a specific gene, and the x-coordinate and y-coordinate stand for the signaling strength of the probe in the NC group and drug group respectively. The red dots mark genes that were relatively up-regulated in cells exposed to MLN4924, while green dots mark genes that were relatively up-regulated in control cells. (b) Volcano plot of DEGs in AsPC-1 cells exposed to MLN4924. The significantly changed genes are marked in red. The chosen thresholds were a |fold change| ≥ 2 and a FDR ≤ 5%. (c) Number of DEGs in AsPC-1 cells exposed to MLN4924.
IPA analysis of DEGs in pancreatic cancer cells exposed to MLN4924
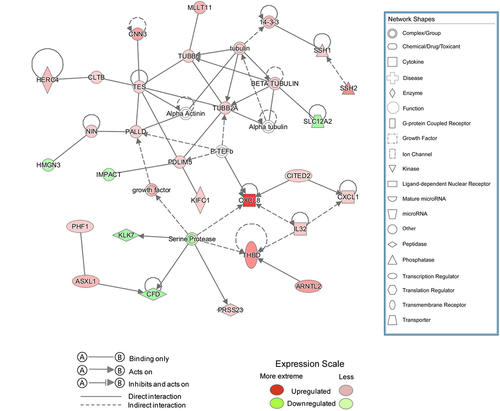
IPA was used to analyze the gene expression changes caused by MLN4924, and 62 altered signaling pathways were identified (Table S4). Eleven pathways were significantly altered (five activated and six inhibited) ()). Of 405 functions that were altered in AsPC-1 cells (Table S5), 45 were significantly changed (21 activated and 24 inhibited) (). Of 1921 upstream factors involved in regulating DEGs in pancreatic cancer cells exposed to MLN4924, 278 regulators were significantly changed (225 activated and 53 inhibited, Table S6), and tumor necrosis factor (TNF) was predicted to be the most activated upstream regulator ()). The regulatory effect analysis map shows the possible pathways of the upstream regulatory networks and the downstream functions involving the identified DEGs () and Table S7). Interaction network analysis revealed interactions between molecules in datasets ( and Table S8).
Figure 2. Canonical pathway and function analysis based on information from the Ingenuity Pathways Knowledge Base. (a) 11 significantly altered canonical pathways. The chosen thresholds were a |fold change| ≥ 2 and p < 0.05. A z-score ≥ 2 indicates significant activation of the pathway, and a z-score ≤ −2 indicates significant inhibition. The ratio of DEGs to the total genes of the pathway is also marked. (b) Functions significantly down-regulated due to MLN4924 exposure. The chosen thresholds were a z-score ≥ 2 and p < 0.05. (c) Functions significantly up-regulated due to MLN4924 exposure. The chosen thresholds were a z-score ≤ −2 and p < 0.05.
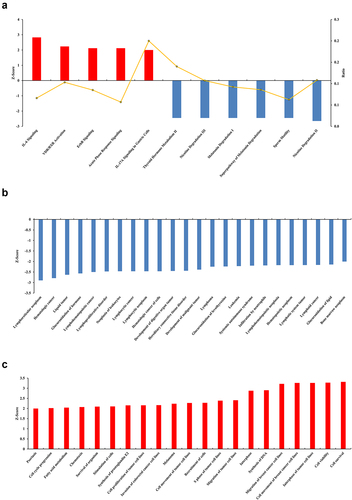
Figure 3. Upstream analysis and regulatory effect analysis based on information from the Ingenuity Pathways Knowledge Base. (a) Upstream analysis shows that tumor necrosis factor (TNF) as the most activated upstream regulator and its downstream targets. The chosen thresholds were a |z-score| ≥ 2 and p < 0.05. (b) The regulatory effect analysis map shows the possible pathways of upstream regulatory networks and downstream functions involving the DEGs. Genes that are up- or down-regulated are labeled in red and green, respectively. Orange line indicates that TNF is predicted to lead to the activation of its downstream molecule, blue line indicates that TNF is predicted to lead to the inhibition of its downstream molecule, yellow line indicates that findings are inconsistent with the state of the downstream molecule, and gray line indicates that no data exists regarding the state of the downstream molecule.
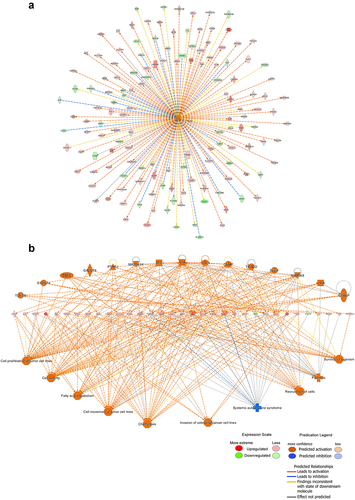
Figure 4. Interaction network analysis based on information from the Ingenuity Pathways Knowledge Base. The interaction network graph shows the interactions among molecules in datasets. Genes that are up- or down-regulated are labeled in red and green, respectively.
Confirmation of microarray analysis results by RT-qPCR and HCS
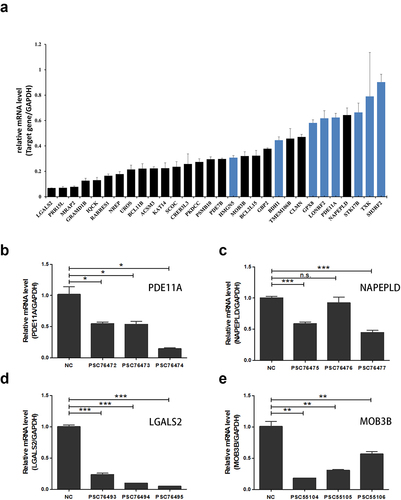
We selected 30 downregulated DEGs related to the UPS pathway, DNA damage repair pathway, immune responses, or chemosensitivity based on the current literature. The reliability of the gene chip data was confirmed by RT-qPCR, and 22 genes were confirmed to have significantly reduced mRNA levels ()). For RNAi experiments, three shRNAs were designed for each gene, and plasmids containing the three different shRNAs were packaged equally into lentiviruses to ensure knockdown efficiency. The results of HCS showed that the following five genes might act synergistically with MLN4924: LGALS2, MOB3B, PDE11A, NAPEPLD, and CLMN (). The knockdown effects of single shRNAs for each gene (CLMN was dismissed because of relative low synergism scores) were confirmed by RT-qPCR (), and the synergism with MLN4924 was evaluated by HCS (). The results showed that shNAPEPLD (psc76477) showed synergism with MLN4924.
Table 1. The synergism of knocking down target genes using mixed shRNAs and MLN4924
Table 2. The synergism of knocking down target genes using single shRNAs and MLN4924
Figure 5. Knockdown effects of target genes using single shRNAs. (a) RT-qPCR analysis showed that 22 (black columns) of the 30 selected down-regulated DEGs were confirmed to to have significantly reduced mRNA levels. (b-e) RT-qPCR analysis verified the knockdown effects of single shRNAs for PDE11A, NAPEPLD, LGALS2, MOB3B, respectively. *, P < 0.05; **, P < 0.01; ***, P < 0.001; n.s., not significant.
NAPEPLD knockdown increases the sensitivity of pancreatic cancer cells to MLN4924
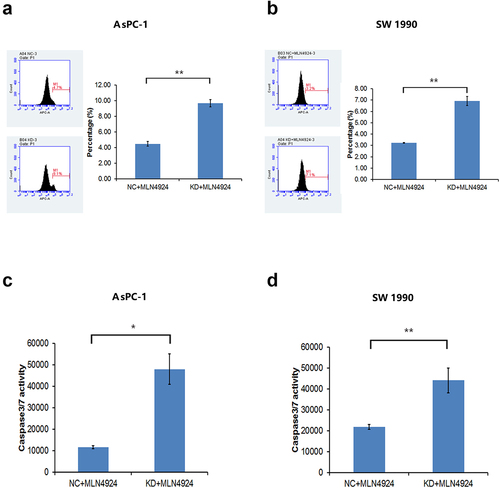
After verifying the effective knockdown of NAPEPLD in both pancreatic cancer cell lines (), we confirmed that the effect of MLN4924 on inhibiting cell proliferation was stronger in NAPEPLD knockdown cells than in control cells (). FACS analysis showed that NAPEPLD knockdown increased the number of cells arrested in S phase after treatment with MLN4924 (). FACS and the caspase-3/7 assay showed that apoptosis induced by MLN4924 was increased in NAPEPLD knockdown cells than in control cells ().
Figure 6. NAPEPLD knockdown Enhances the sensitivity of pancreatic cancer cells to MLN4924. (a, b) RT-qPCR and Western blots confirmed the effective knockdown of NAPEPLD in both AsPC-1 and SW 1990 cells. (c, d) MTT assay showed that MLN4924 inhibited the growth of NAPEPLD knockdown cells more strongly than control cells. (e, f) FACS analysis showed that the number of cells in the S phase was increased in NAPEPLD knockdown cells compared to control cells when treated with MLN4924. *, P < 0.05; **, P < 0.01; ***, P < 0.001.
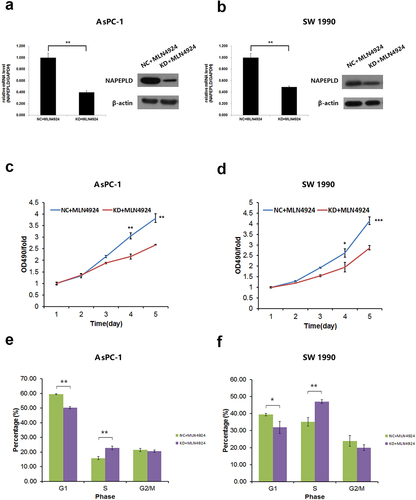
Figure 7. NAPEPLD knockdown increased the apoptosis caused by MLN4924 in pancreatic cancer cells. (a, b) FACS analysis showed that the percentage of apoptotic cells was increased in NAPEPLD knockdown cells when treated with MLN4924. (c, d) Caspase 3/7 assay showed that the percentage of apoptotic cells was increased in NAPEPLD knockdown cells when treated with MLN4924.
NAPEPLD knockdown increases the sensitivity of AsPC-1 cells to MLN4924 in vivo
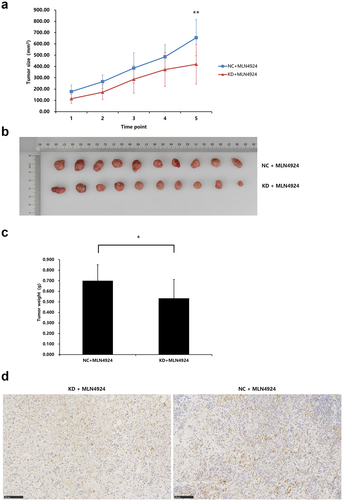
AsPC-1 cells infected with NAPEPLD-lentivirus (KD) or control-lentivirus (NC) were injected subcutaneously into the left flanks of 5-week-old mice (n = 6/each group). Both groups were treated with MLN4924 for 5 days. After 2 weeks, the mice were sacrificed, and the tumors were dissected and weighed. As shown in , MLN4924-mediated inhibition of tumor growth was more significant in the KD group than in the NC group. We also evaluated the expression of cleaved caspase-3 and caspase-3 in the resected tumors and found that the expression of cleaved caspase-3 was higher in the KD group than the NC group ()), while the expression of caspase-3 was similar in both groups.
Figure 8. NAPEPLD knockdown Enhanced the sensitivity of AsPC-1 cells to MLN4924 in xenograft tumor model. 5 × 10⁶ AsPC-1 cells were inoculated subcutaneously in the right flank of nude mice. Tumor-bearing mice were grouped as follows: mice with normal control cells and treated with 50 ul of 300 nM MLN4924 every three days via intratumor injection for 5 times (NC + MLN4924 group), and mice with cells knocked down for NAPEPLD and treated at the same dosage (KD + MLN4924 group). (a) The tumor growth curve of two groups. The average size of NAPEPLD-knockdown tumors was lower compared with the control group (b) Tumors were resected at the end of the study. (c) The average weight of NAPEPLD-knockdown tumors was lower compared with the control group. (d) Representative IHC staining of cleaved caspase-3 in the resected tumors in the KD group (left) and NC group (right). *, P < 0.05; **, P < 0.01.
NAPEPLD is overexpressed in pancreatic cancer
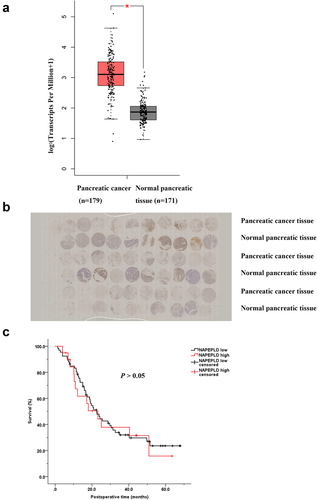
First, we analyzed the RNA sequencing expression data of NAPEPLD using GEPIA [Citation31], a web server comprising data from the TCGA and the GTEx projects, and found that NAPEPLD was upregulated in pancreatic cancer ()). Then, we analyzed the expression levels of NAPEPLD in pairs of pancreatic cancer and normal pancreatic tissues from our hospital. The clinicopathological features of 90 pancreatic cancer patients are listed in . A representative IHC image is shown in ). NAPEPLD expression scores were higher in pancreatic cancer tissues than in the normal pancreas (p < 0.05). Analysis of the prognosis of patients with pancreatic cancer with different NAPEPLD expression levels ()) showed that there was no significant difference in survival between pancreatic cancer patients with low NAPEPLD expression and those with high NAPEPLD expression (median survival, 22.4 vs. 23.2 months, p > 0.05). Univariate and multivariate analysis revealed that NAPEPLD was not a significant prognostic factor ().
Table 3. Clinicopathological features of 90 pancreatic cancer patients
Table 4. Univariate and multivariate analyses of prognostic factors in patients with pancreatic cancer
Figure 9. NAPEPLD was overexpressed in pancreatic cancer tissues. (a) NAPEPLD was overexpressed in pancreatic cancer compared to normal pancreatic tissues according to the RNA sequencing expression data from the TCGA and the GTEx projects using a standard processing pipeline. (b) Representative IHC staining of tissue microarray with paired pancreatic cancer and normal pancreatic tissues. (c) The survival curves of patients with pancreatic cancer of low NAPEPLD expression and of high NAPEPLD expression. *, P < 0.05.
Discussion
In the time of precision medicine, the arsenal of targeted therapies for pancreatic cancer is limited compared with that of other cancers. Therefore, there is an urgent need to identify new agents for this dismal disease. After bortezomib was approved by the FDA for the treatment of relapsed and refractory multiple myeloma in 2003, targeting the UPS pathway emerged as a promising strategy for the treatment of cancer. Because of significant Grade 3/4 toxicities and lack of efficacy in solid tumors [Citation32], second-generation proteasomal inhibitors, including more selective inhibitors, were developed to target the UPS in solid cancers. MLN4924, a highly selective first-in-class NAE inhibitor, showed promising antitumor activity against pancreatic cancer in vitro and in vivo in our previous study [Citation33]. Because of the potentially strong effects of CRL inhibition, the exact antitumor mechanism of MLN4924 remains unclear. In this study, we examined the genomic changes caused by MLN4924 in pancreatic cells using a gene chip array and IPA analysis, and found that MLN4924 affects the expression of a wide spectrum of genes. Of the DEGs identified in response to MLN4924, we focused on NAPEPLD because its knockdown increased the sensitivity of pancreatic cancer cells to MLN4924. In addition, NAPEPLD is overexpressed in human pancreatic cancer tissues, and its overexpression is correlated with poor survival.
MLN4924 is a protein neddylation inhibitor that functions at the post-transcriptional level, resulting in the accumulation of CRL substrates, which in most cases have not been identified. Liao et al [Citation34]. used stable isotope labeling with amino acids in cell culture (SILAC) to analyze A375 melanoma cells treated with MLN4924 and identified 120 upregulated proteins under stringent criteria. Gene expression profiling of the 120 stabilized proteins showed that in 28 of these proteins, mRNA levels were significantly increased by at least twofold by MLN4924. To date, there is no published study that comprehensively describes the genomic changes caused by MLN4924. Considering the complexity of the gene regulatory network, which involves many proteins, MLN4924 may have a considerable impact on gene expression in tumor cells. Of particular note is that many transcription factors, including c-Jun [Citation35], c-Myc [Citation36], HIF1α[Citation37], and Nrf2 [Citation38] (p [Citation2]), are CRL substrates. In this study, we showed that MLN4924 upregulated or downregulated the expression of 691 genes involved in various processes. IPA analysis showed that the most activated pathway was IL-6 signaling, and the most inhibited pathway was nicotine degradation II. Many studies reported that MLN4924 inhibits IL-6 production [Citation39–41], suggesting that the genes identified in this study are likely to be activated directly by transcription factors accumulated in response to MLN4924. In addition, for each pathway, the ratio of DEGs to the total genes of the pathway was relatively low (>20%), and upstream factor analysis identified as many as 278 altered regulators, supporting that MLN4924 functions through individual transcriptional regulation rather than acting on specific signaling molecules. In terms of functions, 15 of the 24 inhibited functions were related to hematological malignancies, which may explain the good results that MLN4924 achieved toward hematological malignancies. The two most activated functions were cell viability and cell survival. This unexpected effect could be attributed to the accumulation of Nrf2, an essential transcription factor that enhances the expression of multiple cytoprotective genesCitation42,pCitation2). Further investigation is warranted to clarify the cell protective effects and mechanisms of MLN4924.
We explored whether DEGs could increase the efficacy of MLN4924 through RNAi, HCS, and functional experiments. The results showed that NAPEPLD knockdown increased the sensitivity of AsPC-1 cells to MLN4924 both in vitro and in vivo. NAPEPLD is a membrane-bound phospholipase D-type enzyme that catalyzes the release of NAEs from their corresponding N-acyl-phosphatidylethanolamines (NAPEs) upon sitmulation [Citation43]. NAEs are a class of endogenous lipid mediators, of which anandamide (N-arachidonoylethanolamine) is the most extensively characterized NAE and is involved in regulation of appetite, energy homeostasis, and synaptogenesis [Citation44,Citation45]. Anandamide functions as an endogenous ligand of cannabinoid receptors and transient receptor potential vanilloid 1 (TRPV1) channels, whereas other NAEs are involved in various biological functions by activating non-cannabinoid receptors, including peroxisome proliferator-activated receptor (PPAR)-α, GPR55 or GPR119 [Citation46,Citation47]. Although previous studies showed that NAPEPLD plays a key role in lipid metabolism [Citation47,Citation48], its involvement in cancer has not been reported to date. It is reasonable to speculate that NAPEPLD knockdown alters the level of NAEs, which act on receptors such as PPARγ[Citation49], leading to enhanced MLN4924 sensitivity; however, exploring the underlying mechanism is beyond the scope of this study. Online databases and our ICH results showed that NAPEPLD is overexpressed in pancreatic cancer compared with normal pancreatic tissues, which may be related to the tumorigenesis of pancreatic cancer. From a therapeutic perspective, overexpressed NAPEPLD may promote the resistance of pancreatic cancer to MLN4924, suggesting that the combination of MLN4924 and NAPEPLD inhibitors [Citation50,Citation51] could be effective in selected patients.
In conclusion, this study comprehensively analyzed the genomic changes caused by MLN4924 in pancreatic cancer cells for the first time, and the results support further investigation of the underlying mechanisms. NAPEPLD knockdown increased the sensitivity of pancreatic cancer cells to MLN4924 in vitro and in vivo, which indicates that the efficacy of combination therapy with MLN4924 and NAPEPLD inhibitors in selected patients should be explored further.
Notes on Contributions
J.L. and W.M. conceived the study; J.L., W.M., and Y.R. performed the experiments and gave critical suggestions; Y.R. performed data acquisition and analyses; Z.L. provided analyses and interpretation of the data; J.L. wrote the original manuscript draft; T.K. provided technical and material support; and W.L. revised the manuscript and supervised the study. All authors read and approved the final manuscript.
Ethics statement
The study was approved by the Zhongshan Hospital Research Ethics Committee and informed consent was obtained from all patients. The study was conducted in accordance with the Helsinki declaration.
Acknowledgments
This work was supported by the National Natural Science Foundation of China [grant number 81773068].
Data availability statement
The authors confirm that the data supporting the findings of this study are available within the article and its supplementary materials.
Disclosure statement
No potential conflict of interest was reported by the author(s).
Additional information
Funding
References
- Mizrahi JD, Surana R, Valle JW, et al. Pancreatic cancer. Lancet. 2020;395(10242):2008–2020.
- Hackert T, Klaiber U, Pausch T, et al. Fifty Years of Surgery for Pancreatic Cancer. Pancreas. 2020;49(8):1005–1013.
- Conroy T, Desseigne F, Ychou M, et al. FOLFIRINOX versus Gemcitabine for Metastatic Pancreatic Cancer. N Engl J Med. 2011;364(19):1817–1825.
- Von Hoff DD, Ervin T, Arena FP, et al. Increased Survival in Pancreatic Cancer with nab-Paclitaxel plus Gemcitabine. N Engl J Med. 2013;369(18):1691–1703.
- Gemenetzis G, Groot VP, Blair AB, et al. Survival in Locally Advanced Pancreatic Cancer After Neoadjuvant Therapy and Surgical Resection. Ann Surg. 2019;270(2):340–347.
- Murphy JE, Wo JY, Ryan DP, et al. Total Neoadjuvant Therapy With FOLFIRINOX in Combination With Losartan Followed by Chemoradiotherapy for Locally Advanced Pancreatic Cancer: a Phase 2 Clinical Trial. JAMA Oncol. 2019;5(7):1020–1027.
- Siegel RL, Miller KD, Jemal A. Cancer statistics, 2020. CA Cancer J Clin. 2020;70(1):7–30.
- Romond EH, Perez EA, Bryant J, et al. Trastuzumab plus Adjuvant Chemotherapy for Operable HER2-Positive Breast Cancer. N Engl J Med. 2005;353(16):1673–1684.
- Shepherd FA, Rodrigues Pereira J, Ciuleanu T, et al. Erlotinib in Previously Treated Non–Small-Cell Lung Cancer. N Engl J Med. 2005;353(2):123–132.
- Jonker DJ, O’Callaghan CJ, Karapetis CS, et al. Cetuximab for the Treatment of Colorectal Cancer. N Engl J Med. 2007;357(20):2040–2048.
- Golan T, Hammel P, Reni M, et al. Maintenance Olaparib for Germline BRCA-Mutated Metastatic Pancreatic Cancer. N Engl J Med. 2019;381(4):317–327.
- Nawrocki ST, Griffin P, Kelly KR, et al. MLN4924: a novel first-in-class inhibitor of NEDD8-activating enzyme for cancer therapy. Expert Opin Investig Drugs. 2012;21(10):1563–1573.
- Zhao Y, Cullin-RING SY. Ligases as attractive anti-cancer targets. Curr Pharm Des. 2013;19(18):3215–3225.
- Richardson PG, Sonneveld P, Schuster MW, et al. Bortezomib or High-Dose Dexamethasone for Relapsed Multiple Myeloma. N Engl J Med. 2005;352(24):2487–2498.
- Robak T, Huang H, Jin J, et al. Bortezomib-Based Therapy for Newly Diagnosed Mantle-Cell Lymphoma. N Engl J Med. 2015;372(10):944–953.
- Berndsen CE, Wolberger C. New insights into ubiquitin E3 ligase mechanism. Nat Struct Mol Biol. 2014;21(4):301–307.
- Lan H, Tang Z, Jin H, et al. Neddylation inhibitor MLN4924 suppresses growth and migration of human gastric cancer cells. Sci Rep. 2016;6(1):24218.
- Duda DM, Borg LA, Scott DC, et al. Structural insights into NEDD8 activation of cullin-RING ligases: conformational control of conjugation. Cell. 2008;134(6):995–1006.
- Zhao Y, Morgan MA, Sun Y. Targeting Neddylation pathways to inactivate cullin-RING ligases for anticancer therapy. Antioxid Redox Signal. 2014;21(17):2383–2400.
- Ferris J, Espona-Fiedler M, Hamilton C, et al. Pevonedistat (MLN4924): mechanism of cell death induction and therapeutic potential in colorectal cancer. Cell Death Discov. 2020;6(1):1–14.
- Brownell JE, Sintchak MD, Gavin JM, et al. Substrate-assisted inhibition of ubiquitin-like protein-activating enzymes: the NEDD8 E1 inhibitor MLN4924 forms a NEDD8-AMP mimetic in situ. Mol Cell. 2010;37(1):102–111.
- Soucy TA, Smith PG, Milhollen MA, et al. An inhibitor of NEDD8-activating enzyme as a new approach to treat cancer. Nature. 2009;458(7239):732–736.
- Lin JJ, Milhollen MA, Smith PG, et al. NEDD8-targeting drug MLN4924 elicits DNA rereplication by stabilizing Cdt1 in S phase, triggering checkpoint activation, apoptosis, and senescence in cancer cells. Cancer Res. 2010;70(24):10310–10320.
- Milhollen MA, Narayanan U, Soucy TA, et al. Inhibition of NEDD8-activating enzyme induces rereplication and apoptosis in human tumor cells consistent with deregulating CDT1 turnover. Cancer Res. 2011;71(8):3042–3051.
- Luo Z, Yu G, Lee HW, et al. The Nedd8-Activating Enzyme Inhibitor MLN4924 Induces Autophagy and Apoptosis to Suppress Liver Cancer Cell Growth. Cancer Res. 2012;72(13):3360–3371.
- Gu Y, Kaufman JL, Bernal L, et al. MLN4924, an NAE inhibitor, suppresses AKT and mTOR signaling via upregulation of REDD1 in human myeloma cells. Blood J Am Soc Hematol. 2014;123(21):3269–3276.
- Irizarry RA, Hobbs B, Collin F , et al. Exploration, normalization, and summaries of high density oligonucleotide array probe level data. Biostatistics. 2003;4(2):249–264.
- Krämer A, Green J, Pollard J, et al. Causal analysis approaches in Ingenuity Pathway Analysis. Bioinformatics. 2014;30(4):523–530.
- Nabzdyk CS, Chun M, Pradhan L, et al. High throughput RNAi assay optimization using adherent cell cytometry. J Transl Med. 2011;9(1):48.
- Dima SO, Tanase C, Albulescu R, et al. An exploratory study of inflammatory cytokines as prognostic biomarkers in patients with ductal pancreatic adenocarcinoma. Pancreas. 2012;41(7):1001–1007.
- Tang Z, Li C, Kang B, et al. GEPIA: a web server for cancer and normal gene expression profiling and interactive analyses. Nucleic Acids Res. 2017;45(W1):W98–W102.
- Huang Z, Wu Y, Zhou X, et al. Efficacy of therapy with bortezomib in solid tumors: a review based on 32 clinical trials. Future Oncol. 2014;10(10):1795–1807.
- Li J-A, Song C, Rong Y, et al. Chk1 inhibitor SCH 900776 enhances the antitumor activity of MLN4924 on pancreatic cancer. Cell Cycle Georget Tex. 2018;17(2):191–199.
- Liao H, Liu XJ, Blank JL, et al. Quantitative proteomic analysis of cellular protein modulation upon inhibition of the NEDD8-activating enzyme by MLN4924. Mol Cell Proteomics. 2011;10(11):M111–009183.
- Li L, Yang H, He Y, et al. Ubiquitin-specific protease USP6 regulates the stability of the c-Jun protein. Mol Cell Biol. 2018;38(2):e00320–17.
- Knorr K, Schneider P, Meng X, et al. MLN4924 induces Noxa upregulation in acute myelogenous leukemia and synergizes with Bcl-2 inhibitors. Cell Death Differ. 2015;22(12):2133–2142.
- Zhao Y, Xiong X, Jia L, et al. Targeting Cullin-RING ligases by MLN4924 induces autophagy via modulating the HIF1-REDD1-TSC1-mTORC1-DEPTOR axis. Cell Death Dis. 2012;3(9):e386–e386.
- Cullinan SB, Gordan JD, Jin J, et al. The Keap1-BTB protein is an adaptor that bridges Nrf2 to a Cul3-based E3 ligase: oxidative stress sensing by a Cul3-Keap1 ligase. Mol Cell Biol. 2004;24(19):8477–8486.
- Deng Q, Zhang J, Gao Y, et al. MLN4924 protects against bleomycin-induced pulmonary fibrosis by inhibiting the early inflammatory process. Am J Transl Res. 2017;9(4):1810.
- Hao R, Song Y, Li R, et al. MLN4924 protects against interleukin-17A-induced pulmonary inflammation by disrupting ACT1-mediated signaling. Am J Physiol-Lung Cell Mol Physiol. 2019;316(6):L1070–L1080.
- Jin J, Jing Z, Ye Z, et al. MLN4924 suppresses lipopolysaccharide‑induced proinflammatory cytokine production in neutrophils in a dose‑dependent manner. Oncol Lett. 2018;15(5):8039–8045.
- Andérica-Romero AC, Hernández-Damián J, Vázquez-Cervantes GI, et al. The MLN4924 inhibitor exerts a neuroprotective effect against oxidative stress injury via Nrf2 protein accumulation. Redox Biol. 2016;8:341–347.
- Margheritis E, Castellani B, Magotti P, et al. Bile Acid Recognition by NAPE-PLD. ACS Chem Biol. 2016;11(10):2908–2914.
- Hansen HS, Diep TA. N-acylethanolamines, anandamide and food intake. Biochem Pharmacol. 2009;78(6):553–560.
- Berghuis P, Rajnicek AM, Morozov YM, et al. Hardwiring the brain: endocannabinoids shape neuronal connectivity. Science. 2007;316(5828):1212–1216.
- Wang J, Okamoto Y, Tsuboi K, et al. The stimulatory effect of phosphatidylethanolamine on N-acylphosphatidylethanolamine-hydrolyzing phospholipase D (NAPE-PLD). Neuropharmacology. 2008;54(1):8–15.
- Geurts L, Everard A, Van Hul M, et al. Adipose tissue NAPE-PLD controls fat mass development by altering the browning process and gut microbiota. Nat Commun. 2015;6(1):6495.
- Leishman E, Mackie K, Luquet S, et al. Lipidomics profile of a NAPE-PLD KO mouse provides evidence of a broader role of this enzyme in lipid metabolism in the brain. Biochimica et biophysica acta. . 2016;1861(6):491–500.
- Bottemanne P, Muccioli GG, Alhouayek M. N-acylethanolamine hydrolyzing acid amidase inhibition: tools and potential therapeutic opportunities. Drug Discov Today. 2018;23(8):1520–1529.
- Castellani B, Diamanti E, Pizzirani D, et al. Synthesis and characterization of the first inhibitor of N-acylphosphatidylethanolamine phospholipase D (NAPE-PLD). Chem Commun. 2017;53(95):12814–12817.
- Mock ED, Mustafa M, Gunduz-Cinar O, et al. Discovery of a NAPE-PLD inhibitor that modulates emotional behavior in mice. Nat Chem Biol. 2020;16(6):667–675.