
ABSTRACT
Proteasome 26S subunit, ATPase 2 (PSMC2) is a recently identified gene which is potentially associated with human carcinogenesis. However, the effects of PSMC2 on oral squamous cell carcinoma (OSCC) is still unclear. Here, we investigated PSMC2 expression in OSCC tissues and explored its effects on the biological behaviors of OSCC cells. PSMC2 expression was evaluated by immunohistochemistry in a tissue microarray containing 60 OSCC tissues and 9 normal tissues. PSMC2 was knocked down through lentivirus infection in OSCC cell lines. MTT, colony formation, flow cytometry, transwell, and scratch assays were performed to detect effects of PSMC2 knockdown on phenotypes of OSCC cells. Human apoptosis antibody array was used to screen potential downstream of PSMC2 in OSCC. Finally, the effects of PSMC2 knockdown on tumor growth were assessed in a tumor xenograft model using BALB/c nude mice. PSMC2 expression was significantly upregulated in OSCC tissues compared with normal tissues and correlated with poor prognosis. PSMC2 knockdown significantly suppressed cell proliferation, migration, but promoted apoptosis of OSCC cells. Additionally, we confirmed that PSMC2 knockdown can increase the expression of pro-apoptotic proteins. Furthermore, we found that PSMC2 knockdown downregulated expression of p100, p-Akt, CDK6, and upregulated of MAPK9. Xenograft experiments revealed that PSMC2 knockdown can suppress OSCC tumor growth and promote apoptosis. This study demonstrated that PSMC2 plays a critical role in OSCC progression through affecting pro-apoptotic protein expression and apoptosis pathways. It indicated that targeting PSMC2 might be a promising strategy for OSCC treatment.
Introduction
Oral cancer is one of the most common malignant tumors in the head and neck, which recently has been revealed 377, 713 new cases and 177, 757 deaths in 2020 [Citation1]. As a common malignancy of the head and neck region, oral squamous cell carcinoma (OSCC) accounts for more than 90% of oral cancer [Citation2,Citation3]. Most patients with OSCC suffer from local and/or regional disease recurrence, even distant metastasis [Citation4], which makes the 5-year survival rates lower than 50% despite we get some advances in combined modality therapy [Citation5]. Therefore, we have an imperious demand for more effective targeted therapy to improve the prognosis of patients with OSCC.
The 26S proteasome, consisting of a 20S core catalytic subunit and a 19S regulatory subunit, is an ATP-dependent protease complex responsible for most selective protein degradation in the nucleus and cytoplasm of eukaryotes to regulate either directly or indirectly many important cellular processes [Citation6]. Thus, dysregulation of protein degradations will result in various diseases, including cancer. The 26S proteasome has become an attractive therapeutic target for tumor, and the proteasome inhibitors have shown an impressive anti-tumor function by inducing apoptosis in several cancer types [Citation7].
As an essential part of the 19S regulatory complex of the 26S proteasome, PSMC2 is responsible for catalyzing the unfolding and translocation of substrates into the 20S proteasome [Citation8]. Nijhawan et al. considered PSMC2 as a gene that has a distinct cancer-specific characteristic resulting from genome instability and is related to cell viability. Indeed, its expression is closely associated with cancer progression [Citation9]. Previous studies confirmed that PSMC2 was overexpressed in tumor tissue, and the change of its expression can impair cell cancer progression [Citation10–12]. Although effects of PSMC2 on some types of cancer have been studied, its functions and mechanisms in OSCC are still lacking. Here, we described the effects of PSMC2 on OSCC cell phenotypes and OSCC progression, which may be the first report in OSCC.
Materials and methods
Patient samples and tissue microarray
All specimens from the department of Oral and Maxillofacial Surgery (Xiangya Hospital, Central South University). The tumor specimens were histopathologically diagnosed as OSCC. The tissue microarray including 60 OSCC tissues and 9 normal tissues was constructed in collaboration with Alenabio Company, Ltd. (Xian, Shaanxi, China). This study was approved by the Ethics Committee of the Xiangya Hospital, Central South University on March 14, 2018 [IRB(s) No. 201,803,795], and was performed according to the Institutional Guidelines. All patients were informed that the lesion tissue would be used for scientific research without any commercial use, and provided informed content.
Immunohistochemistry (IHC) staining and scoring system
Immunohistochemical staining was performed according to the protocol of Biotin-Streptavidin Horseradish Peroxidase Detection System (SP-9001, ZSGB-Bio) and Diaminobenzidine Kit (ZLI-9017, ZSGB-Bio). In brief, all sections (human species and mouse species) were routinely deparaffinized and rehydrated, and then performed antigen retrieval in sodium citrate through microwave heating. The activity of endogenous peroxidase was blocked with 3% hydrogen peroxide, and nonspecific proteins were sealed with goat serum for 20 min. The following primary antibody were used: PSMC2 (1:46; ab233127; Abcam) and Ki67 (1:200; ab16667; Abcam) overnight at 4°C. Next, they were covered by biotin-labeled secondary antibodies and streptavidin peroxidase. Diaminobenzidine was used to reveal positive or negative regions and hematoxylin was used to reveal nucleus. The results were evaluated by double grading and semiquantitative grading. All slides were scanned using the Aperio ScanScope CS whole-slice scanner (Aperio Technologies) with a background substrate. The scoring system was performed as described previously [Citation13].
Cell culture and reagents
Four OSCC cell lines (SCC25, Tca8113, CAL27, HN6) were cultured in DMEM containing 10% fetal bovine serum. Cell culture were maintained as described previously [Citation13].
Quantitative real-time polymerase chain reaction (RT-qPCR)
Total RNA was extracted from cells using Tizol reagent (T9424-100 m, Sigma) according to the manufacturer’s protocol. Synthesis of cDNA was used in reverse transcription by using Hiscript QRT supermix for qPCR (+gDNA WIPER) (R123-01, Vazyme). The relative gene expression levels were calculated and statistically compared using the 2–ΔΔCT analysis program.
Vector construction and transfection
Cells without any treatment were used as CON group. Three siRNAs (si-, si-2, si-3) were designed according to the sequence of PSCM2 (NM_002803.3) transcripts in NCBI (https://www.ncbi.nlm.nih.gov/). The accepted scramble sequence (TTCTCCGAACGTGTCACGT) was used as a negative control (siCtrl). The shRNAs and shCtrl were designed according to the sequence of siRNAs and siCtrl, respectively, as fellow: CCGG was added at the 5ʹ end of the sequence, while TTTTTG was added at the 3ʹ end of the sequence. Then, three loops were added in the middle, and Age I and EcoRI restriction sequences were added to both ends. The shRNAs were synthesized and packed in lentiviral vectors by Yibeirui Bioscires, Ltd (Shanghai, China). The sequences are listed below. Briefly, when the cell density reached 70–80%, the cells were transfected with shPSMC2 and shCtrl through the transfection reagent developed by Yibeirui Bioscires, Ltd (Shanghai, China). After transfection, RNA was collected for RT-qPCR to verify the knockdown efficiency. The primers of shPSMC2 are shown as below.
Western blotting analysis
Total protein extraction, quantification and Western blotting were performed as described previously [Citation13]. The following primary antibodies: PSMC2 (1:1000; SC-166972; Santa Cruz), Akt (1:1000, 4685, Cell Signaling Technology, CST); p-Akt (1:500; AF887-sp; R&D); MAPK9 (1:2000; ab76125; Abcam); CDK6 (1:1000; ab151247; Abcam); PIK3CA (1:1000; ab40776; Abcam); GAPDH (1:3000; AP0063; Bioworld) were incubated overnight 4°C. Protein bands were detected using a chemiluminescent imaging system (MiniChemi, Beijing, China) following incubated secondary antibody for 1 hour at room temperature, and images were analyzed by the ImageJ 1.48 V based on protein/GAPDH.
MTT assay and Colony formation assay
The cells were inoculated to 96-well plate with 2000 cells per well overnight, and it were repeated 3 times in each group. 20 μL of the Thiazolyl blue (MTT) (5 mg/ml, JT343, Genview) was added into each well 4 h before the end of the culture from the day after the planking. The growth curve was made to judge the cell proliferation.
The cells were inoculated to 6-well plate with 1000 cells per well for 8 days, medium was changed every 3 days. Before the end of the experiment, cell clones were photographed under fluorescence microscope and washed with PBS. After that, the cells were fixed with 1 ml 4% paraformaldehyde for 1 h, and washed with PBS. 500 μL GIEMSA dye solution (AR0752, Dingguo) was added into each well for 20 min. And then, cell clones were photographed for counting after dried.
Apoptosis assay and human apoptosis antibody array
To evaluate apoptosis using flow cytometry, cells were collected 48 h after lentiviral transfection and washed twice in PBS at 4°C. Cells were resuspended in 500 μL of 1 × binding buffer and then incubated with an AnnexinV/PI double staining kit for 5 min in the dark. Subsequently, apoptosis detection was performed with a flow cytometer (Guava easyCyte HT, Millipore) and data were analyzed using CytExpert2.0 and Flowjo software (Beckman Counter, USA). Each experiment was repeated three times.
The intracellular cell signaling pathway was examined by the Human Apoptosis Antibody Array Kit (ab134001, Abcam) according to the manufacturer’s protocol. In brief, the cells were collected after lentivirus infection for 3 days, lysed with lysis buffer 4°C for 30 min. The total extracted protein was diluted with the array dilute buffer to 0.5 mg/ml. The array antibody membrane was blocked with blocking buffer for 30 min at room temperature, and incubated at 4°C overnight. 1 × Biotin-conjugated Anti-cytokine was incubated overnight at 4°C and gently shaken. HRP linked Streptavidin was added to the membranes. Protein was visualized using ChemiDoc XRS chemiluminescence detection and imaging system. The density of the spots was quantitated using Quantity One software and normalized to the α–tubulin levels.
Wound healing assay and transwell assay
The cells were added into 96 well plate with 50,000 cells per well. A scratch was made with tips when the plate was almost filled with cells. The images of cells that migrated into the wounded area were obtained and analyzed by Cellomics (ArrayScan VT1, Thermo) at 0 h, 8 h, and 24 h.
Transwell chamber were used to detect cellular invasive capabilities. The cells were seeded into 24-insert at a density of 100,000. A serum‐free cell suspension was added into the upper chamber, and the contained 30% FBS plus DMEM medium was added into the lower chamber. After 48 h, the noninvasive cells were gently removed with a cotton swab and then invasive cells were stained with crystal violet for 20 min. The images of invading cells were obtained by a fluorescent microscope.
Tumorigenesis in nude mice and in vivo imaging
Female BALB/c nude mice (n = 20; 4 weeks old; Beijing Vital river Laboratories Co., Ltd.) were maintained under certain conditions. All animal experiments were performed in strict accordance with international ethical guidelines and the National Institutes of Health Guide for the Care and Use of Laboratory Animals. The experiments were authorized and approved by the Institutional Animal Care and Use Committee of Xiangya hospital affiliated to Central South University. Nude mice were inoculated with shPSMC2-infected or shCtrl-infected tumor cells. Mice were divided into two equal groups at random. Tumor cells from both groups were resuspended at a density of 4 × 10⁶ cell/ml before a 1 ml cell suspension was injected subcutaneously into the mice. The mice were maintained until the tumors were visible. Tumor diameter and size were measured 3, 7, 11, 14, and 18 days following inoculation. Tumor volume was calculated using following formula for hemi-ellipsoids: Volume = length (mm) × width (mm) × height (mm) × 3.14/6. At 18 days following inoculation of tumor cells, the mice were injected intraperitoneally with 10 μL/g D-Luciferin (40902ES01, Shanghai Qianchen Biotechnology). After 15 min, 70 mg/kg pentobarbital sodium was injected intraperitoneally to anesthetize the mice. A few minutes later, the anesthetized mice were placed under a small animal live imaging system (IVIS Spectrum, Perkin Elmer) to observe the fluorescence results. The mice were then sacrificed by pentobarbital sodium, and the tumors were dissected and photographed.
Statistical analysis
All the data were presented as Means ± SD. Three repeated experiments for each group were done. Student’s t-test (SPSS 26.0 software) were used to analyze and determine the statistical significance. P< 0.05 was considered as significant.
Results
PSMC2 is overexpression in OSCC tissue
The immunohistochemistry (IHC) data of tissue microarray (TMA) slides demonstrated that the expression of PSMC2 in OSCC tissues was significantly higher than normal tongue tissues (p< 0.001, , )). Moreover, the association between PSMC2 expression and clinicopathological data was presented (). On the other hand, using data collected from GSE41116 dataset, it was demonstrated that high PSMC2 expression was significantly correlated with poor prognosis of OSCC patients ()).
Table 1. Expression patterns of PSMC2 in oral squamous cell carcinoma tissues and normal tongue tissues were revealed in immunohistochemistry analysis
Table 2. Relationship between PSMC2 expression and clinicopathological characteristics in patients with oral squamous cell carcinoma
Figure 1. The upregulation of PSMC2 in OSCC and the construction of PSMC2 knockdown cell model. (a) Expression level of PSMC2 in normal tissues (200×) was detected by IHC staining. (b) The correlation between PSMC2 expression and survival of OSCC patients was analyzed based on data collected from GSE41116 dataset. (c) PSMC2 expressions in SCC25, Tca8113, HN6, and CAL27 were detected by qRT-PCR. (d) The knockdown efficiency of PSMC2 in shPSMC2-1, shPSMC2-2, and shPSMC2-3 group was detected by qRT-PCR. (e) The specificity and validity of PSMC2 expression knockdown by the lentivirus-mediated shPSMC2 was evaluated by qRT-PCR. (f) The infection efficiency for CAL27 and HN6 cells was evaluated by the expression of the green fluorescent protein. (g) The specificity and validity of PSMC2 expression knockdown by the lentivirus-mediated shPSMC2 was evaluated by Western blotting analysis. Data were shown as mean with SD (n ≥ 3). *p < 0.05, **p < 0.01, ***p < 0.001.
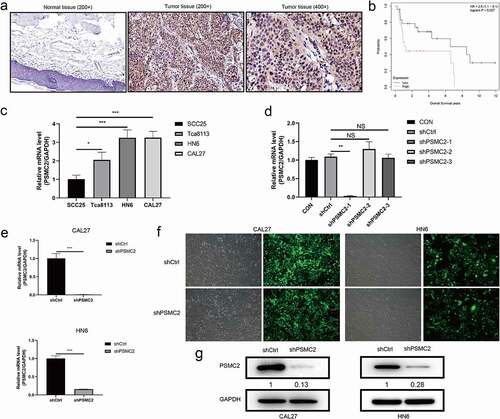
ShPSMC2 models are constructed in CAL27 and HN6 cells
Results of qRT-PCR indicated that the expression of PSMC2 in CAL27 and HN6 cells was relatively high compared to SCC25 cells and Tca8113 cells (p< 0.05, )). Then, qRT-PCR was used to determine the knockdown efficiency among shPSMC2-1, shPSMC2-2, and shPSMC2-3, and showed that knockdown efficiency of shPSMC2-1 was highest among them (p < 0.01, )). Its knockdown efficiency reached 99% and 84.2% in CAL27 and HN6 cells, respectively (p< 0.01, )). The Western blotting further confirmed that the levels of PSMC2 were significantly downregulated in the shPSMC2 group compared with the shCtrl group after lentivirus infection ()). These results showed that the PSMC2 knockdown cell models were successfully constructed and obviously downregulated PSMC2 at the mRNA and protein levels in CAL27 and HN6 cells.
PSMC2 knockdown inhibits cell proliferation and colony formation
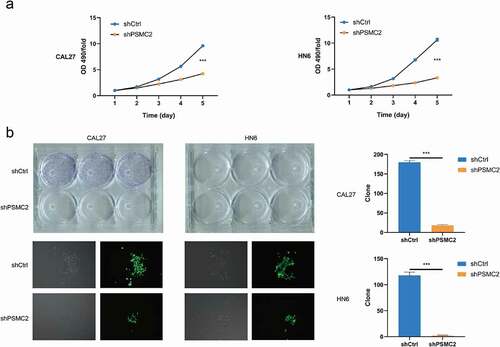
The cell proliferation was analyzed by MTT assay and colony formation assay. the MTT assay assessed that downregulating PSMC2 expression apparently impaired the growth of CAL27 and HN6 cells during 5 days (p < 0.001, )). In addition, the colony formation assay also proved that PSMC2 can affect the cloning potential, which exhibited that the colony number of the shPSMC2 group was significantly less than the shCtrl group in both CAL27 and HN6 cells (p < 0.001, )). These results suggested that downregulating of PSMC2 may inhibit cell proliferation and colony formation potential of cells.
Figure 2. Knockdown of PSMC2 inhibited cell proliferation. (a) Cell proliferation of CAL27 and HN6 cells with or without PSMC2 knockdown was evaluated by MTT assay. (b) Colony formation of CAL27 and HN6 cells with or without PSMC2 knockdown was evaluated by colony formation assay. Data were shown as mean with SD (n ≥ 3). *** p< 0.001.
PSMC2 knockdown inhibits cell migration
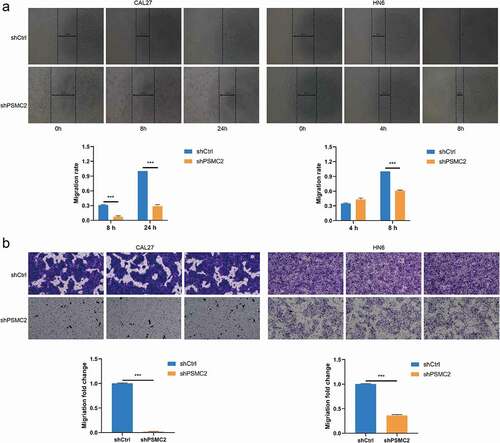
The migration of CAL27 and HN6 cells was analyzed by wound healing assay. We found that the CAL27 or HN6 cells with PSMC2 knockdown have much lower wound closure rate compared with the shCtrl group (p < 0.001, )). Moreover, the transwell assay also suggested that PSMC2 knockdown can suppress the migration ability of CAL27 and HN6 cells (p < 0.001, )). The results above strongly demonstrated that PSMC2 was necessary for migration capability in CAL27 and HN6 cells.
Figure 3. Knockdown of PSMC2 inhibited cell migration. (a) Cell migration of CAL27 and HN6 cells with or without PSMC2 knockdown was evaluated by wound healing assay. (b) Cell migration of CAL27 and HN6 cells with or without PSMC2 knockdown was evaluated by transwell assay. Data were shown as mean with SD (n ≥ 3). *** p< 0.001.
PSMC2 knockdown promotes apoptosis
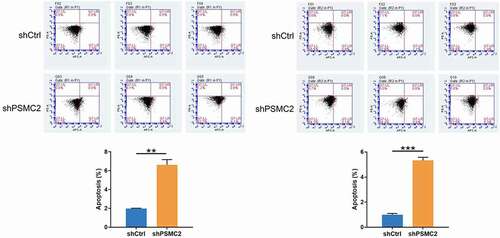
The rate of cell apoptosis was evaluated by flow cytometry. The shPSMC2 group of CAL27 or HN6 cells manifested a substantial elevation in apoptosis compared with the shCtrl group (p < 0.001, ). Therefore, these results implied that PSMC2 knockdown may inhibit the cell proliferation and migration of CAL27 and HN6 cells by inducing apoptosis.
Figure 4. Flow cytometry analysis was used to detect the percentage of apoptotic cells in shCtrl group and shPSMC2 group of CAL27 and HN6 cells. Data were shown as mean with SD (n ≥ 3). *** p < 0.001.
Downstream molecular mechanism of PSMC2 in OSCC cells
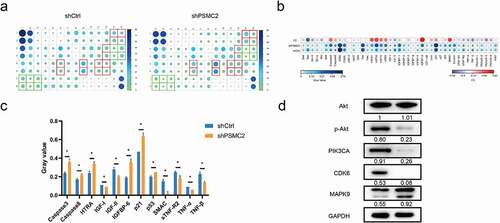
Since downregulating PSMC2 can significantly induce apoptosis of CAL27 and HN6 cells, we were keen to explore the potential mechanism of the regulation ability of PSCM2 knockdown in OSCC. The human apoptosis antibody array was performed to analyze the differential expression of 43 proteins in HN6 cells between shPSCM2 and shCtrl groups. As shown in the results (), the expression of pro-apoptotic proteins including Caspase3, Caspase8, HTRA, IGFBP-6, p21, p53 and SMAC were significant upregulated while the expression of anti-apoptotic proteins including IGF-I, IGF-II, sTNF-R2, TNF-α, TNF-β were significantly downregulated in shPSMC2 group. The Western blotting assay showed that the expression of p-Akt, PIK3CA, and CDK6 was downregulated while the expression of MAPK9 was upregulated in shPSMC2 group ()). These results were consistent with the in vitro experiments.
Figure 5. The exploration of downstream of PSMC2. (a) Apoptosis-related proteins were detected by the human apoptosis antibody array in OSCC cells with or without PSMC2 knockdown. (b) Differences in the human apoptosis antibody array were analyzed in OSCC cells with or without PSMC2 knockdown. (c) Gray values of differentially expressed proteins were shown. (d) The expression of the key proteins in pathways was detected by Western blotting in HN6 cells. Data were shown as mean with SD (n ≥ 3). *p < 0.05.
PSMC2 knockdown suppressed tumorigenesis in vivo
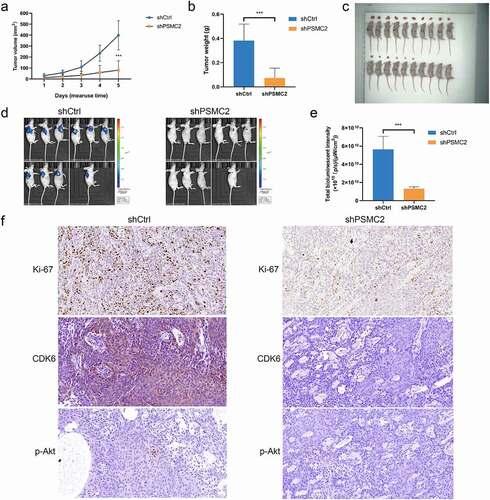
We confirmed that PSMC2 knockdown could inhibit cell proliferation, migration but promote apoptosis in vitro. However, whether the effects of PSMC2 knockdown in vivo is consistent with in vitro is still to be further explored. Therefore, we used HN6 cells transfected with shPSMC2 or shCtrl to establish mouse xenotransplantation model. The tumor in the shPSMC2 group was noticeably smaller and lighter than that in the shCtrl group (p < 0.05, ). In addition, the bioluminescence imaging system displayed that tumor growth in shPSMC2 group was slower than that in the shCtrl group (p < 0.05, ). Moreover, the intensity of Ki67 expression, a proliferation index of tumor tissues, in shPSMC2 group was significantly lower than that in shCtrl group ()). In consistent with the previous results in cell models, the expression of CDK6 and p-Akt was relatively lower in shPSMC2 group ()). Therefore, in vivo studies revealed that PSMC2 was involved in the progression of OSCC, and played an essential role in that.
Figure 6. Knockdown of PSMC2 inhibited OSCC tumor growth in vivo. (a) The tumor volumes of mice with or without PSMC2 knockdown were measured after injection. (b) The tumor weights of mice with or without PSMC2 knockdown were measured after injection. (c) Images of mice and tumors in shCtrl and shPSMC2 group. (d) The bioluminescent images of tumors in shCtrl and shPSMC2 group. (e) The total bioluminescent intensity of tumors in shCtrl and shPSMC2 group. (f) The expression of Ki-67, CDK6 and p-Akt in tumor tissues of shCtrl and shPSMC2 group was detected by IHC. Data were shown as mean with SD (n ≥ 3). ***p< 0.001.
Discussion
PSMC2 is responsible for catalyzing the unfolding and translocation of substrates into the 20S proteasome [Citation8], which protects cells from dying [Citation14]. The dysfunction of PSMC2 is closely associated with cancer. Some studies have reported the effects of PSMC2 on tumor cells. Nijhawan et al. found that reducing PSMC2 expression impaired ovarian cancer cells proliferation, and they considered that cells harboring partial PSMC2 copy number loss are liable to die due to the suppression of PSMC2 [Citation9]. Furthermore, Song et al. reported that PSMC2 is overexpressed in osteosarcoma, and interfering PSMC2 expression can inhibit cell proliferation but promote apoptosis [Citation11].
In colorectal cancer, PSMC2 was overexpression and its expression had a negative correlation with the prognosis of patients with colorectal cancer [Citation12]. Qin et al. confirmed that alteration in expression of PSMC2 could regulate the cell proliferation and apoptosis [Citation10]. It is known that the proteasome has become a potential target for the treatment of solid tumors. Moreover, the proteasome inhibitors are being selected to play an anti-tumor effect by regulating apoptosis in clinical trials [Citation15]. Based on the intrinsic relationship between PSMC2 and the 26S proteasome complex, we are urged to explore the regulation mechanism of PSMC2 in OSCC and provide a promising therapy strategy for OSCC.
In the present study, we found the overexpression of PSMC2 in tumor tissues and human OSCC cell lines. In addition, PSMC2 knockdown inhibits OSCC cell proliferation and migration, but promotes apoptosis. In consistent with in vitro studies, in vivo studies demonstrated that PSMC2 knockdown significantly reduced tumorigenicity of OSCC cells.
The imbalance between apoptosis and cell proliferation is the key event in tumorigenesis, and cells escaping apoptosis is one of the defined hallmarks of cancer [Citation16]. In current study, we found that PSMC2 knockdown promote OSCC cell apoptosis through a series of apoptosis-related proteins. The pro-apoptotic proteins, such as Caspase3, Caspase8, and SMAC, were upregulated while anti-apoptotic proteins, like IGF-I, IGF-II, and sTNF-R2, were downregulated. As is well known, Caspase 8 and 3 have been identified as the initiator and effector in the apoptotic signaling cascade [Citation17]. HTRA family plays a pro-apoptosis role through degrading or binding inhibitor of apoptotic proteins [Citation18–20]. SMAC released from the mitochondria, competitively blocks the caspase-binding sites in anti-apoptosis protein to promote apoptosis [Citation21]. Constitutive activation of the IGF-signaling axis contributes to proliferation and anti-apoptosis [Citation22]. To sum up, it is implied that PSMC2 knockdown-induced promotion of OSCC cell apoptosis has a sophisticated and complex regulatory mechanism.
On the other hand, PSMC2 knockdown affects the expression of downstream signals including p-Akt, PIK3CA, CDK6, and MAPK9. The PI3K/Akt/mTOR pathway is a classical signal transduction axis in the control of cell differentiation, proliferation, and apoptosis, which is vital to the normal cell development, as well as cancer initiation and progression [Citation23]. In head and neck cancer, the dysfunction of the PI3K pathway is very frequent, which accelerates tumor growth and metastasis [Citation24]. Liu et al. proposed that inhibiting PI3K/Akt/mTOR signal transduction promotes OSCC cells apoptosis but suppresses proliferation [Citation25]. In addition, Wang et al. demonstrated that downregulating CDK6 expression could inhibit expression of cell cycle-related proteins and thus further impaired OSCC cell proliferation, migration, and invasion [Citation26]. A large amount of evidence exhibited that the activation of MAKP9 is closely related to the regulation of cell proliferation, apoptosis, and migration of tumor cells [Citation27,Citation28]. These studies proposed that the various cell activities of OSCC cells are regulated by a complex signal network.
Taken together, our studies indicated that PSMC2 was involved in the progression of OSCC and it could be a promising therapeutic target. However, this study still has some limitations. More specimens should be collected to mine the relationship between PSMC2 and the prognosis of OSCC, and the underlying mechanism of PSMC2 mediated regulation of OSCC progression remains unclear. Therefore, in further study, we will further explore the in-depth molecular mechanism of OSCC related to PSMC2.
Author contribution
AJ. Min designed and supervised the development of this program. ZJ. Wang, HF. Xiong and YJ. Zuo were responsible for the in vitro and in vivo experiments. ZJ. Wang and SJ. Hu executed all the data analysis and statistical analysis. ZJ. Wang and C. Zhu produced the manuscript, which was checked and revised by AJ. Min. All authors were acknowledged and approved the publication of this manuscript.
Disclosure statement
No potential conflict of interest was reported by the author(s).
Additional information
Funding
References
- Bray F, Ferlay J, Soerjomataram I, et al. Global cancer statistics 2018: GLOBOCAN estimates of incidence and mortality worldwide for 36 cancers in 185 countries. CA Cancer J Clin. 2018;68(6):394–424.
- Mahmood H, Shaban M, Indave BI, et al. Use of artificial intelligence in diagnosis of head and neck precancerous and cancerous lesions: a systematic review. Oral Oncol. 2020;110:104885.
- Almangush A, Mäkitie AA, Triantafyllou A, et al. Staging and grading of oral squamous cell carcinoma: an update. Oral Oncol. 2020;107:104799.
- Lala M, Chirovsky D, Cheng JD, et al. Clinical outcomes with therapies for previously treated recurrent/metastatic head-and-neck squamous cell carcinoma (R/M HNSCC): a systematic literature review. Oral Oncol. 2018;84:108–120.
- Thariat J, Vignot S, Lapierre A, et al. Integrating genomics in head and neck cancer treatment: promises and pitfalls. Crit Rev Oncol Hematol. 2015;95(3):397–406.
- Bhaumik SR, Malik S. Diverse regulatory mechanisms of eukaryotic transcriptional activation by the proteasome complex. Crit Rev Biochem Mol Biol. 2008;43(6):419–433.
- Frankland-Searby S, Bhaumik SR. The 26S proteasome complex: an attractive target for cancer therapy. Biochim Biophys Acta (BBA)- Rev Cancer. 2012;1825(1):64–76.
- Smith DM, Fraga H, Reis C, et al. ATP binds to proteasomal ATPases in pairs with distinct functional effects, implying an ordered reaction cycle. Cell. 2011;144(4):526–538.
- Nijhawan D, Zack TI, Ren Y, et al. Cancer vulnerabilities unveiled by genomic loss. Cell. 2012;150(4):842–854.
- Qin J, Wang W, An F, et al. PSMC2 is up-regulated in pancreatic cancer and promotes cancer cell proliferation and inhibits apoptosis. J Cancer. 2019;10(20):4939.
- Song M, Wang Y, Zhang Z, et al. PSMC2 is up-regulated in osteosarcoma and regulates osteosarcoma cell proliferation, apoptosis and migration. Oncotarget. 2017;8(1):933.
- He J, Xing J, Yang X, et al. Silencing of proteasome 26S subunit ATPase 2 regulates colorectal cancer cell proliferation, apoptosis, and migration. Chemotherapy. 2019;64(3):146–154.
- Min A, Xiong H, Wang W, et al. CD147 promotes proliferation and migration of oral cancer cells by inhibiting junctions between E‐cadherin and β‐catenin. J Oral Pathol Med. 2020;49(10):1019–1029.
- Gu ZC, Enenkel C. Proteasome assembly. Cell Mol Life Sci. 2014;71(24):4729–4745.
- Milano A, Perri F, Caponigro F. The ubiquitin–proteasome system as a molecular target in solid tumors: an update on bortezomib. Onco Targets Ther. 2009;2:171.
- Wang YL, Shao X, Wang F, et al. Intron‑specific shRNA‑mediated downregulation of survivin and promotion of apoptosis in HeLa cells. Oncol Lett. 2017;14(5):5927–5933.
- Li J, Yuan J. Caspases in apoptosis and beyond. Oncogene. 2008;27(48):6194–6206.
- Wang X. Inhibition of HtrA2 alleviates inflammatory response and cell apoptosis in lipopolysaccharide‑induced acute pneumonia in rats. Mol Med Rep. 2020;22(4):3127–3134.
- Wenta T, Rychlowski M, Jarzab M, et al. HtrA4 protease promotes chemotherapeutic-dependent cancer cell death. Cells. 2019;8(10):1112.
- Wenta T, Jarzab M, Rychlowski M, et al. Cellular substrates and pro-apoptotic function of the human HtrA4 protease. J Proteomics. 2019;209:103505.
- Jeong S, Jo MJ, Yun HK, et al. Cannabidiol promotes apoptosis via regulation of XIAP/Smac in gastric cancer. Cell Death Dis. 2019;10(11):1–13.
- Breuhahn K, Schirmacher P. Reactivation of the insulin-like growth factor-II signaling pathway in human hepatocellular carcinoma. World J Gastroenterol. 2008;14(11):1690.
- O’Donnell JS, Massi D, Teng MWL, et al. PI3K-AKT-mTOR inhibition in cancer immunotherapy, redux. Semin Cancer Biol. 2018;48:91–103.
- Anderson RT, Keysar SB, Bowles DW, et al. The dual pathway inhibitor rigosertib is effective in direct patient tumor xenografts of head and neck squamous cell carcinomas. Mol Cancer Ther. 2013;12(10):1994–2005.
- Liu H, Gong X, Yang K. Overexpression of the clock gene Per2 suppresses oral squamous cell carcinoma progression by activating autophagy via the PI3K/AKT/mTOR pathway. J Cancer. 2020;11(12):3655.
- Wang X, Chang K, Gao J, et al. MicroRNA-504 functions as a tumor suppressor in oral squamous cell carcinoma through inhibiting cell proliferation, migration and invasion by targeting CDK6. Int J Biochem Cell Biol. 2020;119:105663.
- Wang X, Shan YQ, Tan QQ, et al. MEX3A knockdown inhibits the development of pancreatic ductal adenocarcinoma. Cancer Cell Int. 2020;20(1):1–10.
- Yang J, Huang H, Xiao D, et al. Knockdown of TMED3 inhibits cell viability and migration and increases apoptosis in human chordoma cells. Int J Oncol. 2021;58(5):1–12.