
ABSTRACT
Colorectal cancer (CRC) is the third most common cancer worldwide. Previous research revealed that microRNA 130b-3p (miR-130b-3p) significantly upregulated in CRC patients can be detected in feces from patients with such a neoplasm. In this study, the biological role and molecular mechanism of miR-130b-3p in CRC were explored. The miR-130b-3p level in CRC tissues, feces and cell lines was measured using RT-qPCR analysis. CCK-8, EdU, TUNEL, flow cytometry, Western blotting, and in vivo experiments were performed to explore the biological function of miR-130b-3p in CRC progression. For this purpose, 16 BALB/c nude mice were assigned to two groups. The experiment lasted for four months. Bioinformatics analysis and luciferase reporter assay were used to investigate the regulatory mechanism related to miR-130b-3p. In our research, miR-130b-3p was upregulated in CRC tissues and cells and it was detected in feces from CRC patients. Moreover, miR-130b-3p inhibition suppressed CRC cell proliferation and promoted cell apoptosis in vitro as well as repressed CRC tumor growth in vivo. Mechanistically, miR-130b-3p directly targeted the 3′untranslated region (UTR) of chromodomain helicase DNA binding protein 9 (CHD9) and negatively regulated CHD9 expression. Furthermore, CHD9 played an anti-oncogenic role in CRC. Inhibition of CHD9 expression was likely to be a key mechanism by which miR-130b-3p increased CRC cell growth, with a target protector experiment revealing miR-130b-3p influenced proliferation via direct inhibition of CHD9. MiR-130b-3p promotes the progression and tumorigenesis of CRC at least partially by targeting CHD9.
Abbreviations: CRC: Colorectal cancer; miR-130b-3p: microRNA 130b-3p; CHD9: chromodomain helicase DNA binding protein 9; UTR: untranslated region; FIT: fecal immunochemical test; AAs: advanced adenomas
KEYWORDS:
Introduction
Colorectal cancer (CRC) is the third most common cancer and the second leading cause of cancer-related death worldwide [Citation1–4], causing about 600,000 deaths every year [Citation5]. Although 90% of patients diagnosed early with CRC have an overall survival of more than five years, this number is reduced to 10% in patients diagnosed with CRC at advanced stages with distant metastases [Citation6]. Previous research revealed that CRC screening is effective and cost-effective for cancer detection in average risk adults [Citation7,Citation8]. There are two broad categories of recommended CRC screening strategies, stool tests (occult blood-that is, guaiac test and fecal immunochemical test [FIT]-or exfoliated DNA tests) and structural examinations [Citation9–11]. Stool tests primarily identify cancer because of their limited sensitivity for detecting advanced adenomas (AAs) [Citation12], which brings a challenge for CRC screening. Therefore, investigating the biomarkers for CRC screening may be an appealing means of overcoming the limitation [Citation13].
MicroRNAs (miRNAs) are small endogenous non-coding RNAs with 18–25 nucleotides in length [Citation14–16]. In animal cells, miRNAs regulate their targets by translational inhibition and mRNA destabilization [Citation17,Citation18]. While human tumors are often characterized by a general defect in miRNA production and global miRNA downregulation [Citation19], studies have also shown specific miRNAs to be elevated in CRC [Citation20]. Reduced levels of tumor suppressor miRNAs, or overexpression of oncogenic miRNAs, contribute to tumor progression by altering gene expression [Citation21]. Indeed, deregulated miRNAs reflect physiopathologic states and allow different stages and subtypes of cancer, including CRC, to be distinguished and allow the discrimination of patients with neoplasms from healthy individuals [Citation22]. Thus, miRNAs detected in biological fluids (including feces), have been suggested as important biomarkers for CRC screening. According to a previous report, miR-130b-3p was significantly selected as one of the most discriminant fecal miRNAs to distinguish patients with advanced neoplasm from those with nonrelevant findings at colonoscopy [Citation23]. Additionally, it was reported that CRC cell-derived exosomal miR-25-3p, miR-130b-3p and miR-425-5p collectively facilitates epithelial-mesenchymal transition and metastasis of CRC [Citation24]. Therefore, miR-130b-3p may play a key role in CRC progression. Interestingly, miR-130b-3p appears to be a tumor suppressor or promotor in other contexts. MiR-130b-3p inhibits cell invasion and migration in breast carcinoma by targeting the Notch ligand DLL1 [Citation25]. Exosomal miR-130b-3p promotes the progression of oral squamous cell carcinoma by targeting PTEN [Citation26]. Combining these studies, miR-130b-3p may have different effects in different tumors, which provides more possibilities for the research of miR-130b-3p.
Chromodomain helicase DNA-binding protein 9 (CHD9) belongs to the chromodomain helicase DNA-binding protein family. CHDs are a class of ATP-dependent chromatin modulators that contribute to the chromatin structure reorganization and histone variants deposition [Citation27]. In the CHD family, CHD9 was thought to be an oncogene for clear cell renal cell carcinoma [Citation28], and CHD9 might be a putative tumor suppressor gene that could inhibit the development of CRC by participating in DNA repair processes [Citation29]. However, the effect of CHD9 on cellular function in CRC is largely unknown. Here, we performed bioinformatics analysis and found that CHD9 has a binding site for miR-130b-3p. Additionally, miR-130b-3p was found to negatively regulate CHD9 expression in CRC.
In this study, we aimed to elucidate the role of miR-130b-3p in CRC progression, and to verify whether the direct targeting of the CHD9 3′UTR by miR-130b-3p is a mechanism for the increased or inhibited cell growth observed with altered miR-130b-3p levels. Our research may provide potential novel insight and molecular mechanism for clinical screening and treatment of CRC.
Materials and methods
Patient specimens
Human CRC tissues and the corresponding adjacent mucosa tissues were obtained from 60 CRC patients who underwent surgery in the First Affiliated Hospital of Nanjing Medical University (Jiangsu, China). The collected tissues were stored at −80°C. In addition, fecal samples were obtained from 60 CRC patients and matched healthy control individuals with normal colonoscopy findings. Each participant provided one fecal sample using a specimen collection device (OC-Sensor, Eiken Chemical, Tokyo, Japan), which collected 10 mg feces with a serrated probe attached to the cap into 2 ml buffer. All fecal samples were kept at −80°C until RNA extraction. CRC diagnosis was histopathologically confirmed, and none of the patients had received neoadjuvant chemotherapy or radiation therapy. The utilization of tumor samples for research was approved by the Ethics Committee of the First Affiliated Hospital of Nanjing Medical University (Jiangsu, China), which was in accordance with the Declaration of Helsinki. Written informed consent was signed by all patients.
Cell culture
CRC cell lines (SW480, SW620, HCT-116 and HT-29) and a human normal colonic epithelial cell line (FHC) were obtained from the American Type Culture Collection (ATCC; Gaithersburg, MD, USA). All cells were cultured in Dulbecco’s modified Eagle medium (DMEM; Invitrogen, Carlsbad, CA, USA) supplemented with 10% fetal bovine serum (FBS; Invitrogen), 100 U/ml penicillin, and 100 mg/ml streptomycin (Invitrogen) in humidified air at 37°C with 5% CO2.
Transfection
The oligonucleotides including miR-130b-3p mimics (CAGUGCAAUGAUGAAAGGGCAU), miR-130b-3p inhibitor (AUGCCCUUUCAUCAUUGCACUG), and their negative controls NC mimics (ACUGGAGCGAAUUGUAGAGAAC) and NC inhibitor (CAUGUAGGCUUCCCAUUCAUUC) were designed and synthesized by GenePharma (Shanghai, China). Full-length CHD9 was amplified from genomic DNA (Roche diagnostics) and then digested with XbaI to obtain nucleotides of the CHD9 cDNA sequence and inserted into the pcDNA3.1 vector (Sigma-Aldrich; Merck KGaA) to obtain pcDNA3.1/CHD9. Empty pcDNA3.1 vector acted as a control. CRC cells were seeded into 24-well plates at a density of 1 × 10⁶ cells/well. When the cell confluence reached 80%, a total of 2 µg vectors, 50 nM miR-130b-3p mimics, 50 nM miR-130b-3p inhibitor or 50 nM of their corresponding negative controls were transfected into cells at 37°C for 48 h using Lipofectamine 2000 (Invitrogen). In some experiments, SW480 and SW620 cells were transfected with 500 nM miScript Target protectors (Qiagen, Valencia, CA) and 40 nM miR-193b mimics or a negative control miScript target protector (ID: MTP0000002). Target protectors were synthesized to be complementary to the seed and flanking regions of 3′UTR of CHD9 thus protecting the target. The target protector sequence for the targeting site of the CHD9 3′UTR was 5ʹCUUCCCUUUGCAGUAUUGCACUU3’.
Lentiviral vector construction
Lentiviral vectors were obtained from Abm Inc. (Richmond, Canada). And lentiviral vectors were sequenced by RiboBio (Guangzhou, China) to construct miR-130b-3p inhibitor lentivector (LV-miR-130b-3p inhibitor) or miRNA control lentivector (LV-NC). All lentivectors were packaged in HEK293T cells through lentivirus packaging mix (Abm, Richmond, Canada) following the protocols of manufacturer. Lentivectors were purified and infected SW480 cells with polybrene, and stable pools of infected SW480 cells were selected with 5 μg/ml puromycin.
In vivo experiments
Animal experiment protocols were approved by the Ethics Committee of the First Affiliated Hospital of Nanjing Medical University (Jiangsu, China). Sixteen 5-week-old female athymic BALB/c nude mice (weight, 16–20 g) were obtained from Chengdu Dossy Experimental Animals Co., Ltd. They were housed in standard cages at an ambient temperature of 20 ± 2°C with 12 h light or dark cycle and four mice in each cage. They were fed with commercial rat pellets and tap water ad libitum. Healthy mice that exhibited no significant difference in weight were included in this study. They were randomized into two groups: LV-NC and LV-miR-130b-3p inhibitor, with eight mice in each group. Sample size power analysis is based on α = 0.05, β = 0.20 using normal approximation. Stably infected SW480 cells (1 × 10⁶ cells in 10 μl phosphate-buffered saline (PBS) per mouse) containing LV-miR-130b-3p inhibitor or LV-NC were subcutaneously injected into the back of mice using a 25-gauge needle. In each group, mice were treated three times a week for a period of two weeks. Tumor initiation and progression were monitored once a week using an IVIS Spectrum system (Caliper Life Sciences). The tumor volume (V) = (Length × Width2)/2 was calculated every week. The tumor volume was observed every week for 4 weeks. The health and behaviors of animals were monitored every day. The mice in each group showed no abnormal symptoms, and the diet, body weight and behavior were normal. There was no death observed during the experiment. The maximum percentage of body weight loss was 10.2% in animals from start to endpoint. After a period of 28 days, 3% pentobarbital sodium (40 mg/kg) was intraperitoneally injected, and the nude mice were sacrificed via cervical dislocation. Five minutes after cardiac arrest, death was confirmed. The tumor was subsequently separated and weighed. Partial tumor sections were used for PCR and immunohistochemistry analysis. Investigators that analyzed the data were blind to experimental groups, which were unveiled after graph design and statistical analysis, that were carried out with GraphPad Prism.
Ki67 immunohistochemistry
The tumor tissues were obtained, dissected, and fixed in 10% buffered formalin. Then, the tumor was cut into 7-μm sections. Ki67 immunohistochemistry was used to detect the proliferation of Ki67 positive cells in the tumor tissues. Briefly, the sections were inactivated in 3% catalase for 15 min in an oven for 1 h at 60°C. Then, the sections were blocked with 5% bovine serum albumin for 30 min at 37°C. Subsequently, the sections were incubated with Ki67 rabbit polyclonal antibody (1:500; 27,309-1-AP, Proteintech, China) at 4°C overnight, followed by incubation with goat anti-rabbit IgG (1:1000; ab6721, Abcam) at 37°C for 30 min. Color rendering was performed using DAB (K5007, DAKO), and the sections were kept at room temperature for 8 min in the dark. Finally, images were captured using a microscope.
RNA extraction and real-time quantitative polymerase chain reaction (RT-qPCR)
Total RNAs were extracted from tissues, feces, and cells with TRIzol reagent (Invitrogen) and reverse transcribed into cDNA using the PrimeScript RT reagent kit (Takara, Dalian, Liaoning, China). MiRNAs were reverse transcribed into cDNA with the miScript II RT kit (Qiagen, USA). The SYBR® Premix Ex TaqTM II reagent kit (Takara) was used to carry out RT-qPCR on the MyIQ Real-Time PCR Detection System (Bio-Rad, Hercules, CA, USA). Briefly, the total qPCR volume was 20 µl, which contained 2 µl cDNA template (100 ng), 10 µl 2× SYBR Premix Ex Taq II, 0.8 µl primers (10 µM each), and 6.4 µl ddH2O [Citation30]. The PCR conditions were as follows: 95°C for 5 s; 55°C for 30s; and 72°C for 30s for 45 cycles. All RT-PCR reactions were performed in triplicate. U6 served as the endogenous control of miRNA, and GAPDH as the endogenous control of mRNA. The 2−ΔΔCT value indicated the relative expression of genes. The primer sequences of genes are shown in .
Table 1. Primer sequences used for RT-qPCR
Cell counting Kit-8 (CCK-8) assay
Cell viability was assessed with CCK-8 assay. In brief, SW480 and SW620 cells were seeded into 96-well plates (1 × 10³ cells/well). Next, 10 μL CCK-8 solution (Dojindo Laboratories, Kumamoto, Japan) was added to each well at 0, 24, 48 and 72 h for 2 h of incubation at room temperature. The absorbance at 450 nm was detected with a SpectraMax 190 microplate (Molecular Devices, Sunnyvale, CA).
5-ethynyl-2′-deoxyuridine (EdU) assay
Cell proliferation and DNA synthesis were detected by the Click-iT® EdU Assay Kit (Invitrogen). Briefly, CRC cells were seeded into 96-well plates at a density of 1 × 10⁵ cells/well. Then, 150 μl EdU medium (50 μmol/L) was added to each well, followed by the incubation for 2 h at 37°C. After that, cells were fixed with 4% paraformaldehyde at room temperature for 30 min and neutralized with 2 mg/ml glycine solution. Cells were washed with PBS, permeated with 0.5% Triton X-100, and subsequently incubated with prepared Click-iT reaction cocktail at room temperature for 30 min in the dark. DAPI was used to counterstain the nuclei at room temperature for 30 min, and stained cells were counted in five randomly selected fields using an inverted fluorescent microscopy (magnification, x200).
Flow cytometry analysis
For the analysis of apoptosis, SW480 and SW620 cells were seeded into 6-well plates at a density of 2 × 10⁵ cells/well. Cells were harvested and double stained with 5 µl Annexin V-FITC and 5 µl PI (Annexin V, FITC Apoptosis Detection kit; cat. no. AD10; Dojindo Molecular Technologies, Inc.) in the dark. Finally, apoptosis was detected using flow cytometry (FACScan®; BD Biosciences). CellQuest software (BD Biosciences) was used to analyze the data of apoptosis.
Terminal deoxynucleotidyl transferase dUTP nick end labeling (TUNEL) assay
Apoptotic cells were detected with TUNEL assay (Roche, Basel, Switzerland) as per the manufacturer’s instructions. The cells were digested with trypsin-EDTA (0.25%) and then seeded into 6-well plates at a density of 4 × 10⁴ cells/well. After fixation with 4% paraformaldehyde, cells were incubated in TUNEL reaction mixture at 37°C for 1 h. With DAB as a substrate for peroxidase, cells were incubated at 15 to 25°C for 10 min. Cell nuclei were stained with hematoxylin. Each cell smear was blindly divided into nine quadrants under an optical microscope (OLYMPUS, Tokyo, Japan). One field of view in each quadrant under the microscope was selected to be photographed. Number of apoptotic nuclei and total nuclei in the image was confirmed using Image-pro plus 6.0 software. Ratio of apoptotic nuclei in the total nuclei was calculated.
Western blotting analysis
Total protein was isolated from tissues and cells with radioimmunoprecipitation assay lysis buffer (Beyotime Institute, Haimen, China). The concentration of total protein was measured with a bicinchoninic acid protein assay kit. Equal amount of protein was separated by 10% SDS polyacrylamide gel electrophoresis and transferred to nitrocellulose membrane. The membrane was blocked with 5% nonfat bovine serum albumin at room temperature for 1 h, and then incubated with indicated primary antibodies at 4°C overnight. After washing, the membrane was incubated with HRP-conjugated secondary antibodies for 1 h at room temperature, and then detected and visualized with an enhanced chemiluminescence system (Pierce; Thermo Fisher Scientific, Inc.). Primary antibodies from Abcam Inc. (Cambridge, MA, USA) included anti-Bax (ab32503; Abcam), anti-Bcl-2 (ab32124; Abcam), anti-cleaved-caspase-3 (ab2302; Abcam), anti-caspase-3 (ab13847; Abcam) and anti-CHD9 (ab114115; Abcam). Anti-GAPDH (ab8245; Abcam) was utilized as a loading control.
Bioinformatics analysis
The binding sequence of miR-130b-3p and CHD9 3′UTR as well as the correlation of miR-130b-3p expression and CHD9 expression in COAD tissues was obtained at the starBase website (http://starbase.sysu.edu.cn). The overall survival (OS) curves of COAD patients with low or high CHD9 expression were obtained from Kaplan-Meier Plotter (https://kmplot.com/analysis/).
Dual luciferase reporter assay
CHD9 3′UTR fragments containing the predicted binding site of miR-130b-3p were amplified using PCR assay, and then inserted into the luciferase gene downstream of pmirGLO plasmid (Promega, Fitchburg, WI, USA) to obtain pmir-CHD9-Wt plasmids. Point mutations of the miR-130b-3p targeting site in the CHD9 3′UTR were generated using the QuickChange Multiple Site‐directed Mutagenesis Kit (Stratagene, La Jolla, CA). Then pmir-CHD9-Mut plasmids were obtained. SW480 and SW620 cells were seeded into 24-well plates at a density of 5 × 10⁴ cells/well and then co-transfected with luciferase reporter vectors comprising pmir-CHD9-Wt/Mut (0.4 µg) or empty pmir (0.4 µg), miR-218-5p mimics (50 nmol/l) or NC mimics (50 nmol/l) using Lipofectamine 2000 reagent (Invitrogen). The activity of firefly and renilla luciferase was detected after 48 h using dual luciferase reporter gene assay (Promega) following the manufacturer’s instructions. Firefly luciferase activity was normalized to renilla luciferase activity to calculate the relative luciferase activity.
Statistical analysis
Data are presented as means ± standard deviation (SD), and GraphPad Prism version 8.0 (San Diego, CA, USA) software was utilized for statistical analysis of data. All experiments were repeated at least three times. Student’s t-test (two groups) or one-way ANOVA (no less than three groups) was adopted to analyze the statistical significance. The correlation between miR-130b-3p and CHD9 in CRC tissues was analyzed by Pearson linear regression. p < 0.05 was considered statistically significant.
Results
MiR-130b-3p is upregulated in CRC tissues and cells
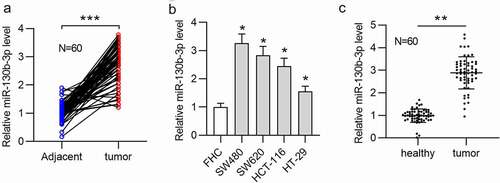
First, we measured the miR-130b-3p level in CRC samples. The results of RT-qPCR showed that miR-130b-3p had a significantly upregulated expression in CRC tissues compared with adjacent normal tissues ()). Next, based on the median expression level of miR-130b-3p in CRC tissues, 60 tissues were sorted into two groups (high/low miR-130b-3p group). Statistical analysis revealed that miR-130b-3p was closely related to distant metastasis (p = 0.002), lymph node metastasis (p = 0.015), and vascular invasion (p = 0.017) (). Additionally, the miR-130b-3p level was higher in CRC cell lines (SW480, SW620, HCT-116 and HT-29) than in a human normal colonic epithelial cell line (FHC) ()). Because of the relatively high expression of miR-130b-3p in SW480 and SW620 cell line, further cell experiments were conducted in these two cell lines. We further found the significant abundance of miR-130b-3p in feces of CRC patients compared to feces of healthy individuals ()).
Table 2. Correlation between miR-130b-3p expression and clinicopathological features of CRC patients
Figure 1. MiR-130b-3p is upregulated in CRC tissues, cells, and feces of patients.
MiR-130b-3p knockdown represses CRC cell proliferation and promotes apoptosis
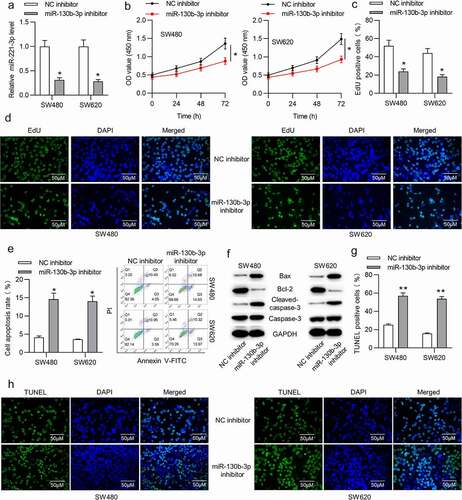
To determine the function of miR-130b-3p in CRC, in vitro experiments were carried out. Before that, we transfected miR-130b-3p inhibitor or NC inhibitor into SW480 and SW620 cells to knock down miR-130b-3p. RT-qPCR showed that the miR-130b-3p level was decreased in CRC cells after transfection with miR-130b-3p inhibitor ()). CCK-8 assay revealed that miR-130b-3p inhibitor repressed the viability of SW480 and SW620 cells ()). Moreover, according to EdU assay, miR-130b-3p downregulation reduced the number of proliferative SW480 and SW620 cells ()). In addition, flow cytometry analysis was performed to examine the apoptosis. As shown, the rate of SW480 and SW620 cell apoptosis was significantly increased after miR-130b-3p knockdown ()). Furthermore, the Western blotting results suggested that the protein expression of Bax and cleaved-caspase-3 was upregulated and that of Bcl-2 was reduced in CRC cells transfected with miR-130b-3p inhibitor ()). TUNEL staining illustrated that miR-130b-3p knockdown increased the apoptotic proportion in SW480 and SW620 cells ()).
Figure 2. MiR-130b-3p knockdown represses CRC cell proliferation and promotes apoptosis.
MiR-130b-3p knockdown inhibits CRC tumor growth in vivo
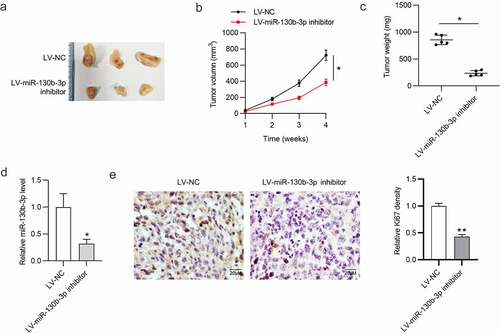
To explore the influence of miR-130b-3p on tumor growth in CRC, a mouse xenograft model was established. We subcutaneously injected SW480 cells stably expressing LV-miR-130b-3p inhibitor or LV-NC into nude mice. As shown in ), tumor size, volume, and weight were significantly reduced in the LV-miR-130b-3p inhibitor group. We found that the miR‐130b‐3p level was greatly reduced in surgically resected tumor tissues with LV-miR-130b-3p inhibitor ()). Furthermore, the expression level of cell proliferation marker Ki67 was markedly reduced in the miR-130b-3p knockdown group compared to the control group ()).
Figure 3. MiR-130b-3p knockdown inhibits CRC tumor growth in vivo.
CHD9 is downregulated in CRC
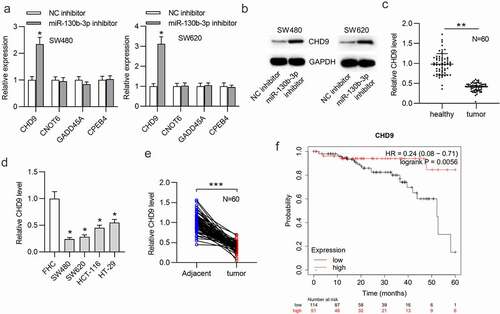
The downstream targets of miR-130b-3p were identified. We found four mRNAs potentially binding to miR-130b-3p by overlapping the prediction results from PITA, RNA22, microT, miRmap, PicTar, TargetScan and miRanda at the starBase website. The RT-qPCR results suggested that CHD9 expression was significantly increased in CRC cells transfected with miR-130b-3p inhibitor, while the expression levels of the other predicted targets were undisturbed ()). This can be explained by the notion that different genes are specifically targeted by different miRNAs. According to the Western blotting results, miR-130b-3p downregulation markedly increased the CHD9 protein level in SW480 and SW620 cells ()). Additionally, CHD9 was found to be significantly downregulated in CRC tissues and cells ()). The expression of CHD9 in feces of CRC patients was low ()). It was revealed in Kaplan-Meier Plotter database that colorectal adenocarcinoma (COAD) patients with a low CHD9 level had shorter OS time than those with a high CHD9 level ()). These findings suggested that CHD9 may play a role in CRC.
Figure 4. CHD9 is downregulated in CRC.
CHD9 overexpression inhibits CRC cell proliferation and promotes apoptosis
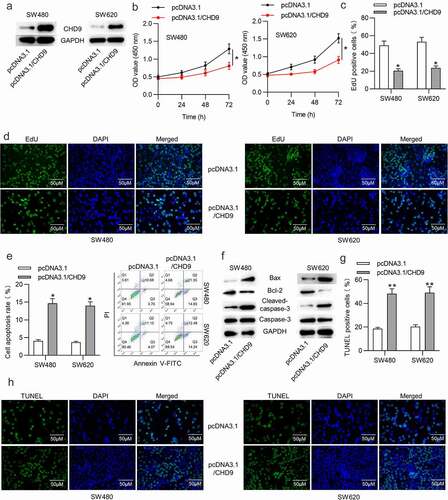
Next, the function of CHD9 in CRC cells was investigated. The pcDNA3.1/CHD9 or empty pcDNA3.1 vector was transfected into SW480 and SW620 cells. Western blotting showed that the CHD9 level was increased in CRC cells after transfection with pcDNA3.1/CHD9 ()). CCK-8 and EdU assays suggested that CHD9 overexpression reduced the proliferation of SW480 and SW620 cells ()). The rate of CRC cell apoptosis was significantly increased after CHD9 overexpression, as shown by flow cytometry analysis ()). Furthermore, the protein expression of Bax and cleaved-caspase-3 was upregulated and that of Bcl-2 was reduced in CRC cells when CHD9 was upregulated ()). TUNEL staining further demonstrated that CHD9 overexpression increased the apoptosis of SW480 and SW620 cells ().
Figure 5. CHD9 overexpression inhibits CRC cell proliferation and promotes apoptosis.
CHD9 is targeted by miR-130b-3p
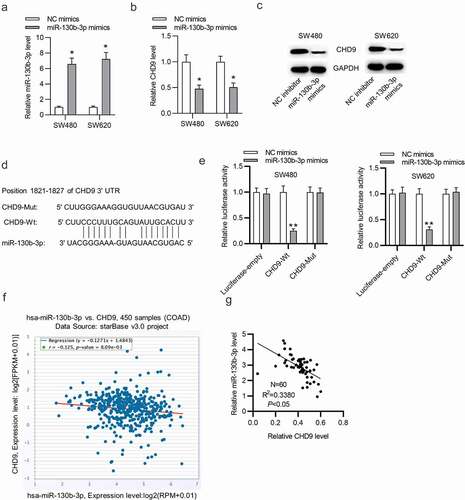
We further tested the targeted relationship between miR-130b-5p and CHD9. RT-qPCR demonstrated the overexpression efficiency of miR-130b-5p mimics and showed that miR-130b-5p was notably overexpression after transfection ()). Subsequently, RT-qPCR and Western blotting analyses showed that miR-130b-3p overexpression reduced the expression level of CHD9 mRNA and protein ()). The binding site of miR-130b-5p in the 3ʹUTR of CHD9 was predicted in starBase ()). SW480 and SW620 cells were transfected with each plasmid, in conjunction with miR-130b-5p mimics or NC mimics, and luciferase activity was measured at 48 h. As shown in ), the cells with wild type CHD9 3ʹUTR plasmid showed significantly reduced luciferase activity with the co-transfected miR-130b-5p mimics compared to the NC mimics. The cells co-transfected with mutant CHD9 3ʹUTR or empty luciferase plasmid were able to significantly restore luciferase activity in the presence of miR-130b-5p mimics. Therefore, miR-130b-5p directly targets the 3ʹUTR of CHD9. Data in starBase suggest that CHD9 expression is negatively related to miR-130b-3p expression in COAD tissues ()). Moreover, a negative relationship between CHD9 expression and miR-130b-3p expression in the collected CRC tissues was found ()).
Figure 6. CHD9 is targeted by miR-130b-3p.
MiR-130b-3p influences cell growth in CRC by inhibiting CHD9
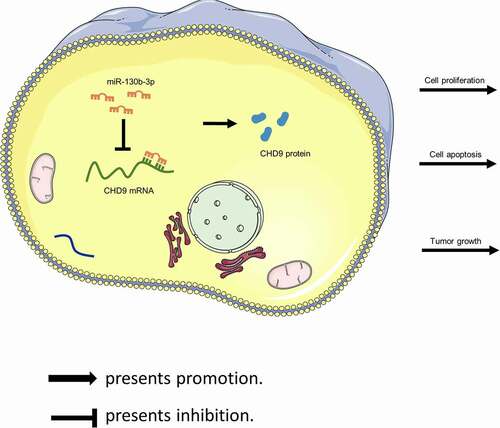
Target protectors were used to confirm whether the direct targeting of the CHD9 3ʹUTR by miR-130b-3p is a mechanism for the increased cell growth observed with high miR-130b-3p levels. These single-stranded, modified RNAs specifically interfere with the interaction of a miRNA with a single endogenous mRNA target site, while leaving the regulation of other targets of the same miRNA unaffected. Target protectors were designed for the miR-130b-3p target site in the CHD9 3ʹUTR. Transfection of CRC cells with miR-130b-3p mimics decreased the CHD9 mRNA and protein levels compared to NC mimics; however, use of CHD9 target protectors (TP-CHD9) in addition to the miR-130b-3p mimics prevented miR-130b-3p mediated reduction of CHD9 levels. The levels were higher than with the miR-130b-3p mimics alone and were similar to levels in the NC mimics transfected cells ()). In SW480 and SW620 cells, miR-130b-3p mimics increased cell proliferation, whereas use of the TP-CHD9 in addition to miR-130b-3p mimics inhibited cell proliferation ()). Apoptosis was significantly inhibited with miR-130b-3p mimics alone compared to miR-130b-3p mimics plus TP-CHD9 co-transfection; miR-130b-3p thus appeared to inhibit CRC cell apoptosis by directly inhibiting CHD9 ()), with the specific target protectors blocking this inhibition. Conversely, the NC target protector (TP-NC) was unable to protect CHD9 from miR-130b-3p binding and regulation, with miR-130b-3p mimics plus TP-NC co-transfection increasing cell growth and reducing apoptosis compared to NC mimics and compared to miR-130b-3p mimics plus TP-CHD9 co-transfection, to a similar extent as with miR-130b-3p mimics. A schematic illustration shows that miR-130b-3p promotes CRC progression by inhibiting CHD9 ().
Figure 7. MiR-130b-3p influences CRC cell growth by inhibiting CHD9. (a-b) CHD9 mRNA and protein levels in NC mimics, miR-130b-3p mimics, miR-130b-3p mimics plus TP-NC, and miR-130b-3p mimics plus TN-CHD9 transfected SW480 and SW620 cells at 48 h post-transfection. (c) The viability and (d-e) proliferation of SW480 and SW620 cells transfected with NC mimics, miR-130b-3p mimics, miR-130b-3p mimics plus TP-NC, and miR-130b-3p mimics plus TN-CHD9 were examined using CCK-8 and EdU assays. Data are presented as the mean ± SD from three independent experiments. Comparisons between two groups were analyzed using Student’s t-test. Multiple comparisons were analyzed using one-way ANOVA, post-hoc LSD test. *p < 0.05, **p < 0.01, ***p < 0.001.
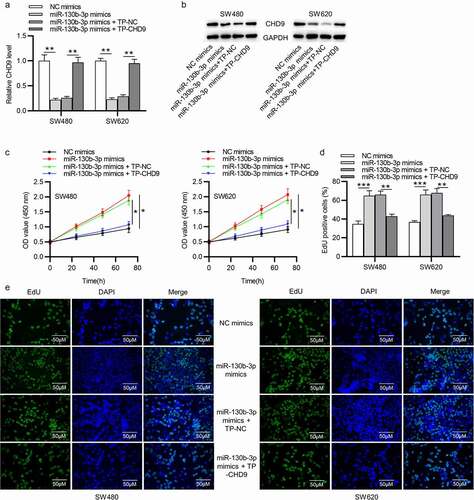
Figure 8. MiR-130b-3p influences CRC cell growth by inhibiting CHD9. (a) The apoptosis rate and (b-c) TUNEL-positive cells of SW480 and SW620 cells transfected with NC mimics, miR-130b-3p mimics, miR-130b-3p mimics plus TP-NC, and miR-130b-3p mimics plus TN-CHD9 were examined using flow cytometry, and TUNEL, respectively. Data are presented as the mean ± SD from three independent experiments. Comparisons between two groups were analyzed using Student’s t-test. Multiple comparisons were analyzed using one-way ANOVA, post-hoc LSD test. *p < 0.05, **p < 0.01, ***p < 0.001.
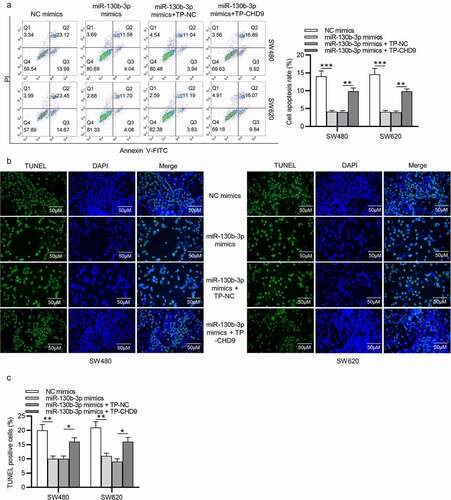
Figure 9. Schematic illustration showing that miR-130b-3p promotes CRC progression by inhibiting CHD9.
Discussion
In the last few years, strong evidence reinforces the use of miRNA detection in body fluids as a novel and promising approach for CRC screening [Citation31,Citation32]. We demonstrated that miR-130b-3p significantly upregulated in CRC could be detected in feces from patients with such a neoplasm. A previous study indicated that CRC cell-derived exosomal miR-25-3p, miR-130b-3p and miR-425-5p collectively facilitates epithelial-mesenchymal transition and metastasis of CRC [Citation24]. In this study, we verified the upregulation of miR-130b-3p expression in CRC tissues and cells. Moreover, functional experiments demonstrated that miR-130b-3p knockdown inhibited CRC cell proliferation and accelerated apoptosis in vitro, as well as inhibited tumor growth in vivo, while its overexpression had an opposite effect. These findings showed that miR-130b-3p may play an oncogenic role in CRC progression. However, miR-130b-3p has been shown to have different functions in different cancer types. MiR-130b-3p is overexpressed and functions as an oncogene in thyroid adenomas [Citation33] and epithelial ovarian cancer [Citation34]. It also acts as a tumor suppressor in breast carcinoma [Citation25] and ovarian cancer [Citation35]. It is highly suggestive of the tissue specificity of miR-130b-3p. All these studies support the previous notion that biological functions of miRNAs are varying as one particular miRNA may act as an oncogenic miRNA as well as a tumor suppressive miRNA, depending on the cellular and molecular context [Citation36].
In this study, we confirmed that CHD9 was an unreported direct target of miR-130b-3p using a luciferase reporter assay. Recent evidence has shown that CHD9 performs an important role in human cancers, such as gastric cancer [Citation37] and clear cell renal cell carcinoma [Citation28]. Previous research showed that patients with high CHD9 expression have a better prognosis and that CHD9 expression is an independent predictor for CRC, implying that CHD9 is a putative tumor suppressor gene and a new potential prognostic biomarker in CRC [Citation29]. Here, we investigated the biological function of CHD9 in CRC cells. Our findings revealed that CHD9 overexpression significantly suppressed CRC progression through reducing cell proliferation and increasing apoptosis. We also demonstrated the negative relationship between CHD9 expression and miR-130b-3p expression in CRC. To verify whether the direct targeting of the CHD9 3ʹUTR by miR-130b-3p is a mechanism for the increased cell growth observed with high miR-130b-3p levels, the miRNA binding site of miR-130b-3p in the CHD9 3ʹUTR was masked by target protectors (TPs). In this case, only the binding of miR-130b-3p to CHD9 was inhibited. We found that use of CHD9 TPs significantly attenuated the oncogenic effect of miR-130b-3p overexpression in CRC. Thus, inhibition of CHD9 expression is likely to be a key mechanism by which miR-130b-3p increases CRC cell growth. As just described above, the function of CHD9 in cancer is controversial, because no distinct evidence for a role of CHD9 as an oncogene or tumor-suppressive gene has been shown. The present study revealed that CHD9 may play a tumor-suppressive role in OSCC.
Conclusions
In conclusion, the current study demonstrates that miR-130b-3p affects CRC cell proliferation, apoptosis, and tumor growth, which is mediated at least partially through targeting CHD9, and miR-130b-3p plays an oncogenic role in the tumorigenesis of CRC. These results implied that miR-130b-3p might be a new target for the treatment of CRC as an oncogene. This study may provide a theoretical basis for the diagnosis and treatment of CRC patients. Our research has certain limitations. The animal samples should be increased in the future to further verify the clinical significance of our findings. The precise molecular mechanisms about the related signaling pathways targeted by the miR-130b-3p/CHD9 axis remain unclear and require further explorations.
Ethics approval and consent to participate
Written informed consent was obtained from all participants. The study complied with the Declaration of Helsinki and was approved by the Ethics Committee of the First Affiliated Hospital of Nanjing Medical University (Jiangsu, China).
Authors’ contributions
DS, QZ and XCS conceived and designed research; QZ, HZ and LLZ performed the research; DS analyzed the data; QZ wrote the paper; XCS edited the manuscript. All authors approved final version of manuscript.
Availability of data and materials
All data from this study are available in this published article.
Supplemental Material
Download Zip (428.7 KB)Disclosure statement
No potential conflict of interest was reported by the author(s).
Supplementary material
Supplemental data for this article can be accessed here
Additional information
Funding
References
- Castells A. Hereditary forms of colorectal cancer. Gastroenterol Hepatol. 2016 Sep;39(Suppl 1):62–67.
- Ferlay J, Colombet M, Soerjomataram I, et al. Estimating the global cancer incidence and mortality in 2018: GLOBOCAN sources and methods. Int J Cancer. 2019 Apr 15;144(8):1941–1953.
- Torre LA, Bray F, Siegel RL, et al. Global cancer statistics, 2012. CA Cancer J Clin. 2015 Mar;65(2):87–108.
- Ferlay J, Soerjomataram I, Dikshit R, et al. Cancer incidence and mortality worldwide: sources, methods and major patterns in GLOBOCAN 2012. Int J Cancer. 2015 Mar 1;136(5):E359–86.
- Wang X, Kuang YY, Hu XT. Advances in epigenetic biomarker research in colorectal cancer. World J Gastroenterol. 2014 Apr 21;20(15):4276–4287.
- Young GP, Rabeneck L, Winawer SJ. The global paradigm shift in screening for colorectal cancer. Gastroenterology. 2019 Mar;156(4):843–851.e2.
- Steele RJ, Rey JF, Lambert R. European guidelines for quality assurance in colorectal cancer screening and diagnosis. First edition–professional requirements and training. Endoscopy. 2012 Sep;44(Suppl 3):Se106–15.
- Maida M, Macaluso FS, Ianiro G, et al. Screening of colorectal cancer: present and future. Expert Rev Anticancer Ther. 2017 Dec;17(12):1131–1146.
- Bibbins-Domingo K, Grossman DC, Curry SJ, et al. Screening for colorectal cancer: US preventive services task force recommendation statement. Jama. 2016 Jun 21;315(23):2564–2575.
- Dickinson BT, Kisiel J, Ahlquist DA, et al. Molecular markers for colorectal cancer screening. Gut. 2015 Sep;64(9):1485–1494.
- Navarro M, Nicolas A, Ferrandez A, et al. Colorectal cancer population screening programs worldwide in 2016: an update. World J Gastroenterol. 2017 May 28;23(20):3632–3642.
- Gupta S, Halm EA, Rockey DC, et al. Comparative effectiveness of fecal immunochemical test outreach, colonoscopy outreach, and usual care for boosting colorectal cancer screening among the underserved: a randomized clinical trial. JAMA Intern Med. 2013 Oct 14;173(18):1725–1732.
- Quintero E, Castells A, Bujanda L, et al. Colonoscopy versus fecal immunochemical testing in colorectal-cancer screening. N Engl J Med. 2012 Feb 23;366(8):697–706.
- Morales S, Monzo M, Navarro A. Epigenetic regulation mechanisms of microRNA expression. Biomol Concepts. 2017 Dec 20;8(5–6):203–212.
- Lin YH. MicroRNA networks modulate oxidative stress in cancer. Int J Mol Sci. 2019 Sep 11;20:18.
- Ghalehnoei H, Bagheri A, Fakhar M, et al. Circulatory microRNAs: promising non-invasive prognostic and diagnostic biomarkers for parasitic infections. Eur J Clin Microbiol Infect Dis. 2020 Mar;39(3):395–402.
- Esquela-Kerscher A, Slack FJ. Oncomirs - microRNAs with a role in cancer. Nat Rev Cancer. 2006 Apr;6(4):259–269.
- Bushati N, Cohen SM. microRNA functions. Annu Rev Cell Dev Biol. 2007;23:175–205.
- Thomson JM, Newman M, Parker JS, et al. Extensive post-transcriptional regulation of microRNAs and its implications for cancer. Genes Dev. 2006 Aug 15;20(16):2202–2207.
- Slaby O, Svoboda M, Fabian P, et al. Altered expression of miR-21, miR-31, miR-143 and miR-145 is related to clinicopathologic features of colorectal cancer. Oncology. 2007;72(5–6):397–402.
- Mendell JT, Olson EN. MicroRNAs in stress signaling and human disease. Cell. 2012 Mar 16;148(6):1172–1187.
- Di Leva G, Croce CM. miRNA profiling of cancer. Curr Opin Genet Dev. 2013 Feb;23(1):3–11.
- Duran-Sanchon S, Moreno L, Augé JM, et al. Identification and validation of MicroRNA profiles in fecal samples for detection of colorectal cancer. Gastroenterology. 2020 Mar;158(4):947–957.e4.
- Wang D, Wang X, Si M, et al. Exosome-encapsulated miRNAs contribute to CXCL12/CXCR4-induced liver metastasis of colorectal cancer by enhancing M2 polarization of macrophages. Cancer Lett. 2020 Apr 1;474:36–52.
- Shui Y, Yu X, Duan R, et al. miR-130b-3p inhibits cell invasion and migration by targeting the notch ligand delta-like 1 in breast carcinoma. Gene. 2017 Apr 20;609:80–87.
- Yan W, Wang Y, Chen Y, et al. Exosomal miR-130b-3p promotes progression and tubular formation through targeting PTEN in oral squamous cell carcinoma. Front Cell Dev Biol. 2021;9:616306.
- Lamar KJ, Carvill GL. Chromatin remodeling proteins in epilepsy: lessons from CHD2-associated epilepsy. Front Mol Neurosci. 2018;11:208.
- Guan B, Ran XG, Du YQ, et al. High CHD9 expression is associated with poor prognosis in clear cell renal cell carcinoma. Int J Clin Exp Pathol. 2018;11(7):3697–3702.
- Xu L, Peng H, Huang XX, et al. Decreased expression of chromodomain helicase DNA-binding protein 9 is a novel independent prognostic biomarker for colorectal cancer. Braz J Med Biol Res. 2018 Jul 23;51(9):e7588.
- Zhang C, Gao GR, Lv CG, et al. Protease-activated receptor-2 induces expression of vascular endothelial growth factor and cyclooxygenase-2 via the mitogen-activated protein kinase pathway in gastric cancer cells. Oncol Rep. 2012 Nov;28(5):1917–1923.
- Herreros-Villanueva M, Duran-Sanchon S, Martín AC, et al. Plasma MicroRNA signature validation for early detection of colorectal cancer. Clin Transl Gastroenterol. 2019 Jan;10(1):e00003.
- Slaby O. Non-coding RNAs as biomarkers for colorectal cancer screening and early detection. Adv Exp Med Biol. 2016;937:153–170.
- Leone V, Langella C, Esposito F, et al. miR-130b-3p upregulation contributes to the development of thyroid adenomas targeting CCDC6 gene. Eur Thyroid J. 2015 Dec;4(4):213–221.
- Zhou D, Zhang L, Sun W, et al. Cytidine monophosphate kinase is inhibited by the TGF-β signalling pathway through the upregulation of miR-130b-3p in human epithelial ovarian cancer. Cell Signal. 2017;35:197–207.
- Chan CK, Pan Y, Nyberg K, et al. Tumour-suppressor microRNAs regulate ovarian cancer cell physical properties invasive behaviour. Open Biol. 2016 Nov;6(11):160275.
- Svoronos AA, Engelman DM, Slack FJ. OncomiR or tumor suppressor? The duplicity of MicroRNAs in cancer. Cancer Res. 2016 Jul 1;76(13):3666–3670.
- Xia T, Pan Z, Zhang J. CircPDZD8 promotes gastric cancer progression by regulating CHD9 via sponging miR-197-5p. Aging (Albany NY). 2020 Oct 13;12(19):19352–19364.