
ABSTRACT
There are two main types of growth hormone (GH) in the circulatory system. One is 22 kD-GH, which is the predominant isoform in the circulating system, 90% GH is present as a 22 kD protein, and 10% of GH is present as a 20 kD protein. Amino acid sequences are identical between 20 kD-GH and 22 kD-GH protein, except that 20 kD-GH lacks 15 amino acid residues 32 to 46. Studies have shown that GH has many important biological effects on mesenchymal stem cells (MSCs). However, so far, the cellular characteristics of the two types of GH have not been studied in BM-MSCs. Furthermore, the biological activity of 20 kD-GH has not been explored in BM-MSCs. For this, in the current work, BM-MSCs were used as in vitro cell model. We have carried out the current research using a series of experimental techniques (such as Western-blot and indirect immunofluorescence). Firstly, we explored the cell behavior of two types of GH in the Bm-MSC model and found that they showed different biological characteristics; Secondly, we investigated the biological characteristics of 20 kD-GH and 22 kD-GH, and results showed that 22 kD-GH and 20 kD-GH exhibited different signaling profiles; Thirdly, we found that the 20 kD-GH and 22 kD-GH Gexhibited different regulatory effects on the osteogenic differentiation of BM-MSCs. The current research lays a solid foundation for further studies on the regulatory effects of GH on MSCs.
Introduction
The human growth hormone (GH) gene is 1.65 kilobase pairs (KB) in length, including 5 exons and 4 introns [Citation1]. The only difference is that 20 kD-GH lakes 15 amino acid (residues 32 to 46) compared to 22 kD-GH [Citation1]. GH binding to GHR induces specific conformational changes of GHR, and then phosphorylates the tyrosine of JAK2 (Janus Kinase 2), which then activates the phosphorylation of a variety of down-stream signaling proteins [Citation2]. After activation, JAK2/GHR can trigger downstream signal adaptor proteins, such as SHC, and then a series of downstream signaling molecules are activated, such as MAPK, PI3K, STATs, and so on [Citation3]. These intracellular signal molecules can regulate gene expression and play different biological roles in growth, development, and metabolism.
Mesenchymal stem cells (MSCs) are a kind of pluripotent stem cells derived from mesoderm [Citation4]. MSCs can be derived from bone marrow, muscle, fat and other tissues [Citation5]. In the late 1960s, German scientists first confirmed the existence of non-hematopoietic stem cells in bone marrow [Citation4]. Since then, bone marrow has become one of the most important sources of MSCs. Bone marrow mesenchymal stem cells (BM-MSCs), as a source of adult stem cells, are widely used in regenerative medicine [Citation6]. MSCs have strong proliferation, renewal and multidirectional differentiation potential. The cells can be induced to differentiate into different types of cells in a suitable microenvironment in vivo or in vitro, including chondrocytes, osteoblasts, adipocytes, and so on [Citation7]. In addition, MSC cells have low immunogenicity, and they can also secrete a variety of bioactive macromolecules with immune regulation function. These bioactive macro-molecules play a role in rebuilding the biological microenvironment and in repairing tissue damage [Citation8]. Based on these special biological characteristics, MSCs show their unique advantages in the treatment of many diseases and the application of tissue engineering, for example: 1) BM-MSCs play an important role in the repair of fractures. The destruction of blood vessels caused by fractures creates a local oxygen deficient environment, which can promote BMSCs to be recruited to the fracture site at the initial stage of fracture, and the cytokines released by BMSCs have specific anti-inflammatory effects; 2) MSCs have shown good potential value for application in the treatment of allograft rejection, inhibition of autoimmune diseases and inhibition of abnormal immune response in inflammatory diseases [Citation7]. With the development of stem cell technology, BM-MSCs are expected to be used in a wider range of fields.
The biological activity and function of stem cells are regulated by endocrine system [Citation9]. In recent years, studies have shown that GH plays an important regulatory role in MSCs [Citation10]. It has been reported that physiological levels of GH inhibit the lipid accumulation of MSCs, and the lipogenesis-related gene expression is reduced [Citation11]. Additionally, it has been reported that GH can synergize with BMP9 to modulate MSC differentiation. Huang et al. (2012) found that a combined treatment of BMP9 synergized with GH could induce a greater expression of markers of osteogenesis [Citation12]. In short, these works indicated that GH plays an important role in the regulation of MSCs differentiation.
It is well known that the biological activity of GH is closely related to its cell behavior [Citation13]. In the present study, we studied and compared the biological characteristics of 22 kD-GH and 20 kD-GH in MSC model. We first revealed the cellular behavior of 22 kD-GH and 20 kD-GH. Additionally, further studies showed that 20 kD-GH and 22 kD-GH display different biological activities. The current research lays a solid foundation for further study of the regulatory effects of GH on MSCs.
2. Materials and Methods
2.1 Reagents and Materials
Anti-GHR (catalog: ab134078, 1:2000 dilution), anti-p-STAT5 (catalog: ab32364, 1:1000 dilution), anti-STAT5 (1:1000 dilution) were obtained form Abcam (UK). 20 kD-GH was purchased from Mybiosource (USA). 22 kD-GH was purchased from from Sigma-Aldrich (USA). Alexa Fluor 488 and Alexa Fluor 555 were obtained from Thermo-Fisher Scientific (USA). Anti-JAK2 (catalog:#3230, 1:1000 dilution), Anti-pJAK2 (catalog #3776, 1:2000 dilution). anti-STAT3 (catalog:#9139, 1:500 dilution), and anti-p-STAT3 (catalog:#4074, 1:1000 dilution) were purchased form CST (USA). The Bovine serum albumin (BSA) and skimmed milk powder were from Beyotime (Shanghai, China). DMEM medium and fetal bovine serum (FBS) was purchased from Thermo Fisher (USA). Anti-GHR antibody (catalog: ab155276, 1:1000 dilution) was from Abcam. The Nuclear/Cytoplasmic Extraction Reagent Kits were purchased from Pierce (USA). Unless otherwise specified, all reagents are purchased from Sigma-Aldrich (USA).
2.2 Cell culture
Human bone marrow derived mesenchymal stem cells (Bm-MSC) were purchased from Thermo-Fisher (catalog: A15652, StemPro™). The cells were cultured in stem cell culture medium (Thermo-Fisher). Bm-MSCs were carefully observed under an inverted microscope, when the cell growth reached 70-80%, cells were passaged using 0.25% trypsin.
2.3 Western-blot
The BM-MSCs were digested with 0.25 trypsin, and the cells were then collected with a cell scraper. The cells were then added to the RIPA cell lysis buffer (150 uL) with protease inhibitors and lysed on ice for 30 min. BCA kit was used to determine the concentration of the extracted cell protein according to the manufacturer’s instructions. The protein samples were fixed with 5 × Loading Buffer in a 4:1 volume ratio and boiled at 95°C for 15 min. Protein samples were separated using SDS-page. Skimmed milk powder was used to seal the PVDF membrane on a shaker at room temperature for 2 h. After blocking, the PVDF membranes were rinsed 3 times with TBST solution (5 min each time). Then, the cell membranes were incubated with the primary antibodies (JAK2 1:1000, GADPH 1:1000, RUNX2 1:1000, OCN 1:1000, p-STAT5 1:1000, STAT5 1:1000) at 4°C overnight, followed by incubating with secondary antibody (1:3000 dilution) at 37°C for 2 h. The membranes were washed for 2–3 times (5 min each time) on a shaker at room temperature. The PVDF membranes were then exposed to ECL to detect protein bands.
2.4 RT-PCR
PBS solution was added to the cell culture dish to rinse the cells for 2–3 times, and then trypsin (0.25%) was added to the cells and incubated at 37°C for 1–3 min, after which the medium containing 10% FBS was added to neutralize trypsin. The cell suspensions were collected and centrifuged at 300 g for 5 min. After discarding the supernatant, the RNA was extracted using Trizol according to the manufacturer's instructions. The total RNA was reverse transcribed into cDNA, and then RT-PCR was performed.
2.5 Immunofluorescence staining
MSCs were seeded on the slides. When cells reached 50–60% confluence. The slides were exposed to 20 kD-GH and 22 kD-GH for the indicated time points. The cells were then fixed using 4% paraformaldehyde (PFA) for 10 min. The cells were permeabilized with Triton-X 100 (Sigma-Aldrich) for 15 min. 5% BSA was then used to block the cell for 2 h at 37°C. After washing, the primary antibody was added and incubated at 37°C for 2 h. After washing, the secondary antibody is added and incubated for 1 h at 37°C. All images were acquired with a laser scanning confocal microscope (Leica SP5).
2.6 The osteogenic differentiation of Bm-MSCs
Cells were seeded in 6-well culture plates and incubated at 37°C for 12 h in a humidified incubator with 5% CO2 at 37°C. BM BMCs at passage P3 were then osteogenically induced to differentiate between two and three rinses, of sterile water using stempro™ Osteogenic differentiation Kit according to manufacture instruction (StemPro™, A1007201, ThermoFisher Scientific).
2.7 Alkaline phosphatase staining
Alkaline phosphatase staining was performed according to the instructions of the alkaline phosphatase staining kit (Thermo-Fisher). The culture medium was discarded in the cell plate after osteogenic differentiation, the cells were washed three times with PBS, and 4% Paraformaldehyde was added to the 6-well plate to fix the cells at room temperature for about 3 min. After the cells were washed once again with PBS, the ALP staining solution was added to the 6-well cell culture plate (avoiding strong light), and stood at room temperature for about 15–30 min. Cell samples were observed under a microscope.
In addition, ALP activity was detected using an ELISA kit according to the instructions of the kit (Beyotime, catalog: P0321S).
2.8 Detection of cell proliferation by MTT
The cells were digested with trypsin (0.25%) to prepare a cell suspension. The cells were seeded into a 24-well cell culture plate at (1x10⁴/well), and each treatment was repeated three times. 20 kD-GH and 22 kD-GH were then added, respectively, and the cells continued to be cultured for 24–72 h,20 μL of MTT solution was added to each well and incubated for 1 h. The OD value at a wavelength of 450 nm was detected using a microplate reader (OD450). The cell proliferation was compared according to the OD value from each group.
2.9 Determination of cell cycle
Bm-MSC was digested into a single cell with 0.25% trypsin and seeded in a 6-well cell culture plate. Approximately 1 × 10⁵ cells were seeded into 6-well Cell Culture plates and cultured at 37°C, 5% CO2 for 24–48 h. When the cell confluence reached about 80%, they were digested into single cell with 0.25% trypsin and centrifuged at 1000 rpm for 5 min. The supernatant was then discarded and washed with PBS three times. After washing, the cells were centrifuged at 1000 rpm for 3 min. The supernatant was discarded, and the cells were resuspended into single cells in PBS, 70% ethanol was added and incubated overnight at 4°C. After the cells were fixed, the cells were centrifuged at 1000 rpm for 5 min, after which, the supernatant was then discarded. The cells were resuspended on PBS, and 2 μL RNase (100 mg/mL) was then added and incubated at room temperature for 30 min. 10 uL PI was added and incubated in the dark for 15 min, the cell samples were then detected by Flow Cytometry.
2.10 Detection of cell apoptosis by AnnexinV-FITC/PI kit
The cells were digested with 0.25% trypsin into single cells, resuspended in normal medium. The cells were then seeded in a 6-well plate, each well was seeded with approximately 5 × 10⁵ cells, and incubated at 37°C with 5% CO2 for 12 h. When the cell confluence reached about 80% (the cells were in the logarithmic growth phase), they were digested with 0.25% trypsin into single cells. The cells were transferred into a centrifuge tube, and the cells were centrifuged at 1,000 rpm for 3 min. The cells were then resuspended in 2 mL PBS, and centrifuged at 1000 rpm for 3 min. The cell density was adjusted to 1 × 10⁶ cells/ml. The cells were stained with PI and Annexin V-FITC solution. Flow cytometry analysis was performed after cell staining.
2.11 Analysis of internalization of 22 kD-GH and 20 kD-GH in Bm-MSCs
Bm-MSCs were seeded on microscope coverslips for 48 h before staining. After the GH treatment, the slides were fixed with 4% paraformaldehyde for 10 min at 37°C, permeabilized with 0.4% Triton X-100 in PBS for 15 min, after which, the cell samples were observed by CLSM, and all images were obtained using a Leica SP5 Laser scanning confocal microscope. Image J was used to analyze fluorescent images of cells.
2.12 Statistical analysis
Data are presented as mean ± standard deviation (SD) from at least three independent experiments. Statistical analysis was performed using Prism 8.0.1 (GraphPad Software). Student’s t-test and analysis of variance (ANOVA) followed by Tukey’s test were used to evaluate the significance of differences. P < 0.05 indicated a significant difference between means.
3. Results
3.1 Detection of GHR expression in Bm-MSCs
In this work, the GHR expression pattern in Bm-MSCs was evaluated. The experimental results show that GHR is mainly expressed on the cell membrane and cell cytoplasm ().
Figure 1. Analysis of GHR expression by CLSM. Bm-MSCs were seeded on the slides. When cells reached 50–60% confluence. The cells were fixed using 4% PFA for 10 min at RT. After washing, the cells were permeabilized Triton-X 100 for 15 min. The cells were then blocked with 5% BSA for 2 h at 37°C. After three washes, anti-GHR antibody was added and incubated at 37°C for 2 h.After three washes, the secondary antibody was added and incubated for 1 h at 37°C. All images were acquired with a laser scanning confocal microscope (Leica SP5).
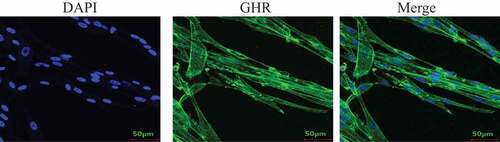
Figure 2. Internalization of 22 kD-GH and 20 kD-GH. The Bm-MSCs were digested with 0.25% trypsin into single cells, and re-suspended in normal medium. The cells were then seeded in a 6-well plate. The cells were serum-starved for 6 h, the cells were then incubated with FITC-20-kD-GH or FITC-22 kD-GH for 0–90 min, after which, the cells were fixed with 4% PFA. After washing, the cell samples were detected with a laser scanning confocal microscope (Leica SP5). Data are presented as mean ± standard deviation (SD) from at least three independent experiments. Statistical analysis was performed using Prism 8.0.1 (GraphPad Software). P < 0.05 indicated a significant difference between means.
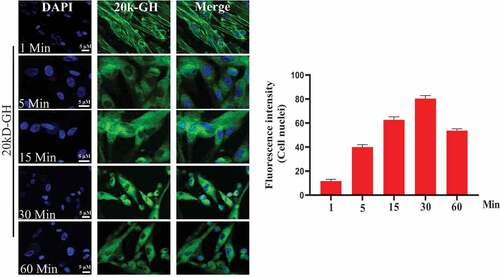
Figure 2. Continued.
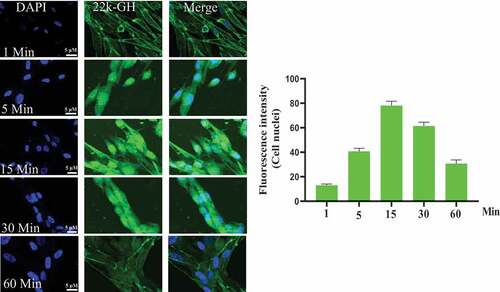
3.2 20 kD-GH and 22 kD-GH showed different cell behavior and property
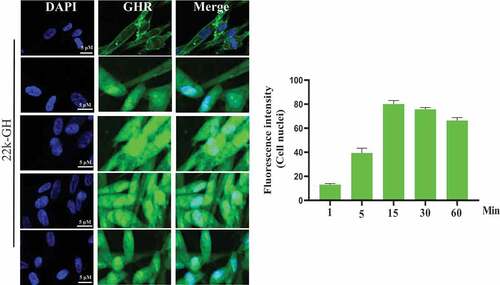
To explore cell behavior of 20 kD-GH and 22 kD-GH in the Bm-MSCs, the cells were stimulated with FITC-20 kD-GH for 0–90 min. indicates that, at 0 min, little or no fluorescence signal was detected in the Bm-MSCs; at 1 min, the some fluorescence signal could be detected in the cell membrane; at 1–15 min, 20 kD-GH was mainly localized in the cytoplasm of Bm-MSCs; at 15 ~ 60 min, the cytoplasm of Bm-MSCs exhibited a strong fluorescence signal; and at 90 min, the cytoplasmic fluorescence signal of 20 kD-GH began to decline slightly. Furthermore, the internalization kinetics of 22 kD-GH was also analyzed on Bm-MSCs cells, shows that, at 0 min, no fluorescence signal could be detected in the Bm-MSCs; at 1 min, the some fluorescence signal could be found mainly in the cell membrane of Bm-MSCs; at 1–15 min, 22 kD-GH transported into the cytoplasm and nuclei of Bm-MSCs; at 15 ~ 60 min, the cytoplasm and nuclei of Bm-MSCs showed a strong fluorescence signal; and at 90 min, the cytoplasmic and nuclear fluorescence signal began to decline slightly. Here, we find an important difference in the cellular characteristics between 22 kD-GH and 20 kD-GH, 22 kD-GH can be transported into the nucleus of Bm-MSCs, but 20 kD-GH cannot be transported into the nucleus. In addition, we also analyzed the internalization of GHR under 22 kD-GH and 20 kD-GH. The results showed that 20 kD-GH and 22 kD-GH could induce GHR internalization in a time-dependent manner, but GHR could be transported into cell nuclei of Bm-MSCs under 20 kD-GH stimulation ().
Figure 3. Detection of GHR by CLSM. Bm-MSCs were seeded on the slides. When cells reached 50–60% confluence. The cells were serum starved for 6 h, the cells were then stimulated with 20 kD-GH or 22 kD-GH for 0–90 min. After incubation, the cells were fixed using 4% PFA for 10 min at RT. After washing, the cells were permeabilized Triton-X 100 for 15 min. The cells were then blocked with 5% BSA for 2 h at 37°C. After three washes, anti-GHR antibody was added and incubated at 37°C for 2 h. After three washes, the secondary antibody was added and incubated for 1 h at 37°C. All images were acquired with a laser scanning confocal microscope (Leica SP5). Data are presented as mean ± standard deviation (SD). The fluorescence intensity of at least 50 cells has been counted. Statistical analysis was performed using Prism 8.0.1 (GraphPad Software). P < 0.05 indicated a significant difference between means.
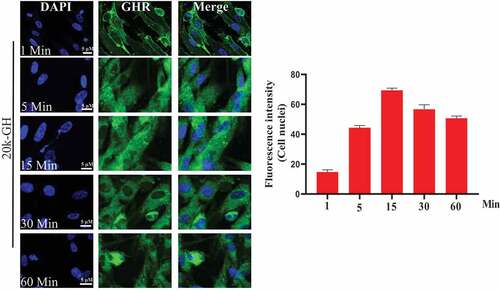
Figure 3. Continued.
3.3 22 kD-GH and 20 kD-GH exhibited different signaling profiles
Here, we compared the signal characteristics of 22 kD-GH and 20 kD-GH. Western blot analyses were conducted to explore the signaling properties between 20 kD-GH and 22 kD-GH. We first studied the signaling profile in dose-dependent experiments between 20 kD-GH and 22 kD-GH. The Bm-MSCs were treated with various concentrations of 20 kD-GH or 22 kD-GH (0–100 nm). The results showed that both 20 kD-GH and 22 kD-GH activated JAK2-STAT5/3 signaling pathway in a dose-dependent experiment. For 22 kD-GH (), it can be seen that 5 nM of 22 kD-GH activated the JAK2-STAT5/3 signaling pathway, and the activation levels of JAK2 and STAT/3/5 gradually enhanced when higher concentrations of 22 kD-GH was used (20–40 nM). The maximum phosphorylation level was found at 20–40 nM 22 kD-GH stimulation. After reaching the phosphorylation peak, JAK2-STAT5/3 phosphorylation levels began to decline (60 nM). For 20 kD-GH (), it can be seen that 5 nM of 20 kD-GH triggered the JAK2-STAT3/5 signaling pathway, and the phosphorylation levels of JAK2 and STAT/3/5 gradually increased when higher concentrations of 20 kD-GH was used (20–40 nM). The maximum phosphorylation levels was found at 20 nM 20 kD-GH stimulation. After reaching activation peak, JAK2-STAT3/5 phosphorylation levels began to decline. Although the 20 kD-GH exhibited a similar signaling profiles with that of 22 kD-GH, 22 kD-GH showed stronger signal ability compared with that of 20 kD-GH.
Figure 4. Dose response of JAK2/STATs phosphorylation induced by 22 kD-GH or 20 kD-GH. The cells were treatment with the indicated dosages of 20 kD-GH or 22 kD-GH for 30 min. The proteins form cell samples were then prepared, and subjected to SDS-PAGE, Western blot analyses were then performed as described as in the Materials and Methods section. Densitometry data for p-JAK2, and p-STATs were normalized to that of non-phosphorylated JAK2 and STAT5/3. Data are presented as mean ± standard deviation (SD). The asterisk indicates that the phosphorylation level is significantly different.
Next, JAK2-STAT5/3 signaling properties between 20 kD-GH and 22 kD-GH were explored in a time-dependent experiment using Western blotting. It is shown that both 20 kD-GH and 22 kD-GH exhibit signaling properties in a time-dependent manner. For 22 kD-GH, the JAK2 and STAT3/5 activation were detectable 5 min after 22 kD-GH stimulation (). The level of phosphorylation of JAK2-STATs gradually elevated with time increasing (30–60 min). JAK2-STAT3/5 phosphorylation levels reached the peak at 30–60 min. Subsequently, the phosphorylation levels of JAK2-STAT3/5 gradually declined. For 20 kD-GH, the JAK2 and STAT3/5 activation were detectable 5 min after 20 kD-GH treatment (). The level of phosphorylation level of JAK2-STATs gradually increased with time increasing (30–60 min). JAK2-STAT3/5 phosphorylation levels reached the maximum at 30–60 min. Subsequently, the phosphorylation levels of JAK2-STAT3/5 gradually declined. Although the 20 kD-GH exhibited a similar signaling profile with that of 22 kD-GH, 22 kD-GH showed stronger signal ability compared with that of 20 kD-GH.
Figure 5. Time-course of JAK2/STATs phosphorylation induced by 22 kD-GH or 20 kD-GH. The cells were treatment with 20 nM 20 kD-GH or 22 kD-GH for the indicated time points. The proteins form cell samples were then prepared, and subjected to SDS-PAGE, Western blot analyses were then performed as described as in the Materials and Methods section. Densitometry data for p-JAK2, and p-STATs were normalized to that of non-phosphorylated JAK2 and STAT5/3. Data are presented as mean ± standard deviation (SD). The asterisk indicates that the phosphorylation level is significantly different.
Figure 6. A analysis of cell proliferation by MTT. The cells were digested with trypsin (0.25%) to prepare a cell suspension. The cells were seeded into a 96-well cell culture plate at (1x10⁴/well), and each treatment was repeated three times. 20 kD-GH and 22 kD-GH were then added, respectively, and the cells continued to culture for 24–72 h, 20 μLof MTT solution was added to each well and incubated for 1 h. the OD value at a wavelength of 450 nm was measured using a microplate reader (OD-450). B. analysis of cell cycle by Flow cytometry. C. Detection of CyclinD1 and CDK4 and pRb by western-blot analyses as described as in the Materials and Methods section. D. Ki67 expression in 22 kD-GH group was increased than that of 20 kD GH. Data are presented as mean ± standard deviation (SD). The asterisk indicates that the phosphorylation level is significantly different.
Figure 6. Continued.
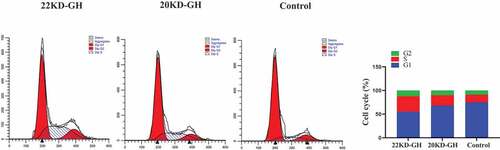
Figure 6. Continued.
Figure 6. Continued.
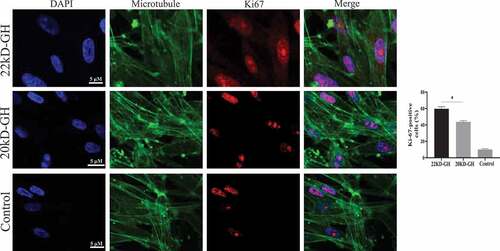
3.4 22 kD-GH showed higher ability in promoting MSCs proliferation than that of 20 kD-GH
Here, we further compare the ability of 20 kD-GH and 22 kD-GH to promote cell proliferation. MTT assays were performed as described in the metatarsals and methods section. As indicated in , 22k-GH showed a stronger ability in the promotion of cell proliferation compared with that of 20 kD-GH (24–48). Further flow analysis showed that the proportion of S phase in 20 kD-GH treatment group was less than that of the 22 kD-GH treatment group (). Furthermore, CyclinD1 and CDK4 expression level was higher than those of the 20 kD-GH group. Furthermore, the expression level of the phosphorylated retinoblastoma protein (Rb) was also higher than that of the control group (). Finally, the Ki67 expression was higher in 22 kD-GH group than that of 20 kD-GH group ().
3.5 22 kD-GH and 20 kD-GH showed different osteogenic differentiation potential
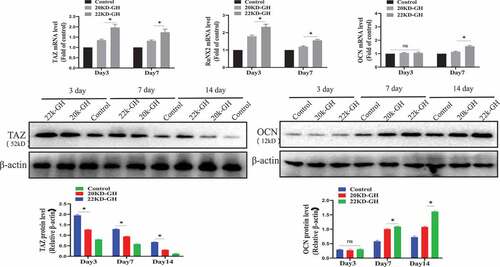
In addition to the function of GH to regulate the proliferation of MSCs, studies have reported that GH is involved in the osteogenic differentiation of MSCs. Here, we evaluated the ability of 20 kD-GH and 22 kD-GH to regulate osteogenic differentiation of BM-MSCs. For this, BM-BMSCs (3 × 10⁴ /cm2) were seeded into 24-well plates, and Osteogenic differentiation medium (StemPro ™ Osteogenic differentiation Kit, StemPro™, A1007201) was added (with 22 kD-GH or 20 kD-GH, respectively). Cells on day 3, day 7, and day 14 were tested for ALP activity. The results showed that 22 kD-GH significantly increased the activity of ALP, and 20 kD-GH showed weaker activity compared to 22 kD-GH (). Further experiments showed that 22 kD-GH up-regulated the mRNA of TAZ, RUNX2, and OCN Level by Real-time RT-PCR, but 20 kD-GH showed weak effects compared to 22 kD-GH. Similarly, at the protein level, 20 kD-GH and 22 kD-GH also showed similar results with that of mRNA experiments (). 22 kD-GH showed the ability to promote osteogenic differentiation, but 20 kD-GH showed a weak role for osteogenic differentiation of Bm-MSCs. These findings show that 22 kD-GH and 20 kD-GH exhibit different differentiation effects.
Figure 7. A. ALP activities of bm-MSCs in the osteogenic medium supplemented with 20 kD-GH or 22 kD-GH for 0–14 days. B. the relative TAZ, RUNX2 and OCN mRNA levels by RT-PCR expression.*P < 0.05 vs control. C. Western blot analysis for the relative protein levels of TAZ and OCN. Data are presented as mean ± standard deviation (SD). The asterisk indicates that the phosphorylation level is significantly different.
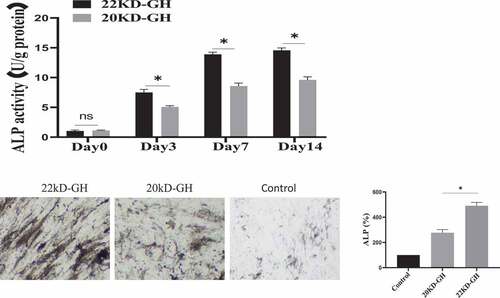
Figure 7. Continued.
Discussion
In the circulatory system, there are mainly two major subtypes of GH, one is 22 kD-GH, the other is 20 kD-GH [Citation14]. 22 kD-GH is the predominant form in the circulating system, 90% of GH is present as a 22 kD protein, and 10% of GH is present as a 20-kD protein [Citation1]. Amino acid sequences were identical between 20 kD-GH and 22 kD-GH protein, except that 20 kD-GH lacks 15 amino acid residues 32 to 46 [Citation14]. A series of studies have shown that GH has an important biological effect on MSCs [Citation10]. However, up to now, the cellular characteristics of the two types of GH have not been revealed in BM-MSCs. In addition, the biological activity of 20 kD-GH has not been explored in BM-MSCs. For this, we have carried out the current research: firstly, we studied the cell behavior of two types of GH in the Bm-MSCs model and found that the two types of GH showed the different biological characteristics; secondly, we investigated the biological characteristics of 20 kD-GH and 22 kD-GH, and results showed that 22 kD-GH and 20 kD-GH exhibit different signaling profiles; thirdly, we found that the 20 kD-GH and 22 kD-GH exhibit different regulatory effects on the differentiation of Bm-MSCs.
Previous studies have shown that GH has important regulatory effects on Bm-MSCs, such as regulating cell proliferation and cell differentiation [Citation10]. GH displays its biological activity is via GHR-mediated introcellular signaling molecules. In the current study, we explored the biological characteristics of 20 kD-GH and 22 kD-GH, and found that the two types of GH exhibited different cell behaviors. The biggest difference is that 22 kD-GH/GHR could transport into the nucleus of Bm-MSCs, but 20 kD-GH did not enter into the nucleus of Bm-MSCs. The nuclear localization of GH/GHR has important biological activities [Citation15,Citation16]. First, in our previous research, we found that nuclear-localized GHR is closely related to the proliferation of MSCs (submitted to journal). However, the specific action mechanism of GHR is still not clear enough. The nuclear localization of GH/GHR has been reported in different types of cells [Citation15]. Lan et al. revealed the basic path of GHR’s nuclear localization [Citation13]. They found that GHR is endocytosed into the cytoplasm under clathrin mediation, then enters into the endoplasmic reticulum (ER) under the mediation of EEA1 endosome, and then GHR enters into the cytoplasm again through the ERAD pathway, and finally, GHR is transported into the nucleus with the participation of importinα/β. However, in the current research, we found an interesting phenomenon that both 20 kD-GH and 22 kD-GH could internalize into the cytoplasm, but why GHR under 20 kD-GH induction cannot enter into the nucleus is still an important scientific question, which may be related to the confrontational changes of GHR induced by GH. It is possible that the confrontational change(s) of GHR induced by 22 kD-GH is suitable for the binding of GHR to importinα/β, 20 kD-GH cannot do this. Of course, this is just a speculation, further experiments are needed to demonstrate this speculation. Ligands play an extremely important role in the process of nuclear localization of GHR. Lobie et al. found that G120R, a growth hormone antagonist, can internalize into the cell cytoplasm, but it cannot induce the nuclear localization of GHR [Citation17]. In addition, Lan et al. reported that the pegvisomant (which is also a PEG-modified GHR antagonist) also cannot induce GHR to enter into the cell nuclei [Citation18]. G120R and Pegviosmant are inactive molecules, because they cannot activate GHR, but it is interesting that 20 kD-GH is an active molecule because it can activate GHRs in BM-MSCs, we ask why 20 KGH/GHR cannot transport to the nucleus? And only 22 kD-GH can induce GHR transport into cell nuclei, which is a question worthy of in-depth research in the future.
Previous studies have shown that 20 kD-GH and 22 kD-GH exhibit similar but not completely identical biological activities [Citation19,Citation20]. In addition, Hong et al. found that different species of GH exhibit different biological characteristics in the same cell model [Citation21]. In the current study, we also found that 22 kD-GH and 20 kD-GH exhibited different signaling profiles. This is also an interesting finding. The difference in signal characteristics between 22 kD-GH and 20 kD-GH may also be an important factor for why the two types of GH exhibit different biological activities. The current findings also indicate that 20 kD-GH and 22 kD-GH have different biological regulatory effects on Bm-MSCs, the two types of GH exhibit different ability to promote the cell proliferation of Bm-MSCs.
It has been reported that GH is involved in the osteogenic differentiation of MSCs [Citation12], therefore we compared the ability of 20 kD-GH and 22 kD-GH to participate in the osteogenic differentiation of MSCs. We found that 20 kD-GH showed lower ability to promote osteogenic differentiation compared to 22 kD-GH. Although the current research shows that 20 kD-GH exhibits weak biological activity compared with 22 kD-GH, this does not mean that 20 kD-GH has no potential application value, because previous studies have shown that 20 kD-GH exhibits different biological activities compared to GH [Citation19–21].
In the current study, we completed the current study using commercial stem cells. It is difficult to control the quality of BM-MSC, which was derived from different donors (the quality of cells may be inconsistent in the different batches); therefore, the heterogeneity of BM-MSC may potentially affect conclusion in MSC study. To avoid variations in the different batches, vulnerability of stem cell aging [Citation22], MSCs derived from pluripotent stem cells may be as an alternative source [Citation23–25]. It has been reported that the pluripotent stem cells show high potency in proliferation, immunomodulatory properties, and multi differentiation potential [Citation26,Citation27]. Most recently, GMP-grade MSCs derived from hiPSCs have been used in refractory graft-versus-host-disease (GVHD) in clinical trials Citation28.
In short, the current study found that 20 kD-GH and 22 kD-GH exhibit different cell behavior characteristics and signaling profiles, which lays the foundation for further studying the relationship between GH and Bm-MSCs.
Acknowledgments
This work was supported by Peking University Shenzhen Hospital.
Disclosure statement
The authors declare that they have no financial conflicts of interest.
Additional information
Funding
References
- Cooke NE, Ray J, Watson MA, et al. Human growth hormone gene and the highly homologous growth hormone variant gene display different splicing patterns. J Clin Invest. 1988;82(1):270–275.
- Argetsinger LS, Carter-Su C. Growth hormone signalling mechanisms: involvement of the tyrosine kinase JAK2. Hormone Res Paediatrics. 1996;45(Suppl. 1):22–24.
- Rowlinson SW, Yoshizato H, Barclay JL, et al. An agonist-induced conformational change in the growth hormone receptor determines the choice of signalling pathway. Nat Cell Biol. 2008;10(6):740–747.
- Zhao C, Ikeya M. Generation and applications of induced pluripotent stem cell-derived mesenchymal stem cells. Stem Cells Int. 2018;2018:1–8.
- Luzzani CD, Miriuka SG. Pluripotent stem cells as a robust source of mesenchymal stem cells. Stem Cell Rev Rep. 2017;13(1):68–78.
- Pontikoglou C, Deschaseaux F, Sensebé L, et al. Bone marrow mesenchymal stem cells: biological properties and their role in hematopoiesis and hematopoietic stem cell transplantation. Stem Cell Rev Rep. 2011;7(3):569–589.
- Kastrinaki M-C, Sidiropoulos P, Roche S, et al. Functional, molecular and proteomic characterisation of bone marrow mesenchymal stem cells in rheumatoid arthritis. Ann Rheum Dis. 2008;67(6):741–749.
- Alcayaga-Miranda F, Cuenca J, Luz-Crawford P, et al. Characterization of menstrual stem cells: angiogenic effect, migration and hematopoietic stem cell support in comparison with bone marrow mesenchymal stem cells. Stem Cell Res Ther. 2015;6(1):1–14.
- Ponte AL, Marais E, Gallay N, et al. The in vitro migration capacity of human bone marrow mesenchymal stem cells: comparison of chemokine and growth factor chemotactic activities. Stem Cells. 2007;25(7):1737–1745.
- Bolamperti B, Guidobono G, Rubinacci R, et al. The role of growth hormone in mesenchymal stem cell commitment. Int J Mol Sci. 2019;20(21):5264.
- Bolamperti S, Signo M, Spinello A, et al. GH prevents adipogenic differentiation of mesenchymal stromal stem cells derived from human trabecular bone via canonical Wnt signaling. Bone. 2018;112:136–144.
- Huang E, Zhu G, Jiang W, et al. Growth hormone synergizes with BMP9 in osteogenic differentiation by activating the JAK/STAT/IGF1 pathway in murine multilineage cells. Journal of Bone and Mineral Research. 2012;27(7):1566–1575.
- Hainan L, Huilin L, Khan MA, et al. The basic route of the nuclear translocation porcine growth hormone (GH)-growth hormone receptor (GHR) complex (pGH/GHR) in porcine hepatocytes. Gen Comp Endocrinol. 2018;266:101–109.
- Hai-Nan L, Hui-Lin L, Zi-Qi Z, et al. Cellular internalization and trafficking of 20 KDa human growth hormone. Gen Comp Endocrinol. 2019;270:82–89.
- Lan HN, Hong P, Li RN, et al. Growth hormone-specific induction of the nuclear localization of porcine growth hormone receptor in porcine hepatocytes. Domest Anim Endocrinol. 2017;61:39–47.
- Conway-Campbell BL, Wooh JW, Brooks AJ, et al. Nuclear targeting of the growth hormone receptor results in dysregulation of cell proliferation and tumorigenesis.Proc. Proceedings of the National Academy of Sciences. 2007;104(33):13331–13336.
- Graichen R, Sandstedt J, Goh ELK, et al. The growth hormone-binding protein is a location-dependent cytokine receptor transcriptional enhancer. J Biol Chem. 2003;278(8):6346–6354.
- Lan H, Li W, Li R, et al. Endocytosis and degradation of Pegvisomant and a potential new mechanism that inhibits the nuclear translocation of GHR. J Clin Endocrinol Metab. 2019;104(6):1887–1899.
- Yao-Xia L, Jing-Yan C, Xia-Lian T, et al. The 20 kDa and 22 kDa forms of human growth hormone (hGH) exhibit different intracellular signalling profiles and properties. Gen Comp Endocrinol. 2017;248:49–54.
- Wu Z, Devany E, Balarini G, et al. Specific monoclonal antibodies and ultrasensitive immunoassays for 20K and 22K human growth hormone. Growth Hormone IGF Res. 2010;20(3):239–244.
- Hong P, Lan H, Li Y, et al. Different intracellular signalling properties induced by human and porcine growth hormone. Gen Comp Endocrinol. 2016;229:67–73.
- Zhang L, Li J, Tian D, et al. Theranostic combinatorial drug-loaded coated cubosomes for enhanced targeting and efficacy against cancer cells. Cell Death Dis. 2020;11(1):1–15.
- Lian Q, Chow Y, Esteban M, et al. Future perspective of induced pluripotent stem cells for diagnosis, drug screening and treatment of human diseases. Thrombosis Haemostasis. 2010;104(7):39–44.
- Lian Q, Zhang Y, Zhang J. Functional mesenchymal stem cells derived from human induced pluripotent stem cells attenuate limb ischemia in mice. Circulation. 2010;121(9):1113–1123.
- Lian Q, Zhang Y, Liang X, et al. Directed differentiation of human-induced pluripotent stem cells to mesenchymal stem cells. Methods Mol Biol. 2016;1416:289.
- Zhang J, Chan Y, Ho J, et al. Regulation of cell proliferation of human induced pluripotent stem cell-derived mesenchymal stem cells via ether-à-go-go 1 (heag1) potassium channel. Am J Physiol Cell Physiol. 2012;303(2):C115.
- Sun S-J, Lai W-H, Jiang Y, et al. Immunomodulation by systemic administration of human-induced pluripotent stem cell-derived mesenchymal stromal cells to enhance the therapeutic efficacy of cell-based therapy for treatment of myocardial infarction. Theranostics. 2021;11(4):1641.
- Bloor A, Patel A, and Griffin JEet al, Production, safety and efficacy of ipsc-derived mesenchymal stromal cells in acute steroid-resistant graft versus host disease: a phase i, multicenter, open-label, dose-escalation study. Nature medicine. 2020;26(11), 1720–1725.