
ABSTRACT
Obesity is associated with elevated levels of free fatty acids (FFAs). Excessive saturated fatty acids (SFAs) exhibit significant deleterious cytotoxic effects in many types of cells. However, the effects of palmitic acid (PA), the most common circulating SFA, on cell cycle progression in neuronal cells have not been well-examined. The aim of this study was to examine whether PA affects the proliferation and cell cycle progression in mouse neuroblastoma Neuro-2a (N2a) cells. Our studies found that 200 µM PA significantly decreased DNA synthesis and mitotic index in N2a cells as early as 4 h following treatment. 24 h treatment with 200 µM PA significantly decreased the percentage of diploid (2 N) cells while dramatically increasing the percentage of tetraploid (4 N) cells as compared to the BSA control. Moreover, our studies found that 24 h treatment with 200 µM PA increased the percentage of binucleate cells as compared to the BSA control. Our studies also found that unsaturated fatty acids (UFAs), including linoleic acid, oleic acid, α-linolenic acid, and docosahexaenoic acid, were able to abolish PA-induced decrease of 2 N cells, increase of 4 N cells, and accumulation of binucleate cells. Taken together, these results suggest that PA may affect multiple aspects of the cell cycle progression in N2a cells, including decreased DNA synthesis, G2/M arrest, and cytokinetic failure, which could be abolished by UFAs.
Abbreviations: 4-PBA, 4-Phenylbutyric Acid; ALA, α-linolenic acid; BrdU, 5-bromo-2’-deoxyuridine; DAPI, 4′,6-diamidino-2-phenylindole; ER, endoplasmic reticulum; FFA, free fatty acids; FITC, fluorescein isothiocyanate; LA, linoleic acid; MTT, 3-(4,5-dimethylthiazol-2-yl)-2,5-diphenyltetrazolium bromide; N2a, Neuro-2a; NAC, N-acetyl cysteine; OA, oleic acid; PA, palmitic acid; pHH3, Phosphorylation of histone H3; PI, propidium iodide; SFA, saturated fatty acids; PUFA, polyunsaturated fatty acids; TUNEL, terminal deoxynucleotidyl transferase dUTP nick end labeling; UFA, unsaturated fatty acids
Introduction
The obesity pandemic is an increasingly prevalent global health issue. According to the World Health Organization, more than 1.9 billion adults were overweight worldwide in 2016, and more than 650 million of those were obese [Citation1]. In the United States, 71.6% of adults aged 20 and over were overweight, including 39.8% being obese (2015–2016) [Citation2]. Significant evidence associates obesity with a constellation of metabolic syndrome pathologies including insulin resistance and diabetes [Citation3], chronic inflammation [Citation4], nonalcoholic fatty liver disease [Citation5], and cardiovascular diseases [Citation6]. Chronic dyslipidemia is commonly observed in obese patients [Citation7] and elevated levels of free fatty acids (FFAs) are believed to be a causal element of several obesogenic pathologies [Citation8–10].
Normal human blood plasma contains over 30 species of FFAs which vary in their acyl chain length and the degree and location of unsaturation in the acyl chain [Citation11]. On average, saturated fatty acids (SFAs) represent ~44% and unsaturated fatty acids (UFAs) represent ~56% of plasma FFAs [Citation12]. Principal among these are the SFA palmitic acid (PA, C16:0), monounsaturated fatty acid oleic acid (OA, C18:1 ω-9), and polyunsaturated fatty acid (PUFA) linoleic acid (LA, C18:2 ω-6), which together represent nearly two-thirds of normal human plasma lipid content (approximately 28%, 32%, and 13%, respectively) [Citation12]. Other notable PUFAs include omega-3 fatty acids such as α-linolenic acid (ALA, C18:3 ω-3) and docosahexaenoic acid (DHA, C22:6 ω-3), which are recognized for their important roles in the brain where they represent one-fifth of the brain’s dry weight [Citation13].
Excessive SFAs generally induce cellular dysfunction and lipotoxicity in a plurality of non-adipose tissues, For example, PA has been shown to induce lipotoxicity in many types of cells including pancreatic β-cells [Citation14], human umbilical vein endothelial cells [Citation15], PC12 and rat cortical cells [Citation16]. However, UFAs are often antagonistic of PA-induced deleterious effects. For example, PA-induced apoptosis of pancreatic β-cells could be blocked by OA [Citation14], and PA-induced inflammation in microglial cells and insulin resistance in skeletal myocytes is abrogated by LA [Citation17] and DHA [Citation18], respectively.
As the most lipid-rich non-adipose organ in the body, the brain is highly enriched with fatty acids [Citation19] with about 50% of its dry mass owing to lipid content [Citation20]. Altered brain lipid composition has been observed in obese mice [Citation21] and mice fed a high fat diet [Citation22]. The concentration of PA in the plasma [Citation23,Citation24] and cerebrospinal fluid [Citation25] as well as the uptake and accumulation of PA [Citation26] are increased in obese humans. Obesity-associated lipid alterations have a significant impact in the brain where lipids are highly active biological molecules participating in a cornucopia of functions including brain development [Citation27], cell signaling [Citation28], regulation of systemic metabolism [Citation29], and behavior [Citation30]. The effects of PA on the cell cycle progression in neuronal cells remain to be defined. Therefore, this study was designed to examine the effects of PA on the proliferation and cell cycle progression in Neuro-2a (N2a) cells.
Materials and methods
Cell culture
Murine Neuro-2a (N2a) neuroblastoma cells were purchased from American Type Culture Collection (ATCC; Manassas, VA, USA), cultured in Eagle’s minimum essential media (EMEM) (Lonza; Walkersville, MD, USA) supplemented with 10% (v/v) fetal bovine serum (FBS) (Invitrogen; Carlsbad, CA, USA) and 1% (v/v) penicillin–streptomycin (Sigma-Aldrich; St. Louis, MO, USA), and maintained in a humidified environment with 5% CO2 at 37°C. All experiments were performed in cells with fewer than 20 passages.
Preparation of fatty acids
Fatty acids and fatty acid (FA)-free, low endotoxin bovine serum albumin (BSA) were purchased from Sigma-Aldrich (St. Louis, MO, USA). First, each of the FAs was dissolved in 100% ethanol at 400 mM, and BSA was dissolved in serum-free EMEM at 13.5% (v/v). To conjugate FA to BSA, 400 mM FA was added to 13.5% BSA with a molar ratio of 1:2.5 (FA:BSA) to prepare a 5 mM FA stock solution [Citation31]. The resulting solution was sonicated, nutated for 3 h at RT, filtered through 0.22 μm filter, aliquoted, and stored at −80°C.
BrdU incorporation assay
Cell proliferation was measured by quantifying the incorporation of 5-bromo-2’-deoxyuridine (BrdU) during DNA synthesis according to manufacturer’s instructions (Roche; Indianapolis, IN, USA). Briefly, cells were seeded in 96-well plates at 1.0 × 10⁴ cells/well. After overnight incubation, cells were treated with FAs or BSA control in serum-free media for different periods of time. At 2 h prior to the completion of treatment, BrdU was added to the wells to a final concentration of 10 μM. After incubation for another 2 h, cells were fixed, incubated with anti-BrdU-peroxidase, and washed. Substrate was then added to each well. After sufficient color development, 25 µl of 1 M H2SO4 was added to stop the reaction, and absorbance of the samples was measured at 450 nm on the VarioSkan Lux microplate reader (ThermoFisher Scientific; Waltham, MA, USA).
Cell cycle analysis using DAPI by flow cytometry
Cells were seeded in 12-well plates at 1.0 × 10⁵ cells/well. After overnight incubation, cells were treated with FAs or BSA control in serum-free media for 24 h. At the end of treatment, cells were collected by trypsinization and washed with D-PBS prior to fixation with 70% ethanol on ice for at least 1 h. Ethanol-fixed cells were then centrifuged, washed, resuspended in D-PBS, and incubated with 1 μg/ml 4',6-diamidino-2-phenylindole (DAPI) staining solution for 30 m in the dark on ice. Cellular DNA content was determined by flow cytometric quantitation of DAPI fluorescence. Flow cytometry events were gated and data were analyzed using FlowJo10 (BD Biosciences; Ashland, OR, USA).
Immunofluorescence staining
Cells were seeded into 12-well plates at 1.0 × 10⁵ cells/well. Following overnight incubation, cells were treated with 200 μM PA or BSA in serum-free media for 0, 2, 4, 6, or 8 h. After treatment, cells were rinsed with PBS, fixed in 4% paraformaldehyde for 20 m, and then permeabilized in 0.2% Triton-X100 in PBS for 20 m at RT. After being blocked in SuperBlock (ThermoFisher; Waltham, MA, USA) for 15 m, cells were incubated with anti-phospho-Histone H3 (pHH3) mouse monoclonal antibody at 1:200 dilution (Cell Signaling Technology; Danvers, MA, USA) at 4°C overnight. After washing with PBS, cells were incubated with goat anti-mouse IgG antibody conjugated to Cy5 at 1:500 dilution (ThermoFisher) for 2 h at RT, washed with PBS, and stained with 1 μg/mL DAPI. Cells were then visualized on the FluoView FV1000 confocal microscopy (Olympus; Center Valley, PA, USA).
Counting cells in microscopic images
For mitotic index, the number of DAPI-stained cells in each image was counted as the total number of cells, and the number of pHH3-immunopositive cells was counted as the total number of mitotic cells. The mitotic index was then calculated by dividing the number of pHH3-positive cells by the total number of DAPI stained cells and expressed as the percentage of pHH3-stained nuclei. The percentage of binucleate cells was calculated by diving the number of binucleate cells by the total number of DAPI stained cells. Each experiment was repeated three times, each treatment had three replicates, three images from different fields were captured for each replicate, and three different researchers counted the number of pHH3-positive cells, DAPI-stained cells, and binucleate cells in each image.
Statistical analysis
Data were analyzed using GraphPad Prism 6 (GraphPad Software; San Diego, CA, USA) and presented as mean ± SEM. For BrdU incorporation, cell cycle analysis of PA-treated cells, and binucleate cell analysis, one-way ANOVA with Turkey’s multiple comparisons test was used to determine statistical significance of the quantitated data. For time-dependent effects of PA on mitotic index and cell cycle profile and effects of UFAs on PA-induced cell cycle defects, two-way ANOVA with Turkey’s multiple comparisons test was used to determine statistical significance of the quantitated data.
Results
PA treatment reduced proliferation of N2a cells
To determine the effects of PA on cell proliferation, N2a cells were treated with 25, 50, 100, or 200 µM PA or BSA control in serum-free media for 24 h, and their proliferation was examined using bromodeoxyuridine (BrdU) incorporation assay. Incorporation of BrdU was significantly decreased in N2a cells following treatment with 25 µM PA for 24 h. As the concentration of PA increased, the incorporation of BrdU continued to decrease (), and diminished to a minimal level in N2a cells treated with 200 µM PA for 24 h (). N2a cells were also treated with 200 µM PA for 2, 4, 6, 8, 10, 12, or 24 h, and their proliferation was examined using BrdU incorporation assay. The incorporation of BrdU was significantly decreased by 4 h following treatment with 200 µM PA, and continued to decrease at 6, 8, 10, 12, and 24 h of PA treatment ().
Figure 1. Concentration- (a) and time-dependent (b) effects of PA on BrdU incorporation in N2a cells. a. N2a cells were treated with different concentrations of PA for 24 h (A) or with 200 µM PA for different periods of time (b) in serum free media with 10 µM BrdU added during the last 2 h of treatment, and BrdU incorporation was assayed. The values presented were representative of three independent experiments with triplicate measurements (mean ± SEM). * p < 0.05 vs. control, ** p < 0.01 vs. control; *** p < 0.001 vs. control.
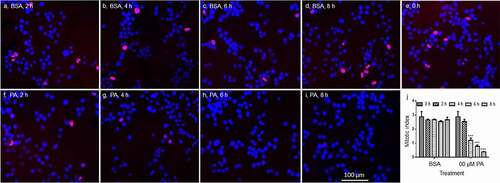
The mitotic index of N2a cells following treatment with PA was then determined by immunostaining of phospho-Histone H3 (pHH3) in N2a cells treated with BSA or 200 µM PA for 2, 4, 6, or 8 h. The mitotic index, the percentage of pHH3 positive cells, did not change significantly between 0 and 8 h in BSA-treated control cells. The mitotic index of cells treated with 200 µM PA for 2 h was not significantly different from control cells, but started to decrease significantly at 4 h following PA treatment, and continued to decrease at 6 h and 8 h following PA treatment ().
Figure 2. Phosphorylation of histone H3 (pHH3) in N2a cells following treatment with BSA or 200 µM PA for different periods of time. A-H. Representative overlay confocal microscopy images of N2a cells immunostained with anti-pHH3 and detected with Cy5-conjugated secondary antibody (red) and DAPI (blue) following treatment with BSA or 200 μM PA for 0, 2, 4, 6, or 8 h. J. Quantification of mitotic index, percentage of cells stained positive for pHH3. Images and values presented are representative of three independent experiments (mean ± SEM). *** p < 0.001 vs. control.
PA treatment decreased the percentage of 2 N cells and induced accumulation of 4 N cells
The effects of PA treatment on cell cycle progression in N2a cells were then examined. Cells were treated with 25, 50, 100, or 200 μM PA or BSA control in serum-free media for 24 h and stained with DAPI. Cellular DNA content was then determined by flow cytometric quantitation of DAPI fluorescence. In BSA-treated control cells, about 45–65% of cells were 2 N and about 18–23% cells were 4 N. After treatment with 25 µM PA for 24 h, the percentage of diploid (2 N) cells started to decrease and the percentage of tetraploid (4 N) cells started to increase. The percentage of 2 N cells significantly decreased to 25–45% in cells following 24 h treatment with 50 µM PA and continued to decrease to 18–26% and 8–24% following 24 h treatment with 100 µM and 200 µM PA, respectively. In contrast, the percentage of 4 N cells significantly increased to 45–60% following 24 h treatment with 50 µM PA and continued to increase to 63–71% and 71–80% following 24 h treatment with 100 µM and 200 µM PA, respectively ().
Figure 3. Cell cycle analysis of N2a cells following treatment with different concentrations of PA for 24 h (a-b) and 200 µM PA for different periods of time (c-e) using flow cytometry. A-B. N2a cells were treated with 0, 25, 50, 100, or 200 µM PA for 24 h, stained with DAPI, and then analyzed by flow cytometry with representative flow cytometry histograms shown in A, and percentage of 2 N and 4 N cells shown in B. C-E. N2a cells were treated with 200 µM PA or BSA for 1, 2, 4, 6, 8, 12, or 24 h, stained with DAPI, and then analyzed by flow cytometry with representative flow cytometry histograms shown in C, percentage of 2 N cells shown in D, and percentage of 4 N cells shown in E. Values presented were representative of three independent experiments (mean ± SEM). * p < 0.05 vs. corresponding control; ** p < 0.01 vs. corresponding control; *** p < 0.001 vs. corresponding control.
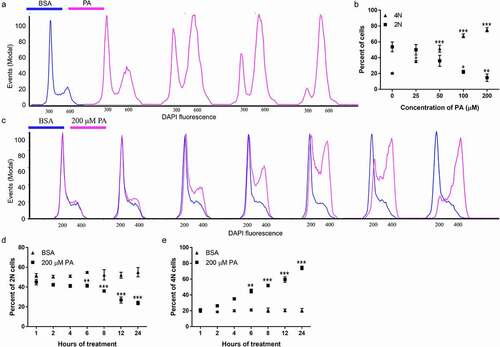
The time-dependent effects of PA treatment on cell cycle progression in N2a cells were also examined. Cells were treated with 200 μM PA or BSA control in serum-free media for 1, 2, 4, 6, 8, 12, and 24 h and their cell cycle profiles were examined by DAPI staining and flow cytometry analysis. The percentage of 2 N and 4 N cells did not change significantly overtime in BSA-treated cells. PA-treated cells started to exhibit significant decrease of 2 N cells and increase of 4 N cells by 6 h following PA treatment. As the time of PA treatment increased to 8, 12, and 24 h, the percentage of 2 N cells continued to decrease and the percentage of 4 N cells continued to increase ().
PA treatment induced cytokinetic failure in N2a cells
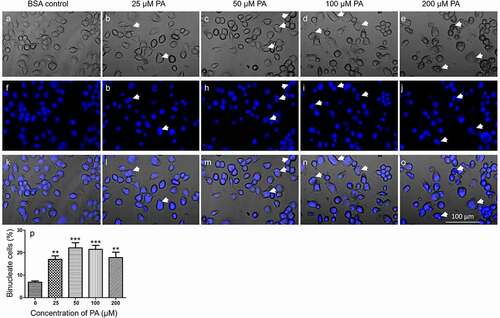
N2a cells were then treated with 25, 50, 100, or 200 µM PA or BSA control in serum-free media for 24 h, fixed, stained with DAPI, and examined under confocal microscopy. In the BSA-treated control, the basal level of binucleate cells was at 5–8%. 24 h treatment of 25 µM PA significantly increased the percentage of binucleate cells to 13–22%. 24 h treatment with 50 µM, 100 µM, or 200 µM PA increased the percentage of binucleate cells to 17–26%, 18–27%, 15–27%, respectively ().
Figure 4. PA-induced accumulation of binucleate cells. N2a cells were fixed, stained with DAPI, and imaged under confocal microscope in bright-field and DAPI channels following treatment with different concentrations of PA in serum-free media for 24 h. A-O. Representative confocal microscopy images of N2a cells treated with BSA control (A, F, K), 25 μM (B, G, L), 50 μM (C, H, M), 100 μM (D, I, N), and 200 μM (E, J, O) PA with A-E representing the brightfield images, F-J representing the DAPI stained images, and K-O representing the brightfield/DAPI overlay images. Representative binucleate cells were marked by white arrows. P. Percentage of binucleate cells after treatment with different concentrations of PA for 24 h. Values presented were representative of three independent experiments (mean ± SEM). ** p < 0.01 vs. control; *** p < 0.001 vs. control.
UFAs rescued PA-induced blockade of cell cycle progression
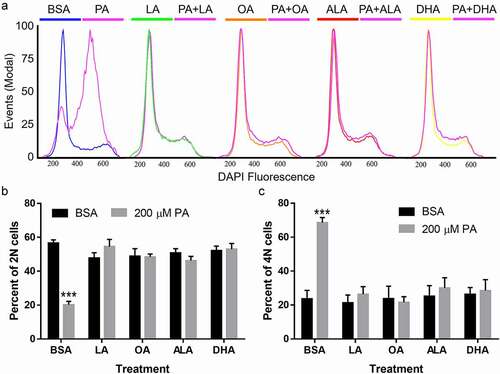
N2a cells were co-incubated with 200 μM LA, OA, ALA, or DHA together with 200 μM PA or BSA in serum-free media for 24 h, and cell cycle progression was determined by flow cytometry. In contrast to PA, each UFA alone, namely LA, OA, ALA, or DHA, did not significantly affect cell cycle progression or the percentage of 2 N and 4 N cells as compared to BSA control (). Moreover, co-treatment with LA, OA, ALA, and DHA completely abolished PA-induced decrease of 2 N cells and the concomitant increase of 4 N cells (). PA-induced defects in N2a cell cycle profile were completely restored by all the UFAs tested.
Figure 5. Cell cycle analysis of N2a cells following treatment with PA with or without UFAs. N2a cells were treated with 200 µM of LA, OA, ALA, DHA together with BSA or 200 µM PA for 24 h, stained with DAPI, and then analyzed by flow cytometry. A. Representative flow cytometry histograms of N2a cells following treatment with PA with or without UFAs and staining with DAPI. B. The percentage of 2 N cells following treatment with PA with or without UFAs. C. The percentage of 4 N cells following treatment with PA with or without UFAs. Values presented were representative of three independent experiments (mean ± SEM). *** p < 0.001 vs. BSA control.
UFAs abolished PA-induced accumulation of binucleate cells
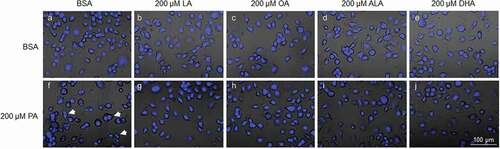
N2a cells were also stained with DAPI and observed under confocal microscope following treatment with 200 µM LA, OA, ALA, or DHA together with 200 µM PA or BSA for 24 h. In contrast to PA, none of the UFAs tested significantly induced any accumulation of binucleate cells as compared to BSA control. Moreover, co-treatment with LA, OA, ALA, and DHA completely abolished PA-induced accumulation of binucleate cells ().
Figure 6. UFAs abolished PA-induced accumulation of binucleate cells. N2a cells were fixed, stained with DAPI, and imaged under confocal microscope following treatment with BSA or 200 µM PA together with different UFAs for 24 h. A-J. Representative overlay confocal microscopy images of cells treated with BSA (a-e) or 200 µM PA (f-j) together with 200 µM LA (b, g), OA (c, h), ALA (d, i), or DHA (e, j) in serum-free media for 24 h. Representative binucleate cells were marked by white arrows.
Discussion
The goal of this study was to examine how PA affected the cell cycle progression in N2a cells. PA has been shown to induce lipotoxic cell death in many types of cells including hepatocytes [Citation32], astrocytes [Citation33], and endothelial cells [Citation15]. Our studies found that PA treatment significantly decreased the proliferation of N2a cells as measured by BrdU incorporation and mitotic index; induced G2/M arrest with significant decrease of 2 N cells and increase of 4 N cells; and cytokinetic failure with significant accumulation of binucleate cells.
There have not been many studies examining the effects of PA on cell proliferation. Wang et al. reported that PA inhibits the proliferation of neural stem cells with reduced BrdU incorporation [Citation34]. Palmitic acid methyl ester also significantly reduces BrdU incorporation in human bone marrow-derived mesenchymal cells [Citation35]. 4-day exposure to PA has also been shown to decrease β-cell proliferation in human islets as shown by anti-Ki-67 immunostaining [Citation36]. It has been suggested that PA-induced oxidative stress may contribute to the decrease in neural stem cell proliferation [Citation34], and that PA-induced formation of ceramide may contribute to the decrease in β-cell proliferation [Citation36]. It is worthwhile to examine whether oxidative stress and formation of ceramide contribute to PA-induced decrease in N2a proliferation. Furthermore, AKT plays an important role in cell proliferation [Citation37], and its activity is regulated by PA [Citation38]. Therefore, it would be interesting to examine the role of AKT in PA-induced cell proliferation defects in N2a cells.
There have been very few reports regarding the effects of PA on cell cycle progression. Hsiao et al. have reported that PA induces G2/M arrest in SH-SY5Y neuroblastoma cells based on their flow cytometry analysis [Citation39]. Lin et al. have also stated that palmitic acid methyl ester (PAME) causes cell cycle arrest at G2/M in human bone marrow-derived mesenchymal cells using flow cytometric analysis [Citation35]. Our flow cytometric analysis showed that N2a cells treated with PA exhibited dose-dependent G2/M arrest by decreasing the percentage of 2 N cells and increasing the percentage of 4 N cells. Moreover, our studies found that PA induced accumulation of binucleate cells. Moreover, the percentage of 4 N cells was significantly higher than the percentage of binucleate cells following PA treatment. For example, 24 h treatment with 200 µM PA induced the increase of 4 N cells to 71–80% and the accumulation of binucleate cells to 15–27%, which suggests that PA may induce G2/M arrest as well as cytokinetic failure.
UFAs have been reported to prevent PA-induced cell death in skeletal muscle cells [Citation40], and ALA reduces PA-induced cell death in renal cells [Citation41]. Our studies showed that PA-induced cell cycle defects and accumulation of binucleate cells were abolished by all UFAs tested, including LA, OA, ALA, and DHA regardless of chain length, the degree of unsaturation, or the location of unsaturation. Consistently, inhibition of stearoyl-CoA desaturase 1 (SCD1), which catalyzes the transformation of SFAs into MUFAs (e.g. oleic acid), leads to induction of apoptosis and cell cycle arrest in breast cancer cells, which is reversed by exogenous OA [Citation42]. Cheon et al. reported that AA diverts PA into inert triglycerides, and reduced its availability to intracellular target molecules, thereby protecting C2C12 cells from PA-induced lipotoxicity [Citation43]
Taken together, our study characterized how PA affected cell proliferation and cell cycle progression in N2a cells. Our studies showed that PA treatment affected multiple aspects of cell cycle progression in N2a cells: decreased DNA synthesis, G2/M arrest, and cytokinetic failure. All the UFAs tested, including LA, OA, ALA, and DHA, abolished PA-defects in cell cycle progression regardless of its chain length or the degree and location of acyl unsaturation. Our findings may provide key insights into PA-induced neurotoxicity.
Data availability
All data are contained within the manuscript.
Acknowledgments
The authors would like to thank Katherine Liu and Paige Murray for their assistance in counting the cells in confocal microscopy images.
Disclosure statement
No potential conflict of interest was reported by the author(s).
Additional information
Funding
References
- WHO. Obesity and overweight. 2020. [cited 2020 Nov 5]. 2020 April 1, 2020. Available from: https://www.who.int/en/news-room/fact-sheets/detail/obesity-and-overweight
- Statistics, N. C. f. H. Obesity and overweight. cited 2020 Nov 5. 2020. Available from: https://www.cdc.gov/nchs/fastats/obesity-overweight.htm
- Polsky S, Ellis SL. Obesity, insulin resistance, and type 1 diabetes mellitus. Curr Opin Endocrinol Diabetes Obes. 2015;22(4):277–282. Epub 2015/ 06/19.
- Karczewski J, Sledzinska E, Baturo A, et al. Obesity and inflammation. Eur Cytokine Netw. 2018;29(3):83–94. Epub 2018/ 12/15.
- Corey KE, Kaplan LM. Obesity and liver disease: the epidemic of the twenty-first century. Clin Liver Dis. 2014;18(1):1–18. Epub 2013/ 11/28.
- Ortega FB, Lavie CJ, Blair SN. Obesity and cardiovascular disease. Circ Res. 2016;118(11):1752–1770. Epub 2016/ 05/28.
- Feingold KR. Obesity and Dyslipidemia. Endotext [Internet] cited 2020 Nov 2. 2020.https://www.ncbi.nlm.nih.gov/books/NBK305895
- Cascio G, Schiera G, Di Liegro I. Dietary fatty acids in metabolic syndrome, diabetes and cardiovascular diseases. Curr Diabetes Rev. 2012;8(1):2–17. Epub 2012/ 03/15.
- Sears B, Perry M. The role of fatty acids in insulin resistance. Lipids Health Dis. 2015;14(1):121. Epub 2015/ 09/30.
- Zhou H, Urso CJ, Jadeja V. Saturated fatty acids in obesity-associated inflammation. J Inflamm Res. 2020;13:1–14. Epub 2020/ 02/06.
- Quehenberger O, Armando AM, Brown AH, et al. Lipidomics reveals a remarkable diversity of lipids in human plasma. J Lipid Res. 2010;51(11):3299–3305. Epub 2010/ 07/31.
- Staiger H, Staiger K, Stefan N, et al. Palmitate-induced interleukin-6 expression in human coronary artery endothelial cells. Diabetes. 2004;53(12):3209–3216. Epub 2004/ 11/25.
- Dyall SC. Long-chain omega-3 fatty acids and the brain: a review of the independent and shared effects of EPA, DPA and DHA. Front Aging Neurosci. 2015;7:52. Epub 2015/ 05/09.
- Sommerweiss D, Gorski T, Richter S, et al. Oleate rescues INS-1E beta-cells from palmitate-induced apoptosis by preventing activation of the unfolded protein response. Biochem Biophys Res Commun. 2013;441(4):770–776. Epub 2013/ 11/06.
- Novinbahador T, Nourazarian A, Asgharzadeh M, et al. Docosahexaenoic acid attenuates the detrimental effect of palmitic acid on human endothelial cells by modulating genes from the atherosclerosis signaling pathway. J Cell Biochem. 2018;119(12):9752–9763. Epub 2018/ 08/22.
- Almaguel FG, Liu JW, Pacheco FJ, et al. Activation and reversal of lipotoxicity in PC12 and rat cortical cells following exposure to palmitic acid. J Neurosci Res. 2009;87(5):1207–1218. Epub 2008/ 10/28.
- Tu TH, Kim H, Yang S, et al. Linoleic acid rescues microglia inflammation triggered by saturated fatty acid. Biochem Biophys Res Commun. 2019;513(1):201–206. Epub 2019/ 04/07.
- Capel F, Acquaviva C, Pitois E, et al. DHA at nutritional doses restores insulin sensitivity in skeletal muscle by preventing lipotoxicity and inflammation. J Nutr Biochem. 2015;26(9):949–959. Epub 2015/ 05/27.
- O’Brien JS, Sampson EL. Lipid composition of the normal human brain: gray matter, white matter, and myelin. J Lipid Res. 1965;6(4):537–544. Epub 1965/ 10/01.
- Morell P. T. A. D. Biochemistry of lipids. HW M, editor. Amsterdam: Elservier; 1996.
- Sena A, Rebel G, Bieth R, et al. Lipid composition in liver and brain of genetically obese (ob/ob), heterozygote (ob/+)and normal (+/+) mice. Biochim Biophys Acta. 1982;710(3):290–296. Epub 1982/ 03/12.
- Pakiet A, Jakubiak A, Czumaj A, et al. The effect of western diet on mice brain lipid composition. Nutr Metab (Lond). 2019;16(1):81. Epub 2019/ 12/04.
- Arner P, Ryden M. Fatty acids, obesity and insulin resistance. Obes Facts. 2015;8(2):147–155. Epub 2015/ 04/22.
- Karpe F, Dickmann JR, Frayn KN. Fatty acids, obesity, and insulin resistance: time for a reevaluation. Diabetes. 2011;60(10):2441–2449. Epub 2011/ 09/29.
- Melo HM, da Silva S, Sant’Ana GDS, et al. Is increased in the cerebrospinal fluid of humans with obesity and induces memory impairment in mice via pro-inflammatory TNF-alpha. Cell Rep. 2020;30(7):2180–94e8. Epub 2020/ 02/23.
- Karmi A, Iozzo P, Viljanen A, et al. Increased brain fatty acid uptake in metabolic syndrome. Diabetes. 2010;59(9):2171–2177. Epub 2010/ 06/23.
- Echeverria F, Valenzuela R, Catalina Hernandez-Rodas M, et al. Docosahexaenoic acid (DHA), a fundamental fatty acid for the brain: new dietary sources. Prostaglandins Leukot Essent Fatty Acids. 2017;124:1–10. Epub 2017/ 09/06.
- Bazan NG. Lipid signaling in neural plasticity, brain repair, and neuroprotection. Mol Neurobiol. 2005;32(1):89–103. Epub 2005/ 08/04.
- Bruce KD, Zsombok A, Eckel RH. lipid processing in the brain: a key regulator of systemic metabolism. Front Endocrinol (Lausanne). 2017;8:60. Epub 2017/ 04/20.
- Schuchardt JP, Huss M, Stauss-Grabo M, et al. Significance of long-chain polyunsaturated fatty acids (PUFAs) for the development and behaviour of children. Eur J Pediatr. 2010;169(2):149–164. Epub 2009/ 08/13.
- Choi SJ, Kim F, Schwartz MW, et al. Cultured hypothalamic neurons are resistant to inflammation and insulin resistance induced by saturated fatty acids. Am J Physiol Endocrinol Metab. 2010;298(6):E1122–30. Epub 2010/ 04/01.
- Zhang Y, Miao L, Zhang H, et al. Chlorogenic acid against palmitic acid in endoplasmic reticulum stress-mediated apoptosis resulting in protective effect of primary rat hepatocytes. Lipids Health Dis. 2018;17(1):270. Epub 2018/ 11/30.
- Wong KL, Wu YR, Cheng KS, et al. Palmitic acid-induced lipotoxicity and protection by (+)-catechin in rat cortical astrocytes. Pharmacol Rep. 2014;66(6):1106–1113. Epub 2014/ 12/03.
- Wang Z, Liu D, Zhang Q, et al. Palmitic acid affects proliferation and differentiation of neural stem cells in vitro. J Neurosci Res. 2014;92(5):574–586. Epub 2014/ 01/22.
- Lin JH, Ting PC, Lee WS, et al. Palmitic Acid Methyl Ester induces G2/M arrest in human bone marrow-derived mesenchymal stem cells via the p53/p21 pathway. Stem Cells Int. 2019;2019:7606238. Epub 2019/ 12/31.
- Maedler K, Oberholzer J, Bucher P, et al. Monounsaturated fatty acids prevent the deleterious effects of palmitate and high glucose on human pancreatic beta-cell turnover and function. Diabetes. 2003;52(3):726–733. Epub 2003/ 02/28.
- Xu N, Lao Y, Zhang Y, et al. Akt: a double-edged sword in cell proliferation and genome stability. J Oncol. 2012;2012:951724. Epub 2012/ 04/07.
- Calvo-Ochoa E, Sanchez-Alegria K, Gomez-Inclan C, et al. Palmitic acid stimulates energy metabolism and inhibits insulin/PI3K/AKT signaling in differentiated human neuroblastoma cells: the role of mTOR activation and mitochondrial ROS production. Neurochem Int. 2017;110:75–83. Epub 2017/ 09/19.
- Hsiao YH, Lin CI, Liao H, et al. Palmitic acid-induced neuron cell cycle G2/M arrest and endoplasmic reticular stress through protein palmitoylation in SH-SY5Y human neuroblastoma cells. Int J Mol Sci. 2014;15(11):20876–20899. Epub 2014/ 11/18.
- Tumova J, Malisova L, Andel M, et al. Protective effect of unsaturated fatty acids on palmitic acid-induced toxicity in skeletal muscle cells is not mediated by PPARdelta activation. Lipids. 2015;50(10):955–964. Epub 2015/ 08/10.
- Katsoulieris E, Mabley JG, Samai M, et al. alpha-Linolenic acid protects renal cells against palmitic acid lipotoxicity via inhibition of endoplasmic reticulum stress. Eur J Pharmacol. 2009;623(1–3):107–112. Epub 2009/ 09/22.
- Zhao J, Zhi Z, Wang C, et al. Exogenous lipids promote the growth of breast cancer cells via CD36. Oncol Rep. 2017;38(4):2105–2115. Epub 2017/ 08/03.
- Cheon HG, Cho YS. Protection of palmitic acid-mediated lipotoxicity by arachidonic acid via channeling of palmitic acid into triglycerides in C2C12. J Biomed Sci. 2014;21(1):13. Epub 2014/ 02/14.