
ABSTRACT
Polar body emission is a special form of cytokinesis in oocyte meiosis that ensures the correct number of chromosomes in reproduction-competent eggs. The molecular mechanism of the last step, polar body abscission, is poorly understood. While it has been proposed that Ca2+ signaling plays important roles in embryonic cytokinesis, to date transient increases in intracellular free Ca2+ have been difficult to document in oocyte meiosis except for the global Ca2+ wave induced by sperm at fertilization. Here, we find that microinjection of the calcium chelator dibromo-BAPTA inhibits polar body abscission in Xenopus laevis oocytes. Using a novel, microtubule-targeted ratio-metric calcium sensor, we detected a calcium transient that is focused at the contractile ring-associated plasma membrane and which occurred after anaphase and constriction of the contractile ring but prior to abscission. This calcium transient was confirmed by mobile calcium probes. Further, the Ca2+-sensitive protein kinase Cβ C2 domain transiently translocated to the contractile ring-associated membrane simultaneously with the calcium transient. Collectively, these results demonstrate that a calcium transient, apparently originating at the contractile ring-associated plasma membrane, promotes polar body abscission.
Introduction
In animal cells, cytokinesis begins with the formation of an actomyosin based-contractile ring tethered to the plasma membrane. The contractile ring constricts, pulling the associated plasma membrane inward to eventually form the intercellular bridge, a thin cell process connecting the two nascent daughter cells. Cytokinesis ends with abscission, the severing of the intercellular bridge. In the middle of the intercellular bridge is the midbody, a bundle of tightly packed microtubules associated with a variety of abscission regulators [Citation1]. In human mitotic cells, it is currently thought that abscission is accomplished by secondary ingression that is not powered by the contractile ring. Rather, secondary ingression is thought to be catalyzed by the assembly and contraction of filaments built from the ESCRT-III (endosomal sorting complex required for transport-III) complex [Citation2,Citation3]. The midbody-localized ESCRT-III also provides the platform (via its CHMP1B subunit) to recruit microtubule severing protein spastin in an apparent coordination between this secondary constriction and midbody microtubule severing [Citation4]. Other members of the ESCRT-III complex may serve to receive positive and negative signals for abscission execution (below).
Mitotic abscission is controlled by the NoCut abscission checkpoint, which senses midbody defects (e.g. presence of lagging chromosomes) and delays abscission until the defects are resolved [Citation5]. Midbody-associated Aurora B plays a critical role in abscission checkpoint [Citation6], by phosphorylating many abscission regulators including the mitotic kinesin-like protein 1 (Mklp1) to prevent furrow regression [Citation7] and ESCRT-III’s CHMP4C subunit, to delay abscission [Citation8,Citation9]. The function of Aurora B in preventing furrow regression is conserved in oocyte meiosis, at least in worms [Citation10] and ascidians [Citation11].
On the other hand, phosphatidylinositol-3 kinase (PI3K) pathway appears to promote cytokinesis abscission though CHMP4B. A centrosomal protein complex of the PI3P binding protein FYVE-CENT and its partner TTC19 are translocated to the midbody by the kinesin KIF13A where TTC19 binds CHMP4B to effect abscission [Citation12]. Interestingly, a recent study reported that depletion of Beclin-1, a component of class III PI3K, and chemical inhibition of PI3K inhibit polar body abscission in mouse oocytes [Citation13].
In addition to the ESCRT-III constriction machinery and accessory proteins, Rab GTPase-mediated membrane vesicle trafficking and SNAREs (soluble N-ethylmaleimide sensitive factor attachment protein receptor)-mediated vesicle-plasma membrane fusion play critical roles in abscission [Citation14,Citation15]. Membrane fusion in other systems is inhibited by intracellular calcium chelation, suggesting the potential involvement of transient, local elevation of intracellular free calcium [Citation16]. However, whether calcium transient has a direct role in mitotic abscission is unknown.
Relative to mitosis, abscission during vertebrate oocyte meiosis is very poorly understood [Citation17]. That is, while the highly asymmetric divisions which produce the two polar bodies begin in a manner that resembles mitotic cytokinesis, with formation and closure of a Rho-dependent actomyosin ring [Citation18], far less is known about abscission, in spite of the fact that failed abscission in oocyte meiosis results in production of eggs with supernumerary chromosomes, a condition that results in infertility [Citation19]. Indeed, we currently lack such basic information as the timing of polar body abscission in mice or Xenopus, partly because a severed polar body remains trapped between the egg and the overlaying vitelline membranes so the status of abscission cannot be easily determined [Citation20].
In this study, we have examined the timing of polar body abscission during Xenopus oocyte meiosis, based on the ability of fluorescent dextran to enter the polar body when deposited in the oocyte. Guided by the timing of abscission, we have discovered a short-lived but robust calcium transient that occurs after cytokinetic apparatus ingression but before polar body abscission. Further, we have determined that the calcium transient is focused at the plasma membrane in the approximate center of the intercellular bridge. Finally, we demonstrate that intracellular calcium buffering following anaphase inhibited polar body abscission.
Results
Progesterone treatment triggers meiotic maturation in Xenopus oocytes with the time to germinal vesicle breakdown (), GVBD, time = 0 min) being relatively variable, but with the time from GVBD to the later steps of meiosis being more consistent [Citation18,Citation20]. Within 30 minutes of GVBD, a nascent meiosis I spindle with condensed chromosomes can be seen at the cortex in the animal pole. Approximately 120 minutes after GVBD, oocytes abruptly initiate anaphase with half the chromosome homologs being pulled into the protruding polar body enclosure () time = 120 min). Fifteen (15) minutes after anaphase initiation, the first polar body is fully protruded, and the contractile ring appears fully constricted [Citation18,Citation21]. Within 30 minutes of anaphase-I initiation, the metaphase II spindle forms and associates stably with the cortex, typically near the first polar body. It is unknown when first polar body abscission occurs since it is trapped between the plasma membrane and the overlaying vitelline membrane [Citation20]. To develop an assay for first polar body abscission, we exploited the fact that impalement of metaphase II oocytes triggers artificial completion of meiosis such that second polar body is emitted as the metaphase arrest is relieved. Specifically, we microinjected fluorescent dextran into the oocytes, thereby introducing a fluorescent marker of cytoplasmic continuity into the oocytes while simultaneously triggering emission of the second polar body ()). Because the dextran is present at the time the second polar body is formed, the second polar body will inevitably be labeled by it. For the first polar body, however, dextran will only be contained within it if its cytoplasm was continuous with that of the oocyte at the time of the injection, that is, if abscission had not yet occurred. Thus, if both polar bodies contain dextran, first polar body abscission had not yet occurred; if only one of the polar bodies contains dextran, first polar body abscission had occurred. Preliminary experiments using the dextran microinjection assay indicated that most oocytes had completed first polar body abscission within 3 hours following GVBD (not shown).
Figure 1. Buffering intracellular calcium in Xenopus oocytes inhibited polar body abscission.(a) Timeline of oocyte maturation and polar body abscission assay. Details described in the text. Chromosomes in green and dextran in red. The haploid chromosomes in activated eggs (far right) are typically too deep in the cytoplasm to be imaged. pb1: first polar body; pb2: second polar body. (b) Representative images depicting abscission assays of eGFP-H2B expressing oocytes injected with fluorescent dextran at the indicated time (minutes; above the images) from anaphase initiation. Dextran fluorescence ratio of the first polar body (1st) over the second polar body (2nd) is indicated below the images. Whereas first polar bodies always contained chromatin mass, individual chromosomes were often visible in second polar bodies. (c) Summary (means ± SD) of dextran fluorescence ratio of oocytes injected with dextran at the indicated time from anaphase initiation. P values represent One-way ANOVA and Tukey’s HSD test results. A horizontal line with two vertical ticks at the ends indicate comparison between the two end time points while a horizontal line covers all time points as indicated. Also indicated are the percentage of oocytes in each time point that had completed abscission. (d) Dextran fluorescence ratio (1st polar body/2nd polar body or metaphase II spindle; means ± SD) of oocytes injected with water (control) or DB-BAPTA 5 min after anaphase initiation. P = 1.2E-08 by t-test (two-tailed). The graph shows a DB-BAPTA-injected oocyte, depicting 1st polar body containing dextran and metaphase II chromosomes scattered at the cortex.
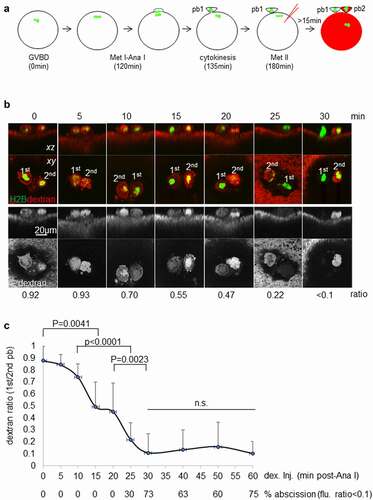
Figure 1. (Continued).

To more precisely determine the timing of polar body abscission, we carried out dextran microinjection experiments at various time points following anaphase initiation, based on chromosome separation [Citation18] ()). To assess abscission quantitatively, we measured the ratio of dextran fluorescence of first polar body over that of the second polar body as an indicator of dextran permeability. Under our experimental conditions, a fluorescence ratio of less than 0.1 reflected background autofluorescence in the first polar body, as compared to oocytes not injected with fluorescence dextran. Based on this criterion, none of the oocytes (0/47) had completed abscission when dextran injection was performed 20 minutes or less after anaphase initiation ()). Three oocytes out of 10 (30%) had completed abscission at 25 minutes after anaphase initiation. In contrast, 73% (11/15) had completed abscission at 30 minutes after anaphase initiation. Similar proportions of oocytes had completed abscission when examined 40 to 60 minutes after anaphase initiation ()). Overall, 28/41 (68%) of the oocytes examined at 30 minutes or longer after anaphase initiation had completed abscission. The relatively large error bars, especially at 30 minutes or later, reflected the significant proportions of the oocytes that failed abscission. These results suggest that first polar body abscission occurred between 25 and 30 minutes after anaphase initiation.
To determine whether polar body abscission is regulated by Ca2+ signaling, we injected dibromo-BAPTA (DB-BAPTA) or water (as a control) into the oocytes 5 minutes after anaphase initiation (indicated by chromosome separation) [Citation22], and then subjected eggs to the polar body abscission assay. Water-injected oocytes exhibited dextran fluorescence ratio indicative of normal abscission. In contrast, DB-BAPTA-injected oocytes clearly failed polar body abscission ()). In addition, DB-BAPTA-injected oocytes failed to form a second polar body, but instead exhibited metaphase II chromosomes scattered at the cortex ()), as result of DB-BAPTA disrupting metaphase II spindles, consistent with previous results [Citation22].
With the exception of the fertilization-induced calcium increase [Citation23], transient increases in Ca2+ during meiotic maturation in oocytes have proven elusive [Citation22,Citation24–26]. It has been speculated that this is due to shortcomings in the spatial or temporal resolution of the imaging regimes previously employed, an argument which seems plausible, particularly in the Xenopus system, where the oocyte is ~1 mm diameter and given the fact that meiotic maturation occurs over the course of several hours (see above). The remodeling and compartmentalization of the plasma membrane and cortex that accompany meiotic maturation in general and polar body emission in particular further complicate matters, in that the amount of yolk-free cytoplasm available for soluble calcium probes changes dramatically over space and time. Our previous attempts [Citation22], using untagged GCaMP3 and membrane-anchored Lck-GCaMP3, have failed to detect any calcium transients during polar body formation, although we had mainly focused on spindle assembly and metaphase to anaphase initiation. GCaMP3 exhibits brighter fluorescence signal at the spindle, likely reflecting enrichment of the probe in the yolk-free spindle region. Lck-GCaMP3, on the other hand, exhibits bright fluorescence around the neck of the forming polar body. However, as the calcium-insensitive Lck-mCherry exhibits similarly increasing fluorescence, the increase of Lck-GCaMP3 fluorescence appears to reflect increase of membrane accumulation at the polar body neck [Citation22]. To overcome these issues, we imaged the animal pole at high spatiotemporal resolution using a novel, ratio-metric probe for microtubule-proximal free calcium – TubeCaMP3 ()). TubeCaMP3 comprises the microtubule binding domain of ensconsin (EMTB; [Citation27]) flanked by an N-terminal mCherry and a C-terminal fluorescent calcium sensor, GCaMP3 [Citation28]. EMTB has been used successfully to image microtubules in Xenopus oocytes [Citation20] and embryos [Citation29], while GCaMP3 has been employed to monitor calcium in a wide variety of cell types [Citation28], including Xenopus oocytes [Citation30]. The rationale for this probe is simple: by comparing the ratio of fluorescent signal from mCherry to that of the GCaMP3, a measure of microtubule-proximal intracellular free calcium is obtained. This is particularly useful for imaging intracellular free calcium in the regions of spindles, which are relatively rich in cytoplasm (and thus, more conventional cytoplasmic calcium probes) due to their tendency to exclude yolk platelets [Citation31].
Figure 2. A local calcium transient during polar body emission detected by TubeCaMP3.
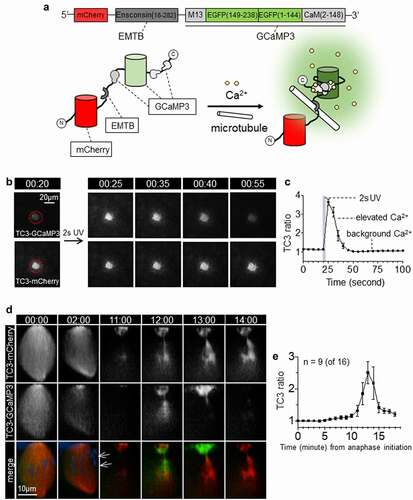
To test whether TubeCaMP3 reports on microtubule-proximal increases in intracellular free calcium, oocytes expressing TubeCaMP3 were injected with caged-inositol trisphosphate (IP3) [Citation32], treated with progesterone to induce meiotic maturation, and then subjected to UV photolysis at the meiotic spindle. Following UV exposure, TubeCaMP3ʹs GCaMP3 fluorescence signal increased in response to IP3 release while its mCherry fluorescence signal remained unchanged (), time in minute:second). Hence the change of relative fluorescence of TubeCaMP3 (GCaMP3/mCherry ratio) at the spindle region reflects the fluctuation of microtubule proximal Ca2+ ()).
To detect possible calcium transients during polar body emission, we carried out live imaging of Xenopus oocytes expressing TubeCaMP3 and labeled with Hoechst dye (to monitor chromosome dynamics). Imaging began at the onset of anaphase and continued for at least 20 minutes. Remarkably, in 9/16 oocytes, an abrupt and transient increase in GCaMP3 fluorescence was detected that coincided with the intercellular bridge and the regions flanking it, on both the polar body and the oocyte side (), 12:00; The complete series of this and another oocyte are depicted in supplementary Fig. S1). This calcium transient commenced within ~12 minutes of anaphase onset and, a minute later, calcium signal spread to the polar body but was lost from the oocyte side (), 13:00). Then, just as abruptly, intracellular free calcium returned to resting levels (), 14:00). In the rest of the oocytes (7/16), we detected no increase of GCaMP3 fluorescence, even when imaging was extended to 60 minutes after anaphase onset.
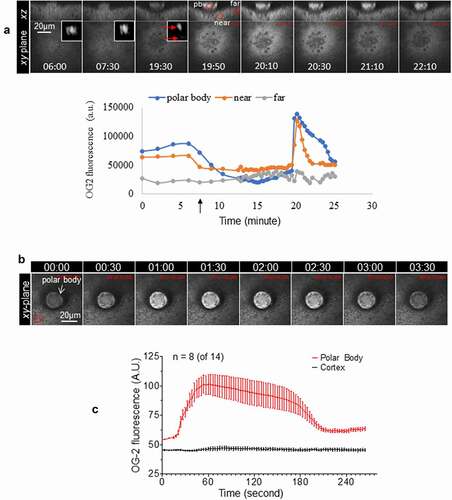
The results obtained with TubeCaMP3 indicated the existence of a highly focal calcium transient associated with the intercellular bridge that forms prior to abscission of the first polar body. To obtain independent confirmation of this result, we employed two different chemical Ca2+ indicators, Oregon GreenTM 488 BAPTA-2 (OG-2; Kd for Ca2+ ~580 nM) and Oregon GreenTM 488 BAPTA-6 f (OG-6 f; Kd for Ca2+ ~3 µM) [Citation33]. Oocytes injected with OG-2 exhibited a sudden rise of calcium ~12 minutes after the onset of anaphase (), 19:50; the graph depicts quantification of the entire series, which is available in supplementary Fig. S2). Elevated calcium was seen in the protruded polar body and the oocyte cortex immediately adjacent to the polar body (, “near”) but not oocyte cortex further away from the polar body (), “far”). Furthermore, whereas the increased OG-2 signal in the oocyte (‘near”) faded within a minute or so, elevated OG-2 signal in the polar body lasted 2–3 minutes ()). Consistent with the results obtained using TubeCaMP3, we found that in 8/14 (OG-2) ()) or 10/15 (OG-6 f) (Supplementary Fig. S3) this polar body associated calcium elevation could be detected. These results were obtained by imaging a single plane, at 3 sec intervals, encompassing both the polar body and a region of the oocyte cortex corresponding to “far” in ) (circle in ), 00:00). These data () clearly showed that a single calcium transient occurred and it was restricted to the immediate vicinity of the forming polar body, unlike the global calcium transient at fertilization [Citation23].
Figure 3. The local calcium transient detected by Oregon GreenTM 488 BAPTA-2.
While the chemical dyes permit rapid imaging of intracellular increases in calcium, they produce diffuse signal, making it difficult to discern any potential localized pattern of calcium increase. We therefore imaged fluorescent versions of the C2 domain of protein kinase Cβ (PKC-β-C2). The C2 domain binds to phosphatidylserine (PS) in the presence of elevated calcium [Citation34] and, because PS is most abundant in the plasma membrane, fusions of the C2 domain with fluorescent proteins have been used to monitor plasma membrane and calcium dynamics in processes ranging from exocytosis [Citation35] to cell [Citation30] and tissue [Citation36] repair. As above, oocytes expressing eGFP-PKCβ-C2 and H2B-mRFP were subjected to time-lapse confocal imaging close to metaphase-to-anaphase transition. Consistent with the results obtained with TubeCaMP3 and the chemical calcium dyes, eGFP-PKCβ-C2 (or mRFP-PKCβ-C2) was transiently recruited, in 17/24 oocytes (71%), to what appeared to be the polar body neck ~12 minutes after anaphase onset (); The complete series of this oocyte is depicted in supplementary Fig. S4). Furthermore, the eGFP-PKCβ-C2 revealed an additional feature of the calcium transient not detected by the other probes: concentration at the approximate middle of the intercellular bridge. To more precisely identify the site of eGFP-PKCβ-C2 concentration, we compared its distribution to that of a plasma membrane marker Lck-mCherry [Citation22]. This revealed that C2 was indeed concentrated at the plasma membrane in the narrow neck separating the oocyte from the forming polar body ()). As expected, injection of DB-BAPTA but not water 5 minutes after anaphase initiation, abolished the C2 recruitment to the polar body neck (); p = 0.019).
Figure 4. PKCβ-C2 distribution during the Ca2+ transient.
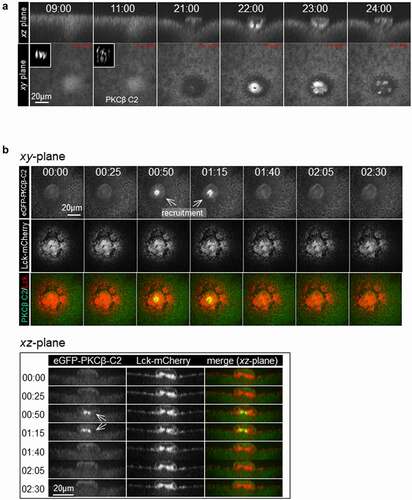
Figure 4. (Continued).
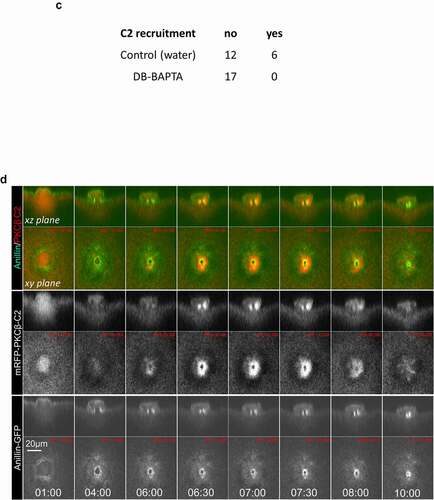
The concentration of C2 at the neck separating the nascent polar body from the oocyte, combined with the results obtained with TubeCaMP3 and OG-2 (and OG-6 f), suggest that calcium may be focally elevated in a narrow ring of plasma membrane closely apposed to the contractile ring. To test this, we compared the spatiotemporal dynamics of C2 to anillin, a protein that serves as a link to the plasma membrane and the contractile ring [Citation37] in both mitotic [Citation38] and meiotic cytokinesis [Citation39]. Comparison of the localization pattern of C2 to anillin showed that the C2 concentrated in the region where anillin was most abundant, as expected if calcium is focally elevated at the plasma membrane overlying the contractile ring ()). A second finding emerged from this analysis: C2 was not recruited to the plasma membrane of the neck until after closure of the contractile ring had essentially stopped, as expected if the calcium is primarily involved in regulation of the late stages of cytokinesis.
Discussion
In this study we have demonstrated a calcium transient in Xenopus oocytes that is spatiotemporally correlated with polar body abscission, the final step in polar body emission. The calcium transient occurred at ~12 minutes after anaphase initiation and at a point when the contractile ring had fully constricted, but before abscission which occurs 25–30 minutes after anaphase initiation (). Two lines of evidence indicate that this calcium transient is essential for abscission: first, the proportion of oocytes that undergo abscission (68%) roughly parallels the proportion that display the calcium transient (~60%; TubeCaMP3, OG-2 and OG6f) or PKCβ-C2 recruitment (71%); second, and more tellingly, microinjection of DB-BAPTA before the anticipated time of abscission prevents abscission. We were unable to determine directly if the oocytes showing calcium transient were the same oocytes that completed abscission. The experiment would involve confocal imaging of live oocytes for anaphase initiation (chromosome segregation) followed by time lapse calcium imaging, after which the oocyte needs to be transferred to a nearby apparatus for fluorescent dextran injection before transfer back for imaging fluorescence dextran. Oocytes become very fragile, especially after calcium imaging since it requires relatively high laser intensity and short intervals (therefore many timepoints) to capture the brief “burst”, and easily damaged during transfers. Furthermore, our lab is equipped with an aged MRC 1024 confocal system capable of imaging only two fluorophores, green and red fluorescence, making it impossible to do this experiment which would require three fluorophores: a chromosome probe, a calcium probe, and fluorescent dextran.
Where does the calcium come from? Based on the results obtained with the various probes, the transient itself is focused on the plasma membrane overlaying the contractile ring. That is, the GCaMP3/mCherry ratio of TubeCaMP3 increased on both sides of the contractile ring (restricted point of the spindle in ), 12:00) with signal gradients consistent with the calcium origin being at the level of the plasma membrane. Moreover, the mobile calcium probe OG-2 detected simultaneous elevation of calcium in the polar body and the oocyte cortex immediately adjacent to the polar body (within ~30 µm radius). The rapid rise and sharp decline of calcium at oocyte cortex near the polar body (, “near”) and the equally rapid rise but slower decline of calcium in the polar body are consistent with a common calcium source (i.e. at the polar body neck). The asymmetric dissipation of free calcium, fast on the oocyte side and slower in the polar body, likely reflects the huge difference in cytoplasmic volumes, hence calcium diffusion rate/buffer capacity, between the two (125,000:1, based on diameters of 20 µm and 1 mm for polar body and oocyte respectively). Finally, and most importantly, the calcium sensitive C2 probe, the only one of the probes that can directly report on plasma membrane-associated calcium increase, was transiently recruited to the region of the intercellular bridge where the plasma membrane is closely apposed to the contractile ring. That this probe is reporting on the same calcium transient detected by the other probes is indicated by the similar timing of and duration of its recruitment.
It is unknown what triggers the highly restricted calcium transients detected here. Parry et al., have reported microdomain, inositol 1, 4, 5-trisphosphate (IP3)-mediated calcium transients associated with each mitotic spindle in syncytial Drosophila embryos [Citation40,Citation41]. The close contact between spindles and the endoplasmic reticulum (ER) has been noted in many cell types [Citation40,Citation42,Citation43] and in Xenopus oocytes (our unpublished data). It is therefore plausible that the spindle may be involved in triggering local calcium transients. We speculate that these calcium transients are dependent on the unique interaction between the spindle apparatus and the oocyte cortex/plasma membranes. For examples, the spindle including the segregating chromosomes may be associated with a non-membrane phospholipase C (PLC), hydrolyzing phosphatidylinositol trisphosphate (PIP3) releasing IP3, hence calcium transients, locally. Such non-membrane PLC has been reported to be associated with yeast kinetochores [Citation44] and in mammalian sperms [Citation45].
What might be the function of the calcium transient? The timing of the calcium transient, ~12 minutes after anaphase initiation when the contractile ring had fully constricted, suggests that it is unrelated to spindle assembly [Citation22] or contractile ring constriction [Citation46]. In contrast, the timing and localization of the transient are consistent with a role during abscission, as is the demonstration that abscission is blocked by DB-BAPTA injection. We therefore suggest that the calcium transient either plays a critical role in a process leading to abscission or in the abscission event itself. Previous results indicate that the spindle midbody forms approximately 14–16 minutes after anaphase initiation [Citation18], within the window of BAPTA sensitivity shown in this study. Given that the midbody is essential for abscission during mitosis, and given the localization of the calcium transient, it is plausible that the target of the calcium increase is a component(s) of the midbody. In this regard, it has been reported that in HeLa cells calcineurin, a calcium- and calmodulin-dependent protein phosphatase, accumulates at the midbody. Inhibition of calcineurin or calcium chelation blocks cytokinesis abscission [Citation47]. Another attractive (and nonexclusive) possibility is the ESCRT machinery. Specifically, it has been reported that experimental elevation of calcium promotes the recruitment of ALG2 and ESCRTIII to the plasma membrane [Citation48]. Finally, abscission entails membrane-membrane fusion events [Citation49] which in other contexts are triggered by intracellular calcium increases [Citation16].
Method
Xenopus oocyte preparation
Sexually mature Xenopus laevis females were obtained from Nasco (Fort Atkinson, Wisconsin). The animals were housed in the animal care center of University of Ottawa, Faculty of Medicine. The experimental protocol involving the use of these animals has been approved by the Animal Care Committee of University of Ottawa (OHRI-2092). The females were primed with 50 units of pregnant mare gonadotropin (Sigma-Aldrich, P0130) 3–10 days prior to sacrifice. Stage VI oocytes were manually defolliculated with fine forceps in oocyte culture medium (OCM, 480 mL Leibovitz’s L-15 medium, 320 mL sterile water, 0.32 g bovine serum albumin, 0.5 mg/mL gentamycin, pH 7.6–7.8) and kept at 18°C until use [Citation50]. Only stage VI oocytes with uniform coloration were chosen for the experiments, and randomly allocated among experimental groups since they are morphologically indistinguishable. For each experiment reported here, at least three independent repeats were performed each with a separate donor female.
Time-lapse confocal fluorescence imaging
To induce maturation, oocytes were incubated in OCM plus 1 μM progesterone in room temperature. Oocytes were monitored, every 10 minutes, for the appearance of a white “maturation spot” on the animal hemisphere, indicative of germinal vesicle breakdown (or GVBD). GVBD oocytes were transferred to fresh OCM. Anaphase I initiation commences approximately 120 min following GVBD [Citation21]. Oocytes were accordingly placed in the imaging chamber (a glass bottom petri dish with a cover slip to “clamp” oocytes; [Citation51]) prior to anaphase initiation. Anaphase initiation was monitored by time lapse imaging, based on chromosome separation (or “stretching”) as shown in the figures. All post-anaphase time points reported here were based on time lapse imaging of individual oocytes. Imaging was acquired with a 63x oil objective on a Zeiss Axiovert microscope with a Bio-Rad MRC-1024 laser-scanning confocal system in our lab (); ); ); )) or a Leica DMI6000B microscope with a Quorum spinning disk confocal system at the imaging core of University of Ottawa (); )). The Bio-Rad MRC-1024 is equipped with two laser lines at 488 nm and 568 nm respectively. The fluorescence filters are 522/35 nm (for 488 nm excitation) and 605/32 nm (for 568 nm excitation). We used simultaneous image acquisition mode in experiments involving two fluorophores (; ); ; )). The Quorum spinning disk uses an electron multiplying CCD (EMCCD) camera to record fluorescence images so sequential imaging mode was employed () and )), 405 nm excitation and 460/50 nm emission filter for DAPI; 490 nm excitation and 522/45 nm emission filter for GFP; 561 nm excitation and 610/80 nm emission filter for mCherry. Time-lapse imaging was taken at various time intervals and the z-sections are typically 1–2 μm thick. Images were processed and presented using Volocity 6.3 or ImageJ-Fiji. All images/frames in a time series or movie, often of multiple segments, were acquired with the same settings during time-lapse imaging of the same oocyte.
Polar body abscission assay
To assess abscission, the oocytes were injected with fluorescently labeled dextran (Texas RedTM, 3000 MW; D3328, Invitrogen; 10 mg/mL; 20 nL per oocyte) at the indicated time. Since this injection also triggers second polar body emission [Citation51], the second polar body was always labeled with dextran fluorescence, hence serving as an internal control. At least 15 minutes following dextran injection, oocytes were examined by confocal microscopy. The fluorescence status of the first polar body indicated if abscission occurred at the time of dextran injection. In rare occasions when dextran injection did not activate the oocytes, metaphase II spindle, instead of second polar body, was observed along with the first polar body. Fluorescence ratio was calculated as relative dextran fluorescence of the first polar body over that of the second polar body (or the cortical region near metaphase II spindle). To determine the effect of DB-BAPTA on polar body abscission, individual oocytes expressing eGFP-H2B were monitored for anaphase initiation. Five (5) minutes after the initiation of chromosome separation, the oocyte was injected with 10 nL of water (as control) or DB-BAPTA (25 mM in water). The injected oocytes were examined one hour later for polar body abscission as described above. Since DB-BAPTA disrupts metaphase II spindle and prevents second polar body emission [Citation22], dextran fluorescence ratio was calculated as relative dextran fluorescence of the first polar body over that of the cortical region near metaphase II chromosomes.
Construction of TubeCaMP3
First, we inserted the microtubule-binding sequence, EMTB (amino acids 18–282 of ensconsin) [Citation27] to pCS2-GCaMP3 [Citation22]. The EMTB sequence was cloned from the EMTB-2x mCherry plasmid (Addgene #26742) [Citation29] using the following two primers (forward and reverse respectively): 5’-TAT GAA TTC ACC ATG GCA GTG CGA AGC GAA ACA-3’ and 5’-TAT GAA TTC GAA GAG CCC TCA GGT GG −3’. The EMTB fragment was digested by EcoRI restriction endonuclease followed by inserting into pCS2-GCaMP3 [Citation22], recosulting in pCS2-EMTB-GCaMP3. pCS2-EMTB-GCaMP3 was linearized by inverse PCR using the following primers: 5’- ATG GCA GTG CGA AGC GAA AC −3’ and 5’- GGT GAA TTC GAA TCG ATG GGA TCC TG −3’. The complete reading frame of mCherry (one copy) was amplified using the following PCR primers (5’- CGA TTC GAA TTC ACC GCC ACC ATG GTG AGC AAG −3’ and 5’- GCT TCG CAC TGC CAT CTT GTA CAG CTC GTC CAT G − 3’), resulting in a PCR product containing 15 bp homology to the linearized pCS2-EMTB-GCaMP3 plasmid on either side of the mCherry reading frame. pCS2-EMTB-GCaMP3 and an mCherry fragment is then combined by In-Fusion® cloning technique [Citation52], resulting in pCS2-mCherry-EMTB-GCaMP3 (TubeCaMP3).
Uncaging of NPE-caged IP3
NPE-caged inositol 1,4,5-trisphosphate or caged IP3 (Invitrogen, I23580) was prepared at 0.5 mM in water and stored at −20°C. Caged IP3 was injected into the oocytes at a final concentration of 1–1.5 μM before imaging. To “uncage” IP3, the oocyte was exposed to UV excitation (filter set: Chroma 11000V3, 350/50 nm; light source: 100 W mercury bulb) through a 63x oil objective. UV exposure time was precisely controlled by an electronic shutter (LAMBDA SC, Sutter Instrument) via the manufacturer’s program. The oocyte was simultaneously subjected to confocal imaging through the same objective.
Fluorescent probes
The plasmids for eGFP-H2B, mRFP-H2B, Lck-mCherry, eGFP-PKCβ-C2, mRFP- and eGFP-PKCβ-C2 and Anillin-GFP have been described previously [Citation22,Citation29,Citation35,Citation53]. All cDNA constructs were linearized before transcribed in vitro using Ambion SP6 mMESSAGE kit. mRNAs were individually titrated for injection into immature oocytes. Typically, mRNA-injected oocytes were incubated for at least 12 hours to allow protein expression before the addition of progesterone to induce meiotic maturation. Organic calcium probes Oregon Green 488 BAPTA-2 or OG-2 (Kd = 580 nM, Invitrogen, O6808). Oregon Green 488 BAPTA-6 f or OG-6 f (Kd = 3 µM, Invitrogen, O23990) were dissolved in water (2–4 mM) and stored at −20°C. They were injected into oocytes at the final concentration of micromolar range (2.5–5 µM) before imaging.
Statistics
Mean values were compared with Student’s t-test (two tailed) or One-way ANOVA and Tukey’s HSD test. P < 0.05 is considered significant.
Supplemental Material
Download Zip (821.1 KB)Acknowledgments
We thank Dr. Chloë van Oostende-Triplet and Ms. Skye McBride of University of Ottawa Image Core for advice and assistance during this study. GM is a recipient of a scholarship from China Scholarship Council, and a Designation 2020 Faculty of Medicine Scholarship of University of Ottawa.
Disclosure statement
No potential conflict of interest was reported by the author(s).
Data Availability Statement
The authors confirm that the data supporting the findings of this study are available within the article [and/or] its supplementary materials.
Supplementary material
Supplemental data for this article can be accessed online at https://doi.org/10.1080/15384101.2022.2092815
Additional information
Funding
References
- Steigemann P, Gerlich DW. Cytokinetic abscission: cellular dynamics at the midbody. Trends Cell Biol. 2009;19:606–616.
- Goliand I, Adar-Levor S, Segal I, et al. Resolving ESCRT-III spirals at the intercellular bridge of dividing cells using 3D STORM. Cell Rep. 2018;24:1756–1764. S2211-1247(18)31154-9 [pii].
- Tarrason RG, Hurtig F, Bray S, et al. The proteasome controls ESCRT-III-mediated cell division in an archaeon. Science. 2020;369. 369/6504/eaaz2532 [pii]. DOI:10.1126/science.aaz2532
- Yang D, Rismanchi N, Renvoise B, et al. Structural basis for midbody targeting of spastin by the ESCRT-III protein CHMP1B. Nat Struct Mol Biol. 2008;15:1278–1286.
- Norden C, Mendoza M, Dobbelaere J, et al. The NoCut pathway links completion of cytokinesis to spindle midzone function to prevent chromosome breakage. Cell. 2006;125:85–98.
- Mendoza M, Norden C, and Durrer K, et al. A mechanism for chromosome segregation sensing by the nocut checkpoint . Nat. Cell Biol; 2009;11:477–483.
- Steigemann P, Wurzenberger C, Schmitz MH, et al. Aurora B-mediated abscission checkpoint protects against tetraploidization. Cell. 2009;136:473–484.
- Capalbo L, Montembault E, Takeda T, et al. The chromosomal passenger complex controls the function of endosomal sorting complex required for transport-III Snf7 proteins during cytokinesis. Open Biol. 2012;2:120070. rsob120070 [pii].
- Carlton JG, Caballe A, Agromayor M, et al. ESCRT-III governs the Aurora B-mediated abscission checkpoint through CHMP4C. Science. 2012;336:220–225. science.1217180 [pii].
- Severson AF, Hamill DR, Carter JC, et al. The Aurora-related kinase AIR-2 recruits ZEN-4/CeMKLP1 to the mitotic spindle at metaphase and is required for cytokinesis. Curr Biol. 2000;10:1162–1171.
- Hebras C, McDougall A. Urochordate ascidians possess a single isoform of Aurora kinase that localizes to the midbody via TPX2 in eggs and cleavage stage embryos. PLoS One. 2012;7:e45431.
- Sagona AP, Nezis IP, Pedersen NM, et al. PtdIns(3)P controls cytokinesis through KIF13A-mediated recruitment of FYVE-CENT to the midbody. Nat Cell Bio. 2010;12:362–371.
- You SY, Park YS, Jeon HJ, et al. Beclin-1 knockdown shows abscission failure but not autophagy defect during oocyte meiotic maturation. Cell Cycle. 2016;15:1611–1619.
- Fremont S, Echard A. Membrane traffic in the late steps of cytokinesis. Curr Biol. 2018;28:R458–R470. S0960-9822(18)30021-6 [pii].
- Pollard TD. Nine unanswered questions about cytokinesis. J Cell Biol. 2017; 216: 3007–3016. [pii].
- Burgoyne RD, Clague MJ. Calcium and calmodulin in membrane fusion. Biochim Biophys Acta. 2003;1641:137–143. S0167488903000892 [pii].
- Maddox AS, Azoury J, Dumont J. Polar body cytokinesis. Cytoskeleton (Hoboken). 2012;69:855–868.
- Zhang X, Ma C, Miller AL, et al. Polar body emission requires a RhoA contractile ring and Cdc42-mediated membrane protrusion. Dev Cell. 2008;15:386–400.
- Plachot M, de GJ, Junca AM, et al. From oocyte to embryo: a model, deduced from in vitro fertilization, for natural selection against chromosome abnormalities. Ann Genet. 1987;30:22–32.
- Shao H, Li R, Ma C, et al. Xenopus oocyte meiosis lacks spindle assembly checkpoint control. J Cell Biol. 2013;201:191–200.
- Ma C, Benink HA, Cheng D, et al. Cdc42 activation couples spindle positioning to first polar body formation in oocyte maturation. Curr Biol. 2006;16:214–220.
- Li R, Leblanc J, He K, et al. Spindle function in Xenopus oocytes involves possible nanodomain calcium signaling. Mol Biol Cell. 2016;27:3273–3283. [pii].
- Busa WB, Nuccitelli R. An elevated free cytosolic Ca2+ wave follows fertilization in eggs of the frog, Xenopus laevis. J Cell Biol. 1985;100:1325–1329.
- Cork RJ, Cicirelli MF, Robinson KR. A rise in cytosolic calcium is not necessary for maturation of Xenopus laevis oocytes. Dev Biol. 1987;121:41–47.
- Sun L, Machaca K. Ca(2+)(cyt) negatively regulates the initiation of oocyte maturation. J Cell Biol. 2004;165:63–75.
- Robinson KR. Maturation of Xenopus oocytes is not accompanied by electrode-detectable calcium changes. Dev Biol. 1985;109:504–508. 0012-1606(85)90475-0 [pii].
- Bulinski JC, Odde DJ, Howell BJ, et al. Rapid dynamics of the microtubule binding of ensconsin in vivo. J Cell Sci. 2001;114:3885–3897.
- Tian L, Hires SA, Mao T, et al. Imaging neural activity in worms, flies and mice with improved GCaMP calcium indicators. Nat Methods. 2009;6:875–881.
- von Dassow G, Verbrugghe KJ, Miller AL, et al. Action at a distance during cytokinesis. J Cell Biol. 2009;187:831–845.
- Davenport NR, Sonnemann KJ, Eliceiri KW, et al. Membrane dynamics during cellular wound repair. Mol Biol Cell. 2016;27:2272–2285. mbc.E16-04-0223 [pii].
- Bement WM, Benink HA, von Dassow G. A microtubule-dependent zone of active RhoA during cleavage plane specification. J Cell Biol. 2005;170:91–101.
- Dargan SL, Parker I. Buffer kinetics shape the spatiotemporal patterns of IP3-evoked Ca2+ signals. J Physiol. 2003;553:775–788. jphysiol.2003.054247 [pii].
- Paredes RM, Etzler JC, Watts LT, et al. Chemical calcium indicators. Methods. 2008;46:143–151. S1046-2023(08)00159-X [pii].
- Halet G, Tunwell R, Parkinson SJ, et al. Conventional PKCs regulate the temporal pattern of Ca2+ oscillations at fertilization in mouse eggs. J Cell Biol. 2004;164:1033–1044.
- Yu HY, Bement WM. Control of local actin assembly by membrane fusion-dependent compartment mixing. Nat Cell Bio. 2007;9:149–159.
- Clark AG, Miller AL, Vaughan E, et al. Integration of single and multicellular wound responses. Curr Biol. 2009;19:1389–1395.
- Liu J, Fairn GD, Ceccarelli DF, et al. Cleavage furrow organization requires PIP(2)-mediated recruitment of anillin. Curr Biol. 2012;22:64–69. S0960-9822(11)01322-4 [pii].
- Hickson GR, O’Farrell PH. Rho-dependent control of anillin behavior during cytokinesis. J Cell Biol. 2008;180:285–294.
- Maddox AS, Lewellyn L, Desai A, et al. Anillin and the septins promote asymmetric ingression of the cytokinetic furrow. Dev Cell. 2007;12:827–835.
- Parry H, McDougall A, Whitaker M. Microdomains bounded by endoplasmic reticulum segregate cell cycle calcium transients in syncytial Drosophila embryos. J Cell Biol. 2005;171:47–59.
- Parry H, McDougall A, Whitaker M. Endoplasmic reticulum generates calcium signalling microdomains around the nucleus and spindle in syncytial Drosophila embryos. Biochem Soc Trans. 2006;34:385–388.
- Lu L, Ladinsky MS, Kirchhausen T. Cisternal organization of the endoplasmic reticulum during mitosis. Mol Biol Cell. 2009;20:3471–3480. E09-04–0327. [pii].
- FitzHarris G, Marangos P, Carroll J. Changes in endoplasmic reticulum structure during mouse oocyte maturation are controlled by the cytoskeleton and cytoplasmic dynein. Dev Biol. 2007;305:133–144.
- Lin H, Nguyen P, Vancura A. Phospholipase C interacts with Sgd1p and is required for expression of GPD1 and osmoresistance in Saccharomyces cerevisiae. Mol Genet Genomics. 2002;267:313–320.
- Nozawa K, Satouh Y, Fujimoto T, et al. Sperm-borne phospholipase C zeta-1 ensures monospermic fertilization in mice. Sci Rep. 2018;8:1315. 10.1038/s41598-018-19497-6 [pii].
- Miller AL, Fluck RA, McLaughlin JA, et al. Calcium buffer injections inhibit cytokinesis in Xenopus eggs. J Cell Sci. 1993;106(Pt 2):523–534.
- Chircop M, Malladi CS, Lian AT, et al. Calcineurin activity is required for the completion of cytokinesis. Cell Mol Life Sci. 2010;67:3725–3737.
- Scheffer LL, Sreetama SC, Sharma N, et al. Mechanism of Ca(2)(+)-triggered ESCRT assembly and regulation of cell membrane repair. Nat Commun. 2014;5:5646. ncomms6646 [pii].
- Schiel JA, Prekeris R. Membrane dynamics during cytokinesis. Curr Opin Cell Biol. 2013;25:92–98. S0955-0674(12)00175-5 [pii].
- Liu XS, Liu XJ. Oocyte isolation and enucleation. Methods Mol Biol. 2006;322:31–41.
- Leblanc J, Zhang X, McKee D, et al. The small GTPase Cdc42 promotes membrane protrusion during polar body emission via ARP2-nucleated actin Polymerization. Mol Hum Reprod. 2011;17:305–316.
- Raman M, Martin K. One solution for cloning and mutagenesis: in-Fusion®HD Cloning Plus. Nat Methods. 2014;11:iii–iv.
- Miller AL, Bement WM. Regulation of cytokinesis by Rho GTPase flux. Nat Cell Bio. 2009;11:71–77.